Comparative Study of Performance of Chemical
Reaction Optimization with Genetic Algorithm (GA)
Shekhar L.Pandharipande
Associate Professor
Department of Chemical Engineering, LIT RTMNU, Nagpur, India
Aasheesh Kumar Dixit
B.Tech, VII semester Chemical Engineering,LIT
RTMNU, Nagpur, India
ABSTRACT
Chemical reaction optimisation (CRO) is well suited in searching global solutions to varied nature of optimisation problems. It is amongst newer methods of evolutionary algorithms, nature inspired meta-heuristics for optimisation. A chemical reaction is a process of transforming reactants; the unstable substances into products the relatively stable ones. In chemical reactions, the reactants with some initial energy interact with each other through a sequence of elementary steps. At the end, molecules with minimum energy to support their stable structure are formed. This phenomenon is the source of inspiration in development of algorithm for CRO to get optimal solution.
Present work aims at development of CRO using MATLAB©. It also aims in study of dynamics of various parameters of CRO in searching optimum solutions. It is further extended in comparative studies of performance of CRO with other conventional as well as evolutionary optimisation methods such as Genetic Algorithm. Numerical experiments for two test functions in the category of non-linear constrained optimisation problems reported in the literature are carried. The results are indicative of the utility of CRO and its performance is observed at par with other optimisation methods. It can be concluded that there is lot of potential in CRO as an effective alternate optimisation method with universal applicability. There is need for more numerical experimentation to substantiate this claim.
Keywords
Non-Linear Constrained Optimisation Problems, Chemical Reaction Optimisation, Genetic Algorithm
1.
INTRODUCTION
Nature is creator, caretaker, destroyer and reformer of variety of complex processes happening in and around us. These complex processes are operating over the 1000s of years with minimum possible usage of energy. Nature with its ability to operate processes with several complexities is a great source of inspiration to researchers & workers from different disciplines. When it comes to mathematics and computer science, mimicking the behaviour of some of the natural processes to achieve goal oriented activities is called nature – inspired computing. [1]
Chemical Reaction Optimisation is one of the evolutionary algorithms, mimicking chemical reaction processes that can be employed in obtaining solutions to varied nature of optimisation problems. [2]
Optimization of engineering operations is still a challenging task. Target functions are often nonlinear and discontinuous. There are several processes having input parameters such as flow rate, temperature, pressure, concentration with output parameters like yield, purity and costs.
2.
INSPIRATION BEHIND CRO
The first law of thermodynamics states that energy cannot be created nor be destroyed; but can be transformed from one form to another; the sum of total energy of molecules in a given system is constant. A chemical reacting system consists of chemical substances and its surrounding. Each chemical substance possesses potential and kinetic energy. Potential energy is the energy stored in a molecule with respect to its molecular configuration.
The second law states that the entropy of a system tends to increase, where entropy is the measure of the degree of disorder. In CRO, these features of transformation of energy are utilized in developing algorithm. [1]
2.1
Developing CRO
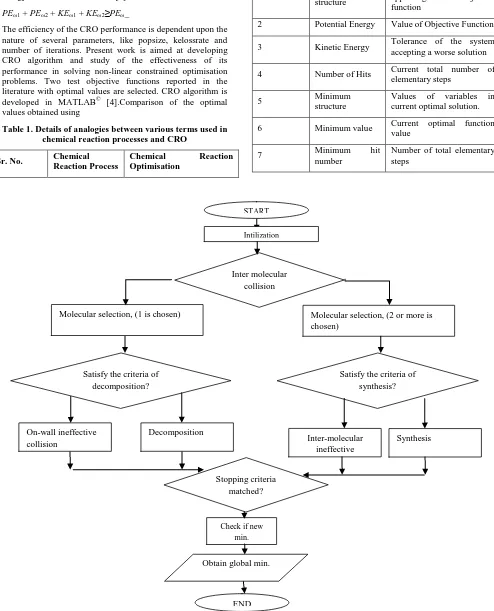
The flow chart for developing CRO algorithm is given in figure 1.Similarly table 1 gives the details of analogies between various terms used in chemical reaction processes and CRO.
2.1.1
Initialisation
The parameters of CRO like potential energy, ke energy, popsize, buffer, ke energy loss rate, number of iterations are defined using appropriate assumptions. The molecules representing the variables in the given range are generated randomly. Next step defines procedure for selection of random molecule(s), deciding the type of collision by randomly generated parameter (molecoll), and comparing it with predetermined criteria. The next step is selection of molecule(s) which is decided by random generation of parameter (molecoll).
The molecule(s) undergoes one of the following elementary reactions according to the criteria they fall into:
On-wall ineffective collision: This type of collision represents the situation when a molecule collides with a wall of the container and then bounces away remaining in one single unit. The transformation of molecular structure is represented as follows: ω → ω_ Decomposition: Decomposition refers to the situation when a molecule hits a wall and then breaks into several smaller parts. Assume that ω produces ω1
_
and ω2 _
, i.e., any mechanism, which can produce ω1_ and ω2_ from ω, is
allowed. ω → ω1_ + ω2
Inter-molecular ineffective collision: Inter molecular ineffective collision takes place when multiple molecules collide with each other and then bounces away. The molecularity (assume 2) remains unchanged before and after the process, i.e. ω1+ ω2 ω 1’ + ω2’
As only one molecule is produced, it is likely to satisfy the energy conservation condition: [1]
PEω1 + PEω2 + KEω1 + KEω2≥PEω_
[image:2.595.52.546.91.702.2]The efficiency of the CRO performance is dependent upon the nature of several parameters, like popsize, kelossrate and number of iterations. Present work is aimed at developing CRO algorithm and study of the effectiveness of its performance in solving non-linear constrained optimisation problems. Two test objective functions reported in the literature with optimal values are selected. CRO algorithm is developed in MATLAB© [4].Comparison of the optimal values obtained using
Table 1. Details of analogies between various terms used in chemical reaction processes and CRO
Sr. No. Chemical
Reaction Process
Chemical Reaction
Optimisation
1 Molecular
structure
Values of variables appearing in objective function
2 Potential Energy Value of Objective Function
3 Kinetic Energy Tolerance of the system accepting a worse solution 4 Number of Hits Current total number of
elementary steps
5 Minimum
structure
Values of variables in current optimal solution. 6 Minimum value Current optimal function
value
7 Minimum hit
number
Number of total elementary steps
Fig 1: Flowchart for the development of CRO algorithm
Molecular selection, (1 is chosen) Molecular selection, (2 or more is chosen)
Satisfy the criteria of decomposition?
Satisfy the criteria of synthesis?
On-wall ineffective collision
Decomposition
START
Intilization
Inter molecular collision
Inter-molecular ineffective
Synthesis
Stopping criteria matched?
Check if new min.
3.
NUMERICAL EXPERIMENTS
Two types of test objective functions have been considered for numerical experimentation & CRO is used for obtaining optimal value.
3.1
Test Function 1
Non-Linear Objective function with linear inequality constraints:
Function: maximize f (x, y) = x*y
Subject to:
x2 + y < 3 ; 0 <= x <= 1 ; 0 <= y <= 2
Conventional Technique: The objective function has been solved using SUMT that includes approximation of linear programming. Similarly GA has been applied to solve the equation as reported in the literature. [3]
Chemical Reaction Optimisation (CRO) Technique: The present work optimizes the function by employing the developed CRO algorithm. The optimal values are obtained for the various values of parameters like popsize, k, and ke loss rate.
Section 3.1.1 represent graphs showing comparison between the best objective function values obtained by varying parameters, K, kelossrate & popsize respectively
Section 3.1.2 gives the plot between the objective function values obtained for various combinations of CRO parameters as a function of number of runs.
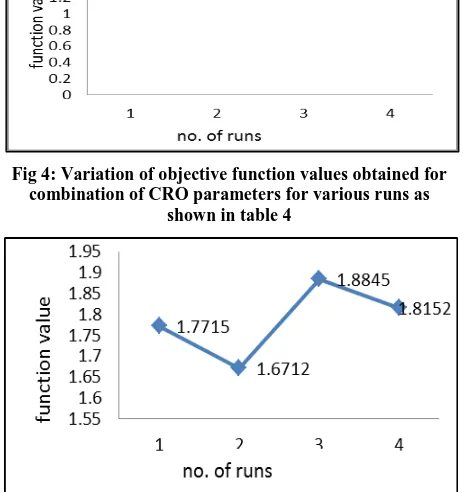
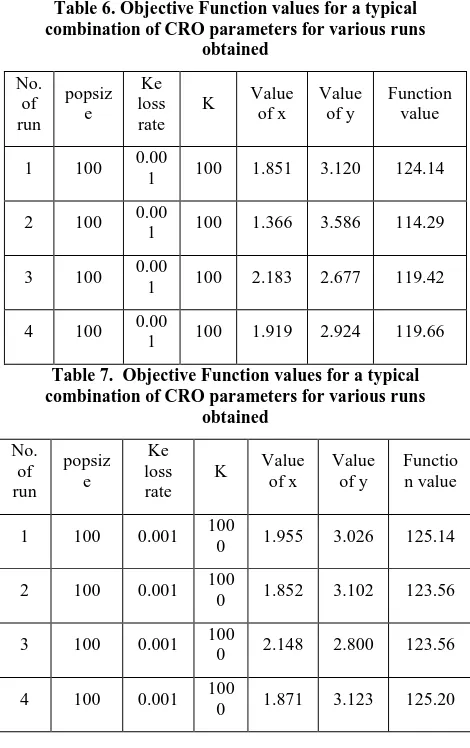
Table Nos. 2, 3, 4 & 5 give the details of the best values of the function obtained for the corresponding combination of the values of the various parameters of CRO selected. Fig no. 2, 3, 4 & 5 depict the graphical representation of the same.
Table 2. Objective Function values for a typical combination of CRO parameters for various runs
obtained No. of run Popsize Ke loss rate
K Value of x
Value of y
[image:3.595.314.556.72.535.2]Function value 1 100 .001 1000 .9433 1.9556 1.8447 2 100 .001 1000 .8396 1.9468 1.6346 3 100 .001 1000 .9187 1.9415 1.7837 4 100 .001 1000 .945 1.9791 1.8703
Table 3. Objective Function values for a typical combination of CRO parameter for various runs obtained
No. of run popsize Ke loss rate
K Value of x
Value of y
Function value 1 100 .001 100 .9735 1.8074 1.7594 2 100 .001 100 .9459 1.9629 1.8567 3 100 .001 100 .9629 1.9612 1.8884 4 100 .001 100 .8381 1.9724 1.6532
Table 4. Objective Function values for a typical combination of CRO parameters for various runs
obtained
Table 5. Objective Function values for a typical combination of CRO parameters for various runs
obtained
Fig 2: Variation of objective function values obtained for combination of CRO parameters for various runs as
shown in table 2
Fig 3: Variation of objective function values obtained for combination of CRO parameters for various runs as
shown in table 3
No. of run popsize ke loss rate
K Value of x
Value of y
Function value
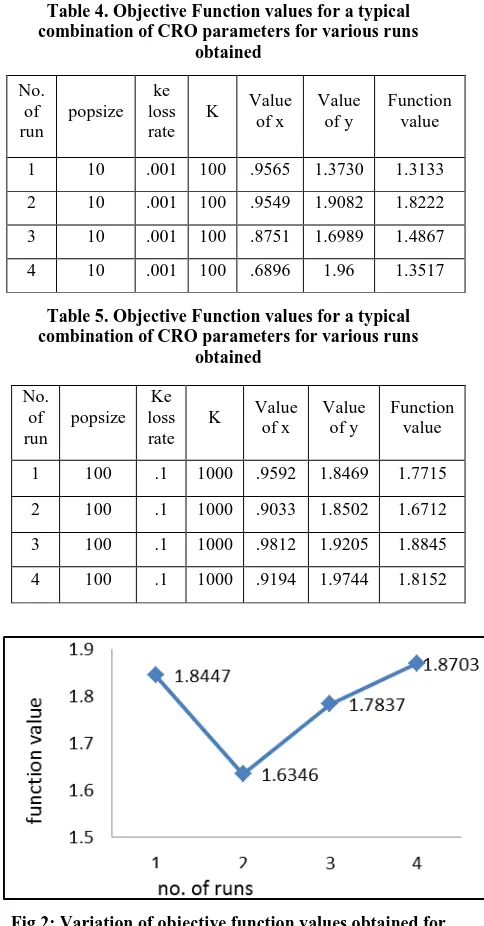
1 10 .001 100 .9565 1.3730 1.3133 2 10 .001 100 .9549 1.9082 1.8222 3 10 .001 100 .8751 1.6989 1.4867 4 10 .001 100 .6896 1.96 1.3517
No. of run popsize Ke loss rate
K Value of x
Value of y
Function value
[image:3.595.47.288.475.701.2]Fig 4: Variation of objective function values obtained for combination of CRO parameters for various runs as
shown in table 4
Fig 5: Variation of objective function values obtained for combination of CRO parameters for various runs as
shown in table 5
3.1.1
Comparison of Objective Function Values
for Various Combinations of CRO Parameters for
Test Function 1
Figure No. 6,7 & 8 represent graphs showing comparison between the best objective function values obtained by varying parameters, K, kelossrate & popsize respectively
[image:4.595.53.281.79.235.2]Fig 6: Effect of no. of iterations on objective function values obtained for various runs
[image:4.595.313.556.81.250.2]Fig 7: Effect of ke lossrate on objective function values obtained for various runs
Fig 8: Effect of popsize on objective function values obtained for various runs
3.1.2
Comparison of Objective Function Values
for Different Combinations of CRO Parameter for
Various Runs
[image:4.595.52.284.123.369.2]Figure 9 depicts the comparison of optimal objective functions values obtained by set of tuned parameters of CRO for various runs.
Fig 9: Comparison of Objective function values for different combinations of CRO parameter
3.2
Test Function 2
Non-Linear Objective function with linear inequality constraints:
[image:4.595.312.558.474.651.2] [image:4.595.54.283.497.673.2]Conventional technique: The objective function can be solved using penalty function method that includes approximation of linear programming. Similarly GA has been applied to solve the equation as reported in the literature. [3]
Chemical Reaction Optimisation (CRO) technique: The present work optimizes the function by employing the developed CRO algorithm. The optimal values are obtained for the various values of parameters like popsize, k, and ke loss rate.
Table nos. 6, 7, 8 & 9 give the details of the best values of the function obtained for the corresponding values of the various parameters of CRO. Fig No. 10, 11, 12 & 13 depicts the graphical representation of the same.
Section 3.2.1 represent graphs showing comparison between the best objective function values obtained by varying parameters, K, kelossrate & popsize respectively.
[image:5.595.308.555.89.588.2]Section 3.2.2 gives the plot between the objective function values obtained for various combinations of CRO parameters as a function of number of runs
Table 6. Objective Function values for a typical combination of CRO parameters for various runs
obtained No. of run popsiz e Ke loss rate
K Value of x
Value of y
Function value
1 100 0.00
1 100 1.851 3.120 124.14 2 100 0.00
1 100 1.366 3.586 114.29 3 100 0.00
1 100 2.183 2.677 119.42 4 100 0.00
1 100 1.919 2.924 119.66
Table 7. Objective Function values for a typical combination of CRO parameters for various runs
obtained No. of run popsiz e Ke loss rate
K Value of x
Value of y
Functio n value
1 100 0.001 100
0 1.955 3.026 125.14 2 100 0.001 100
0 1.852 3.102 123.56 3 100 0.001 100
0 2.148 2.800 123.56 4 100 0.001 100
0 1.871 3.123 125.20
Table 8. Objective Function values for a typical combination of CRO parameters for various runs
obtained No. of run popsize Ke loss rate
K Value of x
Value of y
Function value 1 10 0.001 1000 1.9293 2.4969 103.03 2 10 0.001 1000 1.9398 2.9425 121.22 3 10 0.001 1000 2.0821 2.8112 121.53
4 10 0.001 1000 1.1124 3.4953 97.77
Table 9. Objective Function values for a typical combination of CRO parameters for various runs
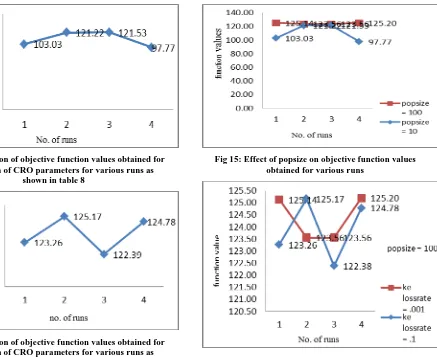
obtained No. of run popsize Ke loss rate
K Value of x
Value of y
Function value 1 100 0.1 1000 1.781 3.1851 123.26 2 100 0.1 1000 2.2351 2.7643 125.17 3 100 0.1 1000 2.2825 2.6669 122.39 4 100 0.1 1000 1.998 2.9717 124.78
Fig 10: Variation of objective function values obtained for combination of CRO parameters for various runs as
shown in table 6
Fig 11: Variation of objective function values obtained for combination of CRO parameters for various runs as
[image:5.595.49.284.300.674.2]Fig 12: Variation of objective function values obtained for combination of CRO parameters for various runs as
shown in table 8
Fig 13: Variation of objective function values obtained for combination of CRO parameters for various runs as
shown in table 9
3.2.1
Comparison of Objective Function Values
for Various Combinations of CRO Parameters For
Test Function 2
[image:6.595.57.298.69.401.2]Fig. No. 14, 15 & 16 represent graphs showing comparison between the best objective function values obtained by varying parameters, K, kelossrate & popsize respectively
[image:6.595.314.555.212.411.2]Fig 14: Effect of no. of iterations on objective function values obtained for various runs
Fig 15: Effect of popsize on objective function values obtained for various runs
Fig 16: Effect of ke lossrate on objective function values obtained for various runs
3.2.2
Comparison of Objective Function Values
for Different Combinations of CRO Parameter for
Various Runs
Figure 17 depicts the comparison of optimal objective functions values obtained by set of tuned parameters of CRO for various runs
[image:6.595.54.293.517.662.2] [image:6.595.318.558.521.682.2]3.3
Comparison of Performance of CRO
and GA
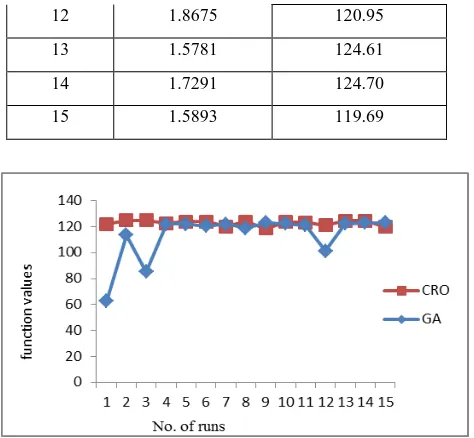
The effectiveness of CRO in arriving optimal solution of test functions used in present work is gauged by comparing its performance with other evolutionary method such as GA. Test function 1: Fifteen consecutive optimal values obtained with selected tuned CRO parameters, i.e. popsize = 100, kelossrate = .001 and k =500, are given in table 10.
Test function 2: Fifteen consecutive optimal value obtained with selected tuned CRO parameters, i.e. popsize = 100, kelossrate = .001 and k =500, are given in table 10.
The GA values for test functions 1 & 2 are reported in the literature. [1]
Figure no. 17 & 18 shows the comparison between function values of CRO & GA for fifteen runs respectively.
Table 10: Fifteen consecutive optimal values of CRO for test function 1 and test function 2
No. of runs
CRO (test function 1)
CRO (test function 2)
F(x,y) F(x,y)
1 1.8286 121.88
2 1.6460 124.93
3 1.8517 124.92
4 1.8634 122.61
5 1.6796 123.98
6 1.9794 123.93
7 1.7315 119.99
8 1.7895 123.88
9 1.8435 118.51
10 1.7471 123.65
11 1.6035 123.37
12 1.8675 120.95
13 1.5781 124.61
14 1.7291 124.70
[image:7.595.311.549.69.530.2]15 1.5893 119.69
Fig 17: Variation of objective function value in objective test function 1, obtained by fifteen consecutive runs of
CRO & GA
Fig 18: Variation of objective function value in objective test function 2, obtained by fifteen consecutive runs of
CRO & GA
4.
RESULTS AND DISCUSSION
Test function 1:
It can be observed that no. of iterations is not necessarily proportional to the better optimal value of function. This is due to probabilistic nature of CRO & there is an element of randomness in its search.
The ke lossrate is not affecting the overall performance of CRO.
More consistency is observed in the performance of CRO at lower popsize.
Test function 2:
It is observed that for more number of iterations the value of objective function obtained is more close to optimal value.
The ke lossrate does not affect the overall performance of CRO.
More consistency is observed in objective functional value with more popsize.
Comparison between CRO & GA for test function 1:
The CRO optimal value is 1.9794 whereas using GA it is 1.892.
The maximum value obtained by CRO is more in most of the runs and are quiet close to each other. Comparison between CRO & GA for test function 2:
The CRO optimal value is 124.93 whereas using GA it is 123.133.
The maximum value obtained by CRO is more in most of the runs and are quiet close to each other.
It can also be observed that the values of objective function are more bound and close in CRO as compared to those obtained using GA. The maximum value obtained by CRO is higher in most of the runs and are quiet close to each other.
[image:7.595.315.552.70.289.2] [image:7.595.55.279.289.568.2]5.
CONCLUSION
CRO is an emerging evolutionary method for optimisation inspired by principals of chemical reaction process mechanism. The main advantage of CRO over the conventional methods is in universality approach in providing solutions to variety of optimisation problems.
The present work is successful in developing an algorithm for CRO in obtaining optimal values. It has studied the effect of parameters such as no. of iterations, popsize and ke lossrate on its performance. It can be said on the basis of observation that the performance of CRO is definitely dependent on the parameters.
Two test numerical involving non-linear constrained optimisation situations have been studied for comparison of CRO performance with conventional as well as genetic algorithm techniques. The optimal values obtained using CRO are indicative that better optimal solutions can be obtained then other methods studied in the present work. . The work is demonstrative and given the wide variety of optimisation problems, it is felt necessary to extend this method to many more test functions to substantiate the claims made.
It can be concluded that there is tremendous potential in this newer method of evolutionary algorithm, and can be applied
to wide range of problems involving non-linear constrained optimisation problems.
6.
ACKNOWLEDGEMENT
Authors are thankful to The Director, Laxminarayan Institute of Technology for his constant support. We are also grateful to VNIT, Nagpur for providing computational facilities.
7.
REFERENCES
[1] Albert Y.S. Lam and Victor O.K. Li, “Chemical Reaction Optimization: a tutorial”, February 2012, Memetic comp. (2012) 4:3 -17, DOI 10.1007/S12293-012-0075-1
[2] Albert Y.S. Lam and victor O.K. Li, “Chemical Reaction Inspired Metaheuristic For Optimization”, June 2010, IEEE Transactions on Evolutionary Computations, Vol. 14, no. 3
[3] S.L Pandhripande, Aarti R Deshmukh., and Rohit P Kalnake, “Genetic Algorithm for constrained optimization with stepwise approach in search interval selection of variables”, February 2014, International Journal of Computer Applications (0975 – 8887), volume 87 – no. 11