Munich Personal RePEc Archive
A Breath of Fresh Air? Firm types,
scale, scope and selection effects in drug
development
Arora, Ashish and Gambardella, Alfonso and Magazzini,
Laura and Pammolli, Fabio
IMT Institute For Advanced Studies, Lucca
March 2007
A Breath of Fresh Air?
Firm type, scale, scope and selection effects in drug development
Ashish Arora
Heinz School, Carnegie Mellon University, Pittsburgh, PA, & Fuqua School of Business, Duke University
Alfonso Gambardella Bocconi University, Milan, Italy
Laura Magazzini
Dept. of Economics, University of Verona, Italy
Fabio Pammolli
University of Florence, and IMT – Lucca Institute for Advanced Studies, Italy
This paper compares the innovation performance of established pharmaceutical firms with
biotech companies, controlling for differences in the scale and scope of research. We develop a
structural model estimated with data on over 3,000 drug R&D projects in preclinical and clinical
trials in the US from 1980-94, and followed till 2005. Key to our approach is careful attention to
the issue of selection. Firms choose which compounds to advance into clinical trials. This choice
depends not only on the technical promise of the compound, but also on commercial
considerations such as the expected profitability of the market or concerns about product
cannibalization. After controlling for selection, we find that: a) even after controlling for scale
and scope in research, established pharmaceutical firms have superior innovation performance
than newly entered biotech firms; b) older biotech firms are more similar to the established firms
both in terms of selection behavior and innovation performance; c) compounds licensed by
pharmaceutical firms are as likely to succeed as internal developed projects of the licensor, which
is inconsistent with the “lemons” hypothesis in technology markets.
1. Introduction
Understanding the determinants of the innovative performance of firms is central to innovation and
entrepreneurship research. Yet, the development of innovations by firms is not just a matter of technical
ability. Incentives matter as well. A classical example is Arrow (1962), whereby larger firms have lower
incentives to innovate, for fear of cannibalizing existing products. Similarly, if a firm faces a larger
potential market or has established downstream commercialization capabilities, it will have higher
innovation incentives. Therefore, in studying the drivers of innovation performance, it is important to
distinguish between incentives and capability, as one may confound lack of incentives with lower
technical capabilities or vice versa.
A key contribution of this paper is to develop and estimate a structural model that distinguishes
between these two dimensions. We use data on more than 3,000 drug R&D projects initiated between
1980 and 1994, and followed till 2005. The pharmaceutical industry is ideal for our analysis because the
drug innovation process follows well defined steps.1 New compounds are generated in the laboratory
(initial discovery), tested on animals (pre-clinical research), and if the firm considers them sufficiently
promising, both technically and economically, they are advanced into clinical trials on humans. This
process has two important regulatory gates: At the beginning of clinical trials, when an IND
(Investigational New Drug) application is filed, and at the end of the clinical trials, when an NDA (New
Drug Application) may be filed. These two main stages play an important role in our analysis.
We argue that firms do not move all technically promising compounds to clinical trials; instead,
economic considerations are also important in making this decision, creating differences in selection
behavior across firms. Thus, if one measured innovation capability by the share of pre-clinical
compounds that eventually become new drugs, one may confound selection with capability (e.g., Shaver,
1998).
1
The contribution of this paper to the literature goes beyond the mere flagging of the selection
problem and the development of a method for coping with it. We focus on two questions that can be
studied particularly well in the context of the pharmaceutical industry.
The first one is the long-standing comparison between the innovation performance of large and
small firms (e.g., Arrow 1983; Holmstrom 1989; Acs and Audretsch 1990; Henderson and Clark 1990;
Chesbrough and Teece 1996; Levinthal and March 1993). One view holds that small firms have more
flexible organizations that enhance creativity and attract more inventive minds, which makes them more
productive in R&D, whereas large firms have an advantage in commercialization. A different view holds
that economies of scale and scope, and learning advantages, make the larger firms better at innovation
(e.g., Henderson and Cockburn 1996, Macher and Boerner 2006). The comparative advantage of small
firms may lie in exploring technologies and markets that established firms are unwilling to explore
(Christensen 1997; Klepper and Thompson, 2006; Giarratana 2004). We cannot directly measure
comparative advantage. However, because R&D in the drug industry is performed by both large,
established firms and smaller biotech firms, we can estimate whether these types differ in their ability to
develop compounds successfully, which is our measure of innovation performance.
Our second question is whether “markets for technology” (Arora et al., 2001) are afflicted by a
“lemons” problem (Akerlof, 1970): Are compounds offered for license of lower quality than compounds
developed in-house? The current evidence is mixed. Danzon et al. (2005) find a positive effect of
licensing on the probability of success of drug compounds, while Pisano (1997) and Guedj (2005) find
that licensed drugs are less successful than those developed in-house. Our paper offers a test of these two
contending views.
The next section reviews the main findings of the empirical literature on drug development in the
pharmaceutical industry, and it places our contribution in context. Section 3 describes the model and
Section 4 develops our hypotheses. Section 5 describes our data and analysis. Section 6 discusses our
2. Innovation in Pharmaceuticals: The Related Literature
One group of studies on drug innovation focuses on the internal economies of the firm (economies of
scale, scope, spillovers, experience). Henderson and Cockburn (1996) study the determinants of research
(drug discovery) performance, measured by the number of important drug patents. They use data at the
level of the individual research program from the internal records of ten major pharmaceutical firms, and
find returns to scale at the level of both individual research programs and the research expenditures of the
firm as a whole, as well as evidence of economies of scope. Our paper investigates the stages after drug
discovery, as do most of the other studies described below.
Nerkar and Roberts (2004) examine the determinants of commercial success of new
pharmaceutical products. They find that proximal technological experience (patents in the same
therapeutic class) has a positive and significant effect on the first-year sales of a new product. Distal
technological experience is positive and significant only when accompanied by a high level of distal
product-market experience. Finally, they find that the interaction between distal and proximal
technological experience is negative, which suggests that focused and diversified innovations may be
alternative strategies. Nerkar (2003) also studies the relationship between experience and the probability
that a drug receives FDA approval. He hypothesizes that experience may not always lead to better
performance, if the experience is of the wrong sort (e.g., oriented towards drug discovery rather than drug
development), and if feedback is inadequate or delayed. With drug development cycles stretching to ten
years or more, researchers may be rewarded for discovery (measured by patenting) rather than
commercialization (measured by FDA approval). As a result, scientists may continue to work in areas
that provide them with clumps of patents but do not lead to commercially useful drugs. As we discuss
below, even small firms may suffer from a misalignment of incentives, as reflected in their selection
behavior.
A second group of studies looks specifically into the drug development process by using data for
projects in clinical trials. Adams and Brantner (2003) and Abrantes-Metz et al. (2006) analyze drugs in
vary substantially across observable characteristics of the drugs, including primary indication, originating
company, route of administration and chemistry. Macher and Boerner (2006) also estimate time to
complete clinical trials, but by contract research organizations (CRO) rather than integrated R&D projects
in pharmaceutical firms. They find that scale and scope economies, and experience are valuable.
Danzon et al. (2005) focus on the role that experience (both overall experience and experience in
a particular therapeutic category) and alliances have on the outcome of R&D projects. Their sample is
composed of R&D projects of over 900 firms during 1988-2000. They too find evidence of large positive
returns to a firm’s overall experience for the larger and more complex late-stage trials. They recognize,
but do not explicitly model, differences across firms in the quality of their drug candidates.
Our paper shares the approach and the goals of all these papers. However, none of these papers
addresses explicitly the concern that firms may systematically vary in how selective they are in advancing
compounds into clinical trials. As is well known, clinical trials are much more expensive than pre-clinical
trials, particularly late stage clinical trials. Which compounds make it into clinical trials depends upon
whether managers think the compounds are promising. All else equal, a compound with a higher
likelihood of successfully gaining FDA approval is more likely to get selected into clinical trials than a
compound with a lower probability of success.
But commercial considerations are also very important. Acemoglu and Linn (2004) present
evidence that larger pharmaceutical markets see more innovation. Further, a firm with downstream
marketing capabilities in a particular market (such as BMS in anti-cancer or Merck in cardiovascular)
may be able to extract greater value from a drug than a firm that lacks such capabilities, and therefore be
willing to take a chance on a compound with a lower likelihood of success. Other considerations may
also be important. A drug championed by a high status research team may be selected for clinical trials,
even if it is below threshold (Nerkar 2003). Guedj and Scharfstein (2005) point to the agency problem
between managers and investors. In biotech startups, managers typically have one or two compounds to
bet upon, and therefore try to push them into clinical trials. By contrast, larger firms have many
compound. As a result, biotech companies are more likely to advance products from phase I into phase II
clinical trials, but these compounds are more likely to fail in later stages (Guedj and Scharfstein, 2005).
In our paper, we distinguish between the pre-clinical and clinical trials, but do not separately analyze the
progress across the various clinical stages.
To appreciate further the contribution of our paper, it may be useful to compare it with Chandy et
al. (2006), who examine the “conversion ability” of firms in translating drug-related patents into new
drugs. They find that conversion ability is greatest in firms that develop an intermediate number of
drug-related patents. Since firms patent compounds soon after discovery, Chandy et al (2006), in essence,
study the success rate of pre-clinical compounds. Our analysis “unpacks” this sequence into whether the
compound is selected into clinical trials, and if selected, whether it successfully receives FDA approval,
and models the drivers of the underlying processes. This enables us to move away from the assumption
implicit in Chandy et al. that firms attempt to convert every compound. Instead, our model allows the
stringency of selection to be driven by the expected profitability of the market, the scale and scope of the
firm, and other technology, market, and firm characteristics, so that the rate at which pre-clinical
compounds succeed is determined by the factors that drive innovation performance, but also by factors
that drive selection into clinical trials. In econometric terms, what allows us to identify selection is that
the major resource commitments are made in clinical trials rather than pre-clinical trials (DiMasi, et al.
2003), so that we can assume that commercial considerations affect selection, but not the outcomes once
the compound is into clinical trials.
Finally, the literature addresses the question of whether licensed compounds are more likely to
succeed compared to integrated projects. The market for technology perspective (Arora et al. 2001)
suggests that smaller technology specialist firms and established manufacturers have comparative
advantages in different stages of the innovation process. In particular, technology specialists are
relatively more effective in upstream innovation activities that rely on creativity rather than downstream
development and commercialization, which is intensive in resources and scale. Licensing permits the
efficiency. Similarly, the network literature (e.g., Powell et al. 1996; Pammolli and Riccaboni 2004)
posits that resources are located in networks rather than individual firms. Thus, licensed compounds,
which exploit resources available in different organizations, can better exploit the fit between resource
types and the specific innovation tasks. This view, however, is agnostic that licensed compounds are
more likely to succeed than other compounds. Rather, licensing is an efficient use of resources, increasing
not necessarily the overall success rate, but rather lowering the cost of successfully developing a drug.
Zeckhauser (1996), and Pisano (1997 and 2006) argue that technology markets inefficient, and
are potentially afflicted by a “lemons” problem. Pisano (1997) finds that in-house development is
superior to licensed compounds, and Guedj (2005) finds that projects financed by pharmaceutical
companies but developed by biotech firms are more likely to fail. On the other hand, Danzon et al. (2005)
find that compounds developed in alliances (roughly equivalent to licensed compounds) have a lower
probability of failure in clinical trials. However, Danzon et al. (2005) include in their sample alliances
that were formed prior to the conclusion of each phase (up to phase III). These alliances are likely to
include marketing agreements that pharmaceutical firms often strike for successful compounds to enhance
market access, implying an upward biased estimate. We follow Guedj (2005) and only include licenses
signed before phase I clinicals, and test whether licensed compounds differ from in-house compounds.
However, comparing compounds discovered by biotech firms and licensed to pharmaceutical
firms to those discovered in-house by pharmaceutical firms is not the correct way to test for a lemons
problem. A lemons problem would exist if biotech firms systematically licensed inferior drugs to
pharmaceuticals and kept superior ones in-house. Thus, we estimate whether licensed compounds are
drawn from a different distribution than those that biotech firms develop in-house.
3. An Econometric Model of Selection and Success
To understand the interplay between selection and success we provide a simple model. After the
compound has been discovered, the firm starts preclinical trials to evaluate its properties. Preclinical
the clinical trials and receive FDA approval. Let Pg be the firm’s (unbiased) point estimate of the
(uncertain) probability of success of a particular compound. We will sometimes refer to this as the quality
of the compound. Formally, Pgij, the probability that compound i of firm j will pass clinical trials, is a
random variable drawn from a distribution with a firm specific mean, µj (the innovative capability of the
firm). Actual success or failure is only observed for compounds selected for clinical trials.
Selection: Dropping the subscripts for compound and firm to avoid clutter, let V indicate the expected net
additional revenue from the sales of the compound if it is eventually marketed, and D the net additional
clinical trial costs, which we label development costs. The firm will take the compound into clinical trials
if it expects a net profit from its development i.e. if PgV – D > 0, or Pg > D/V. We denote D/V as Pg*, a
threshold that is a function of V and D. Note that Pg* is not a random variable but a threshold value. The
probability of a compound being selected depends both on the threshold, Pg*, and the “quality” of the
compound, Pg, where the latter is itself a random variable. Thus the average probability that a compound
is selected depends upon Pg* and µ.
The selection threshold, Pg*, represents the economic and strategic dimension of selection. For
instance, firms with full pipelines of drugs under development will assess a higher net addition to
development costs (D) and hence have a high Pg*. Market profitability matters as well. To anticipate our
empirical analysis, competition in the product market will reduce the expected value, V implying a higher
Pg*. Similarly, larger markets will increase V, implying a lower Pg*. Also, public firms may have a
lower cost of capital, implying a lower D, and hence, a lower Pg*.
We assume that once a compound enters clinical trials, its future progress in clinical trials is
determined only by its technical characteristics. Our interviews with industry executives suggest that over
the course of development, the relative importance of the technical characteristics increases. Early in
drug development, commercial considerations such as the size of the market, the extent of competition in
the market, and the firm’s relevant commercialization capabilities, condition the selection threshold. As
2
the compound progresses, more and more information about its safety and efficacy becomes available, so
that outcomes become more deeply imbued by the technical (therapeutic) characteristics of the
compound, namely, how effective the compound is against a particular condition and its long term
side-effects. We simplify by assuming that both technical promise, Pg, and commercial considerations,
represented by Pg*, determine selection. However, once selected, the FDA approval takes place with
probability Pg. Since we do not observe Pg, the expected probability of FDA approval is the expected
value of Pg, conditional upon Pg being greater than Pg*.
Model: Let Y1 = 1 if the compound is selected for clinical trials, 0 otherwise. Therefore the probability of
selection is Pr(Y1 = 1) = Pr(Pg > Pg*). Let Y2 = 1 if the project succeeds if selected for trial, and 0 if it
fails in clinicals, so that Pr(Y2 = 1) = E(Pg | Pg > Pg*). To estimate the model, we assume that the log of
the odds ratio, ln(Pg/(1-Pg)), is normally distributed with mean µ and unit variance. Further, we assume
that µ depends linearly on a set of independent variables Z, i.e. µ = Zγ. The threshold Pg* is assumed to
be a function of a set of independent variables X. Since Pg* must be between 0 and 1, we assume Pg* =
exp(Xβ)/(1+exp(Xβ)) so that ln(Pg*/(1-Pg*)) = Xβ. We maximize the following log-likelihood function:
∑
∑
∑
∑
= = = = = = = = = + = = + = = + = = . , 1 2 1 1 , 1 2 10 1, 0
2 1 1 2 1 2 1
1 1 2
.) Y & 1 Y Pr( ) 1 Y & 1 Y Pr( ) 0 Y & 1 Y Pr( ) 0 Y Pr( ) , ( Y Y Y Y
Y Y Y
Lβ γ (1)
Where the four terms correspond to: not selected; selected but failed; selected and succeeded; and
selected and still in trial, respectively. Note that we have two binary dependent variables, and we are
estimating the drivers of Pg* and µ, rather than the more typical exercise of estimating the probability of
selection and the probability of success conditional on selection. The probability of selection is:
(
)
(
)
(
Xβ Zγ)
Pg Pg Pg Pg Pg Pg
Y = −Φ −
− > − = > = = 1 * 1 * ln 1 ln Pr * Pr 1
Pr 1 (2)
Whereas the probability of success is:
3
(
= =)
=[
>]
=∫
(
>)
= −Φ(
−)
∫
( )
1 * 1 * 1 2 1 1 * * 1 | 1 Pr Pg Pg dPg Pg f Pg Z X dPg Pg Pg Pg f Pg Pg Pg Pg E Y Y γ β (3)Danzon et al. (2005) effectively estimate Pr(Y2 =1 |Y1 =1). Although they acknowledge the selection
issue by including the share of projects selected from pre-clinicals in that indication as a regressor, they
cannot separately identify γ and β. Nerkar (2003) and Chandy et al. (2006) estimate Pr(Y1=1 & Y2 =1) ≡
Pr(Y2 =1 |Y1 =1)Pr(Y1=1). All else equal, as a firm becomes more selective (the second term decreases),
the compounds it advances into clinicals will be more likely to succeed (the first term increases), but the
product of the two, the share of compounds in pre-clinicals that eventually succeed, may either fall or rise.
Without modeling both Pr(Y2 =1 |Y1 =1) and Pr(Y1=1), and without explicitly recognizing the
interdependence between them, one cannot distinguish innovativeness (i.e., µ) across firms.
4. Hypothesis development
4.1 Hypotheses about selection
We define a firm to be more selective in a therapeutic area if Pg* is higher. There are many factors that
condition Pg*: Firm scale and scope, product cannibalization concerns, differences in organizational
capability and incentives of firms, and variation in market profitability across therapeutic areas.
We start with the classical scale and scope factors. We distinguish between scale at the level of
the research program and scale at the level of the firm. Program-level economies of scale reduce
development costs, and hence, lower Pg*. For example, a company with long-standing arrangements
with academic hospitals for trials in an indication will find it easier to develop another compound within
that indication than in others. In addition, spillovers are more extensive: the results for a given compound
can be informative for other compounds in the same indication. This implies a lower D and a higher V,
and a lower Pg*. Scale at the level of the firm has different implications. A firm engaged in more clinical
trials may face capacity constraints. Bringing an additional compound will imply higher incremental cost
of development (higher D), and thus the firm will enter new compounds in clinical trials only if they are
promising, i.e., Pg* will be higher. Finally, scope, i.e., a wider diversification of projects across research
as Henderson and Cockburn (1996) suggested. This will make the firm less selective. Formally, we state
the following hypothesis.
Hypothesis 1a. Research scale at the level of the program makes the firm less selective (lower Pg*) .
Hypothesis 1b. Research scale at the level of the firm makes it more selective (higher Pg*)
Hypothesis 1c. A wider scope across the firm’s research areas makes it less selective (lower Pg*).
A well known feature of the pharmaceutical industry is that it is populated by two fundamentally
different types of firms, the established pharmaceutical producers and the biotechnology companies. The
established drug firms were founded early in the 20th century, if not earlier. A large gap separates the
entry of the pharmaceutical firms and the first biotech company, Genentech, in 1976. Syntex, the
youngest research based US pharmaceutical company before Genentech, was founded in 1958. Waves of
biotech companies have entered after Genentech. Their main driver has been research, and the
comparative advantages and specialization of these firms are clearly upstream compared to the drug
manufacturers (Gambardella, 1995). Such differences in origin, time of entry and development underlie
profound differences between these two company types.
For example, Arrow’s (1962) suggests that the fear of cannibalizing the profits from existing
markets and products leads an incumbent firm to under-invest in research. In large established firms, new
compounds are more likely to cannibalize existing products. By contrast, most biotech firms have no
products on the market and have little to fear about cannibalization of existing products. Insofar as one
cannot fully control for this effect in the empirical analysis, the cannibalization effect is an important
reason to distinguish between different firm types. Difficult-to-measure differences in organizational
capabilities are another reason to distinguish between biotech and pharmaceutical firms. Interviews with
managers reveal that pharmaceutical firms have well established routines and financial models for
deciding how compounds are moved along through the various stages of pre-clinical research and clinical
strong biases that favor compounds being selected. The need to provide “good news” to investors may
also bias startups to push drugs into clinical trials (Guedj and Scharfstein, 2005).
In addition, there may be differences in risk aversion. Ordinarily, one might imagine that large
established firms would be less risk averse. However, as Stiglitz and Weiss (1981) showed in a seminal
paper, limited liability laws may make startups more risk loving, particularly in taking large risks that
might result in bankruptcy. The intuition is simple. A large risk (“swinging for the fences”) has high
reward but also a high cost in terms of bankruptcy. However, with few assets to protect, and with outside
equity investors frequently having a large share of the capital at risk if the project (and the firm) fails,
managers of small biotech firms may be inclined to swing for the fences, which implies that they would
have a lower Pg*. Indeed, using patent citation analysis, Owen-Smith and Powell (2006) find that biotech
firms in the Bay Area, which has a higher involvement of VC firms, are more likely to initiate riskier
projects, than biotech firms in the Boston region, where universities (and NIH funding) are more heavily
represented. Interviews with R&D executives support the idea that biotech firms tend to push compounds
into clinical development that firms with bigger product portfolios might hold back. When asked, the
managers also believe that biotech firms are more inclined to swing for the fences.
Among the biotech firms themselves, there are distinctions to be made. Some of the early
founded biotech firms that survive today, such as Genentech and Amgen, have become similar to the
established drug companies. They have products in the market and they have to manage cannibalization.
They have strong financial models for selecting projects, and also considerable wealth at risk from an
expensive failure. This suggests that the Pg* of the older biotech firms lies somewhere between that of
established pharmaceutical firms and that of the smaller, more recent biotech entrants. We can then
formulate the following hypothesis.
4 Clearly, selection effects are at work here as well. The biotech firms that entered early and have survived are more
Hypothesis 2. Even after controlling for the scale and scope of research, established pharmaceutical
companies are more selective (higher Pg*) than the biotech firms. The older and more established
biotech firms are more selective than the younger biotech firms.
4.2 Hypotheses about performance
Below we use the expression “higher innovation performance” to mean a better distribution of the
probability of success for compounds discovered in preclinical research, i.e., a higher µ.
Henderson and Cockburn (1996) identify three types of economies in research: i) economies of
scale at the level of the research program; ii) economies of scale at the level of the firm; iii) economies of
scope across research programs of the firm (see also Macher and Boerner 2006; Nerkar and Roberts
2004). There are a variety of sources of scale and scope economies. A larger firm with a diverse research
portfolio may have a larger chemical library (Thomke and Kuemmerle 2002); it may be more
knowledgeable about the underlying biochemical processes; it may have better models for interpreting
results from animal and small sample human studies; or it may be better able to modify the original
compound to improve its efficacy and reduce its side effects.
These benefits may be offset by organizations that are maladapted, with perverse incentives and
inadequate feedbacks (e.g., Nerkar, 2003). There is, however, another reason why measures of program
level economies may appear to result in lower µ. A firm with a number of compounds in trial for the same
indication is unlikely to commercialize all of them, even if they could all get FDA approval. Instead, it
will pick the most promising amongst them. Though our formal model assumes that once selected,
compounds progress through clinical trials based entirely on technical merits, this is a simplification. In
reality, firms may choose to bring a number of promising compounds into trial for an indication, but pick
only the best, terminating the rest (Dahan and Mendelson, 2001). The cannibalization effect may work
similarly. A firm with a product may choose not to commercialize a drug that is safe and effective but
very similar in its target market to the existing product. Put differently, the portfolio and cannibalization
Hypothesis 3. The innovation performance of a firm in a given research area increases with a) the
overall research scale of the firm; b) the span of the research across research areas (scope); c) research
scale at the level of the program. The portfolio and cannibalization effects reduce the measured
innovation performance.
As with selection, there are other differences between established firms and biotech companies
that may affect performance. There is a substantial literature arguing that smaller research-intensive
companies are more creative than established firms. For example, smaller firms are said to have a more
open environments, enhancing benefits from external knowledge (e.g., Chesbrough, 2003) and are less
prone to asymmetric information between managers and inventors inside the organization, (Arrow, 1983;
Holmstrom, 1989). Conversely, internal bureaucracies inside large firms may crush good ideas. Also,
larger firms may tend to “rest on one’s laurels” (Christensen 1997), and they may stress exploitation
rather than exploration (Levinthal and March 1993).
However, an alternative hypothesis has the opposite prediction. The agency model in Guedj and
Scharfstein (2005), and the idea that small biotech firms may have excessive incentives for risk bearing
imply that biotech firms would advance even inferior compounds into clinicals. In terms of our model,
this implies a lower estimated µ for biotech firms. Ultimately, the net effect of these two forces is an
empirical matter. We then formulate two alternative hypotheses.
Hypothesis 4: Biotech companies have higher innovation performance than the established
pharmaceutical firm because smaller organizations are more innovative.
Hypothesis 4’: Biotech firms have lower innovation performance because of misaligned incentives.
4.3 Licensing related hypotheses
If the licensing agreement does not share costs and benefits in the same proportion across the licensee and
licensor, this will bias the selection threshold. In the extreme case, if the licensee is responsible for the
cost of development but has to pay a royalty from sales of a successful compound to the licensor, this
incentives by sharing costs and benefits. We do not observe details of the licensing contracts and
accordingly we do not formulate a hypothesis regarding the effect of licensing on Pg*.
Regarding the performance of licensed compounds, following Akerlof (1970), the economics
literature predicts that markets for knowledge are characterized by information asymmetries about the
quality of the technology offered for license (Zeckhauser, 1996). Although these arguments are typically
used support the contention that licensing is not the preferred mode of commercialization, they can be
extended to performance, as Pisano (1997) does in the pharmaceutical industry context. The notion is that
a licensor is likely to keep its most promising technologies for its own use and only offer inferior ones for
license. Licensees therefore believe that compounds offered for licensing are on average worse than
compounds not offered for license, conditional on observable characteristics. If so, the licensees must be
offered a discount. But then the suppliers of good compounds are less likely to offer their compounds for
license, thereby fulfilling the belief about compounds offered for license being inferior. If so, licensed
compounds will be drawn from an inferior distributions (lower µ) than those retained for in-house
development. Guedj (2005) also offers an asymmetric-information based model which implies that
licensed compounds have lower Pg* but also lower probability of success. He finds empirical support in a
sample of projects selected for clinicals.
There are however some countervailing arguments suggesting that the market for lemon is not an
important problem in technology markets. Arora and Gambardella (1994), building on the insights of
Cohen and Levinthal (1989) and Rosenberg (1990), argue that research capabilities also provide firms
with the ability to evaluate external technologies. Licensees in the drug industry are typically firms that
perform research themselves, so that potential buyers are capable of evaluating the technical
characteristics of the licensed compound, especially since strong patent protection in this industry
facilitates the disclosure of the relevant information. Furthermore, many licensing transactions are
embedded in strategic research partnerships, involve minority investments or co-development deals,
that the innovation performance of the licensed compounds is not different from those developed
internally.
Hypothesis 5 (market for lemons). Licensed compounds exhibit lower innovation performance than
internally developed compounds.
5. Description of the data
Our sample is drawn from the ATA database (ATAdb), which combines proprietary datasets on the
pharmaceutical industry. It reports information about more than 17,000 R&D projects all over the world
carried over since the 1980s.5 Following Danzon et al. (2005), we consider each indication for which the
compound is being developed as a separate project. Also, countries have different institutions and
procedures for advancing compounds to the clinical trials, and for approving them for sales. Even in our
database both the selection and success rates of European trials are higher than the US, which suggests
that the US criteria are more stringent. To reduce this source of heterogeneity we focus on US trials.
Since our database indicates where the preclinical research is conducted, our sample is composed of all
the projects with preclinical research in the US (whether by US firms or not). We classify as “selected”
those projects that start clinical I in the US, and analogously for successful projects. We exclude projects
originated by hospitals, public sector labs or universities, where selection processes may be different. We
reduce the censoring problem posed by the ongoing projects that are neither successes nor failures by
including only the projects that enter the preclinical trials between 1980 and 1994.7 Our final sample is
composed of 3,311 projects.8
5
The names of the firms in the database are reported as they are in 2002. Therefore we cannot consider separately the projects of the major pharmaceutical firms that merged or were acquired during the 1990s.
6
There are a few cases with missing information about the location of preclinical research, which we dealt with case by case, by using other contextual information in the database.
7
Following Danzon et al. (2005), we classify as failure a project that remains in a phase, without any further reported events, for longer than the maximum number of years observed for completion of each phase in the non-censored sample. The maximum number of years is computed within each indication. When this is not practicable – due to missing observation for the indication – we consider the maximum over all the indications.
8
By selecting trials started between 1980 and 1994, the sample reduces to 8,107 observations, of which 7,247 started by pharmaceutical and biotechnology firms. We further exclude the projects co-developed by two or more
We divide biotech firms into two types, depending upon whether they were founded before or
after 1988, the median founding year for the biotech firms in our sample. We also distinguish between
the top pharmaceutical corporations worldwide (henceforth “Established Pharma”), and smaller
pharmaceutical firms developing compounds that target predominantly infection and inflammation,
asthma and diabetes, obesity and sexual dysfunctions (henceforth “Other Pharma”), which are typically
much less R&D intensive. Specifically, we distinguish among the following four types of companies:
i) Pioneer Biotech. Firms, founded before 1988, that apply biotechnological methods to the discovery
and development of new drugs.
ii) Other Biotech. All other firms using biotechnology for the discovery of new drugs.
iii) Established Pharma. Pharmaceutical firms that are among the top 50 firms worldwide by sales for at
least 10 years during the 15 year period 1983-1998 (excluding biotech firms and adjusting for
mergers and missing data for 1995).
[image:18.595.59.533.439.522.2]iv) Other Pharma. All other pharmaceutical firms.
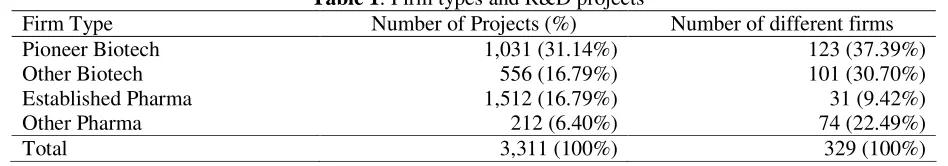
Table 1: Firm types and R&D projects
Firm Type Number of Projects (%) Number of different firms
Pioneer Biotech 1,031 (31.14%) 123 (37.39%)
Other Biotech 556 (16.79%) 101 (30.70%)
Established Pharma 1,512 (16.79%) 31 (9.42%)
Other Pharma 212 (6.40%) 74 (22.49%)
Total 3,311 (100%) 329 (100%)
Table 1 reports information on the number and projects related to the four types of firms that we
considered in the analysis. Our empirical measures are summarized in Table 2. Measures that vary across
firms and indication are noted as measured at the project level, while others vary only across firms, or
only across indications. Table 2 also indicates the predicted sign of the variable. Some variables are
excluded from µ (and the corresponding cell is left blank), while other variables are used as controls (and
the corresponding cell merely has a mark, rather than a + or a − mark).
Scale and Scope. We measure scale_program, or the scale at the program level by the total number of
measured by the total number of ongoing projects for the firm. Scope is measured by Herfindahl index of
diversification of projects across indications, for the firm. These measures are based on the literature.
Danzon et al. (2005) and Abrantes-Metz (2003) use the number of drugs in development to measure
overall firm scale. To measure program level economies, Macher and Berner (2006) use the number of
projects completed and Danzon et al. (2005) use the total number of projects in the therapeutic area.
Finally, Danzon et al. (2005) use the same herfindal index based measure that we use, and Macher and
Boerner (2006) use the number of therapeutic areas in which the firm is active to measure scope
economies. Henderson and Cockburn (1996) use the concentration of R&D expenditures, which we
cannot do because we lack R&D data at the program level.
Licensed Compounds: The database records the licensor and each licensee.9 We considered a project as
“licensed” only if the agreement was signed in pre-clinicals.
Project Controls. We develop a number of binary, indication level indicators10: (i) whether the disease is
lethal or not (lethal), (ii) whether it can result in organ damage or complications (organ damage), (iii)
whether the disease is chronic or acute (chronic),(iv) whether the disease has multiple causes or not
(multiple causes) 11, and(v) if the disease targeted is rare or not (rare).12 These factors condition both the
selection threshold, Pg*, and, µ, the average probability of success.
We also use an indicator for whether the firm already has a product in the ATC2 market. Our
measure of scale at the level of the program is the cumulative number of past projects for that indication.
9
When multiple licensees are present, we assign the development of the project to the largest US firm. We then inspected this assignment to make sure that we consider the firm that was actually in charge of the R&D development of the project.
10
Indication and ATC are two complementary classification systems. For instance, A02 is the ATC2 code for drugs for acid related disorders, where the corresponding indication may be “heartburn As this suggests, ATC deals with the therapy, using the anatomy as the main organizing theme. Indications focus on the clinical symptoms for which the drug is being tested. The main source for the disease information is Braunwald et al. (2001). Other information comes from e-medicine reviews from the disease database (http://www.diseasedatabase.com). For diffusion data, we obtain information from the “rare disease database” cited by the FDA, and available at
http://rarediseases.about.com/cs/orphandrugs/a/122103.htm.
11
Multiple causes = 1 if the etiology is multifactorial and = 0 if it is unknown or single factor.
12
Since we want Scale_Program to account for research scale and experience in the program we need to
control for for the scale or experience of the firm associated with the commercialization of products in the
[image:20.595.58.554.211.407.2]same area, viz. downstream factors rather than research.
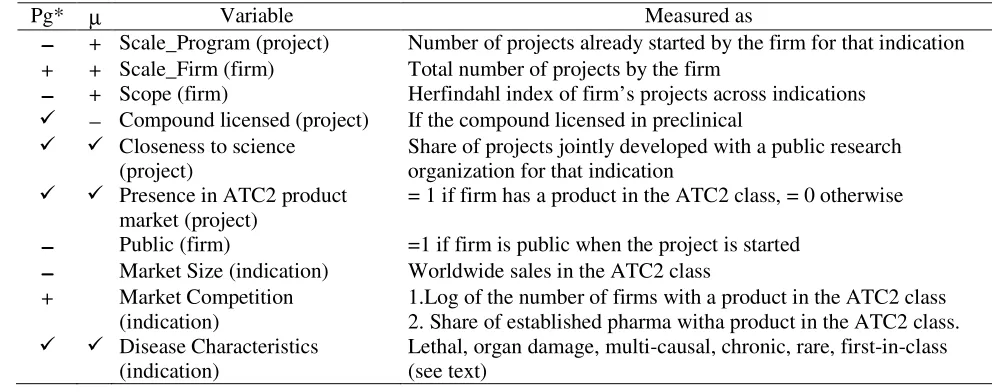
Table 2: Variables in the estimated equations
Pg* µ Variable Measured as
−−−− + Scale_Program (project) Number of projects already started by the firm for that indication + + Scale_Firm (firm) Total number of projects by the firm
−−−− + Scope (firm) Herfindahl index of firm’s projects across indications
− Compound licensed (project) If the compound licensed in preclinical Closeness to science
(project)
Share of projects jointly developed with a public research organization for that indication
Presence in ATC2 product market (project)
= 1 if firm has a product in the ATC2 class, = 0 otherwise
−−−− Public (firm) =1 if firm is public when the project is started
−−−− Market Size (indication) Worldwide sales in the ATC2 class + Market Competition
(indication)
1.Log of the number of firms with a product in the ATC2 class 2. Share of established pharma witha product in the ATC2 class. Disease Characteristics
(indication)
Lethal, organ damage, multi-causal, chronic, rare, first-in-class (see text)
Finally, since pharmaceutical and biotech firms may choose projects with different levels of
innovativeness or risk, we devise a proxy for the level of innovativeness (and therefore of risk) associated
to the project. We use the information whether the compound is first-in-class or a follower molecule (first
in class).14 Other things being equal, we expect first-in-class compounds to exhibit a lower selection
threshold. This is because there are fewer alternatives available, and hence they have to overcome a
lower hurdle to improve upon existing remedies. We also expect them to be drawn from a worse
distribution because there is less information about potential side effects. Unfortunately, in almost 40%
of the cases it is not possible to classify the molecule under study because of the lack of information about
its chemical characteristics. We create an indicator variable, First-in-class unknown, that codes for when
this information is missing. Through the use of these fine grained controls at the level of indication, we
13 We also employ the total number of molecules in the same ATC2 with no change in result. We prefer a dummy
can avoid using indication fixed effects, which can bias non-linear estimates, a possibility confirmed by
(unreported) Monte Carlo simulations.
Economic characteristics of therapeutic area: We use information on the worldwide sales (at the
Anatomic Therapeutic Classification at the 2nd digit level, ATC2) in the year the project is started, as a
proxy for V. We measure the degree of competition by the number of firms operating in that indication
(world wide) at the time the project is launched. We also employ the share of established pharmaceutical
firms as an additional control for the intensity of competition. We use the share of projects developed
with universities, as a measure of the firm’s links with research institutes, and its closeness to science
[image:21.595.69.532.358.547.2](closeness to science).
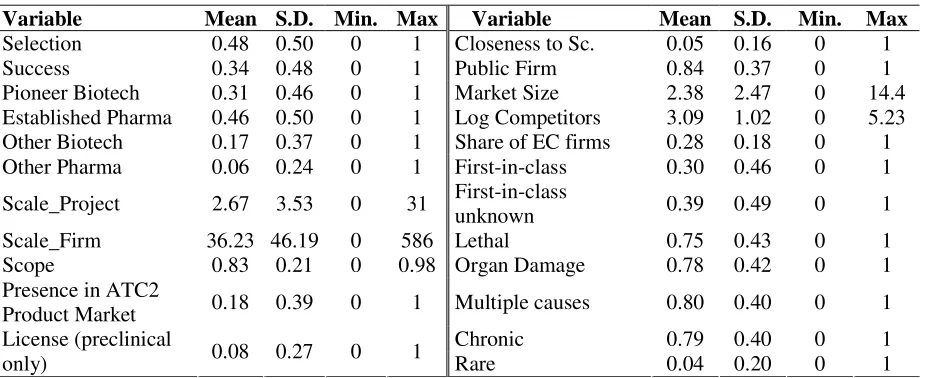
Table 3: Descriptive Statistics
Variable Mean S.D. Min. Max Variable Mean S.D. Min. Max
Selection 0.48 0.50 0 1 Closeness to Sc. 0.05 0.16 0 1
Success 0.34 0.48 0 1 Public Firm 0.84 0.37 0 1
Pioneer Biotech 0.31 0.46 0 1 Market Size 2.38 2.47 0 14.4 Established Pharma 0.46 0.50 0 1 Log Competitors 3.09 1.02 0 5.23 Other Biotech 0.17 0.37 0 1 Share of EC firms 0.28 0.18 0 1 Other Pharma 0.06 0.24 0 1 First-in-class 0.30 0.46 0 1
Scale_Project 2.67 3.53 0 31 First-in-class
unknown 0.39 0.49 0 1
Scale_Firm 36.23 46.19 0 586 Lethal 0.75 0.43 0 1
Scope 0.83 0.21 0 0.98 Organ Damage 0.78 0.42 0 1
Presence in ATC2
Product Market 0.18 0.39 0 1 Multiple causes 0.80 0.40 0 1
Chronic 0.79 0.40 0 1
License (preclinical
only) 0.08 0.27 0 1 Rare 0.04 0.20 0 1
Specification and identification of Pg* and µ. The system of equations we estimate is non-linear. We
also impose three exclusion restrictions: We assume that the economic characteristics of the compound,
i.e., the size of the market, the level of competition in the market, and whether the firm is private or
public, only affect the selection threshold and not distribution of the probability of success. This is how
we identify selection (Pg*) as opposed to performance (µ). Second, recall that we normalize the variance
14
of ln(Pg/(1-Pg)) to unity. We do allow for inter-dependence across the observations for a firm by reported
standard errors that are clustered at the firm level. Table 3 presents the descriptive statistics.
6. Empirical results
Table 4 presents simple probit estimates of the selection and success equations estimated separately.
Compared to established pharmaceutical firms, biotech firms are less likely to take compounds into
clinical trials (they have a lower probability of selection) and have a lower probability of success, though
the difference is not statistically significant. Firm scale increases the probability of success (though it
leaves selection probability unchanged), whereas program scale decreases both selection and success
probability, and scope reduces selection and success. Projects for more profitable markets (larger size
and lower competition) have higher probability of selection and success. The presence of downstream
assets (a product already in the market) makes selection more likely but reduces success.
It is tempting to try to interpret these results in terms of the various theories about differences
across firms or firm scale and scope. However, as we discussed in developing our model, the probability
of success will also depend upon the selection threshold, and vice versa. For instance, is scope associated
with higher success because it is associated with lower selection probability? If so, should not program
scale (associated with lower success probability) have been associated with greater selection probability?
This is difficult to reconcile with a simple selection model a lá Heckman, in which the same underlying
process drives both selection and success.
In other words, we need to estimate the structural parameters. Table 5 reports the results obtained
from estimating the model described in Section 3, using STATA. Note that while table 4 reports the
drivers of the probability of selection and success, table 5 reports the drivers of the selection threshold and
the innovative performance. For instance, the coefficients reported under probability of selection in table
4 are β - γ, whereas table 5 reports β. We estimate two specifications. In one, we only use the firm type
15
dummies (Established Pharma is the reference group) and disease controls, while in the second we also
include measures of scale and scope and firm and market controls.
Model 1 Model 2
Pr Selection Pr Success Pr Selection Pr Success Pioneer Biotech -0.31** (0.11) -0.22 (0.15) -0.37** (0.12) -0.08 (0.17) Other Biotech -0.47** (0.13) -0.79** (0.36) -0.54** (0.16) -0.63 (0.41) Other Pharma -0.18 (0.17) 0.53** (0.20) -0.33 (0.21) 0.78** (0.26) License (precl) 0.03 (0.15) 0.14 (0.28) -0.06 (0.14) -0.02 (0.27)
Scale_Program -0.09** (0.02) -0.14** (0.03)
Scale_Firm -.1E-4 (.1E-2) 0.01** (.2E-2)
Scope -0.47** (0.19) 0.54* (0.32)
Closeness to science 0.59** (0.25) .4E-2 (0.23)
Presence in ATC2 class 0.29** (0.12) -0.3** (0.12)
Public 0.17 (0.11) 0.04 (0.20)
# Competitors (log) -0.14** (0.04) -0.15** (0.07)
% established pharma competitors 0.36 (0.22) 0.18 (0.24)
Market Size 0.02 (0.02) 0.1** (0.02)
Lethal 0.07 (0.09) -0.13 (0.14) -0.02 (0.09) -0.21 (0.15) Organ Damage -0.17** (0.08) 0.13 (0.09) -0.15* (0.08) 0.09 (0.11) Multiple causes -0.12 (0.08) -0.20* (0.11) -0.02 (0.08) -0.13 (0.11) Chronic 0.02 (0.07) -0.13 (0.15) .3E-2 (0.07) -0.04 (0.15) Rare -0.12 (0.15) 0.73** (0.2) -0.11 (0.14) 0.58** (0.17) First in class -0.36** (0.10) -0.20 (0.15) -0.35** (0.09) -0.17 (0.15) First in class unknown -1.47** (0.09) -1.54** (0.24) -1.39** (0.09) -1.59** (0.20) Constant 0.97** (0.14) 0.09 (0.21) 1.69** (0.24) -0.24 (0.42)
Obs. 3,311 1,088 3,311 1,088
Log-likelihood -1849.98 -616.08 -1752.67 -578.12
Robust standard errors in parenthesis (clustered by firms). ** denotes p < 5%; * p < 10%.
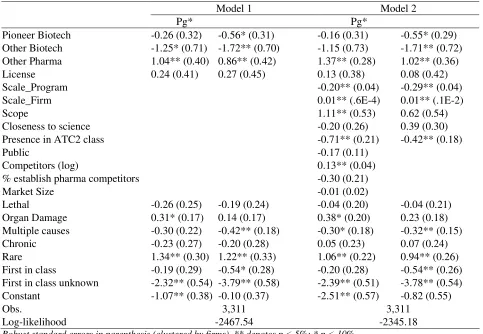
Results about selection. We find that research scale at the program level reduces the selection threshold
whereas research scale at the level of the firm as a whole increases the selection threshold, consistently
with Hypotheses 1a and 1b. Contrary to previous findings (and to hypothesis 1c), we find that scope
makes firms more selective. Other Biotech and Other Pharma exhibit, respectively, a lower and a higher
threshold than the Established Pharma. The high selection threshold of Other Pharma, relative to
Established Pharma, suggests that the former have higher development costs than the latter, perhaps
because Other Pharma lack substantial production and marketing assets. By contrast, there is little
biotech firms have grown similar to the established firms. However, the coefficient of the Other Biotech
dummy is sizable (ranging from -1.25 to -1.15); even after controlling for differences in scale, scope and
downstream assets. Younger biotech firms have lower selection thresholds, consistent with theories about
greater risk appetites, potential agency problems, and weaker management models. This corroborates
[image:24.595.68.551.253.587.2]Hypothesis 2.
Table 5: Structural Model, Maximum Likelihood Estimates
Model 1 Model 2
Pg* Pg*
Pioneer Biotech -0.26 (0.32) -0.56* (0.31) -0.16 (0.31) -0.55* (0.29) Other Biotech -1.25* (0.71) -1.72** (0.70) -1.15 (0.73) -1.71** (0.72) Other Pharma 1.04** (0.40) 0.86** (0.42) 1.37** (0.28) 1.02** (0.36) License 0.24 (0.41) 0.27 (0.45) 0.13 (0.38) 0.08 (0.42)
Scale_Program -0.20** (0.04) -0.29** (0.04)
Scale_Firm 0.01** (.6E-4) 0.01** (.1E-2)
Scope 1.11** (0.53) 0.62 (0.54)
Closeness to science -0.20 (0.26) 0.39 (0.30)
Presence in ATC2 class -0.71** (0.21) -0.42** (0.18)
Public -0.17 (0.11)
Competitors (log) 0.13** (0.04)
% establish pharma competitors -0.30 (0.21)
Market Size -0.01 (0.02)
Lethal -0.26 (0.25) -0.19 (0.24) -0.04 (0.20) -0.04 (0.21) Organ Damage 0.31* (0.17) 0.14 (0.17) 0.38* (0.20) 0.23 (0.18) Multiple causes -0.30 (0.22) -0.42** (0.18) -0.30* (0.18) -0.32** (0.15) Chronic -0.23 (0.27) -0.20 (0.28) 0.05 (0.23) 0.07 (0.24) Rare 1.34** (0.30) 1.22** (0.33) 1.06** (0.22) 0.94** (0.26) First in class -0.19 (0.29) -0.54* (0.28) -0.20 (0.28) -0.54** (0.26) First in class unknown -2.32** (0.54) -3.79** (0.58) -2.39** (0.51) -3.78** (0.54) Constant -1.07** (0.38) -0.10 (0.37) -2.51** (0.57) -0.82 (0.55)
Obs. 3,311 3,311
Log-likelihood -2467.54 -2345.18
Robust standard errors in parenthesis (clustered by firms). ** denotes p < 5%; * p < 10%.
As far as our controls are concerned, the number of competitors, as a measure of the profitability
of the market, has the expected effects (increase Pg*). Similarly, previous commercial experience in the
ATC2 class reduces Pg*, which suggests higher economic value from successful compounds because of
Results about performance: Table 5 shows that scale at the program level reduces µ but overall
research scale at the firm level increases this probability. The effect of scope is positive, but imprecisely
measured. Thus, Hypothesis 3 is only partially supported. If we believe that program (indication) level
research economies are in fact significant and positive, then our measure is confounding economies of
scale with the portfolio effect. Consistently, we find that if a firm has a product in the market, µ is lower,
which is surprising if one believes that past experience should improve innovative performance. The
alternative explanation appeals to the portfolio effect. To ensure that its downstream assets are fully
utilized, a firm with downstream assets in a market will often have more compounds in clinical trials for
the same indication (e.g. Higgins and Rodriguez, 2006; Dahan and Mendelson, 2001). However, it will
commercialize at most one of the compounds, even if more could gain FDA approval. The higher failure
when there are more projects under development for the same indication may simply reflect such
portfolio effects.
The important results of Table 5 are that both Pioneer Biotech and Other Biotech have lower µ,
implying that they have lower innovative performance compared to Established Pharma, and that Pioneer
Biotechs perform better than Other Biotech, even after controlling for scale, scope and downstream
assets. Formally, Hypothesis 4 is rejected in favor of the alternative Hypothesis 4’. There are three
interpretations, which are not mutually exclusive. The first one is that biotech firms are in fact less
innovative than established pharmaceutical firms. The second one is that biotech firms advance into
clinical trials less promising compounds, because their managers have perverse incentives, or because
they are incapable of correctly evaluating the potential of the compound, or because they are willing to
take more risk (which may be related to their incentives, as discussed earlier). The third interpretation is
that the regulatory hurdles for the average biotechnology product are more difficult to meet than those for
the average pharmaceutical product, and our controls do not adequately control for these differences.
Our final set of results is about the licensed compounds. Recall that the lemons hypothesis is
own use. In our framework, this implies that licensed compounds have a lower µ than compounds
developed in-house by the licensor. Table 5 shows that we do not observe any market for lemons.
Licensed compounds face a higher selection threshold, Pg*, as might be expected if the licensee has to
share revenues (but not costs) with the licensor. However, they also have a higher µ, although neither
coefficient is statistically significant. Thus, Hypothesis 5 is rejected. The countervailing effects discussed
in Section 3 appear to be strong enough to avoid any lemons problem. One implication of these results is
that the division of innovative labor (Arora et al., 2001) in the pharmaceutical industry must rely upon
differences in comparative (rather than absolute) advantage across biotech firms and pharmaceutical
firms. Alternatively, the advantage of biotech firms may lie in researching unexplored avenues, rather
than doing better what pharmaceutical firms already do.
7. Discussion and Conclusions
A key takeaway from our analysis is that in comparing the innovation performance of firms, one must pay
careful attention to differences in behavior, and to factors, such as incentives, that may drive such
differences. We explicitly model one aspect of behavior, namely the decision to select a compound into
clinical trials. However, there are other aspects of our results which illustrate the same point, such as our
finding of no program-level economies of scale, or that a firm which has past experience in the market
(and by inference, has downstream assets), is less successful. These apparently anomalous findings can be
reconciled by considering the incentives of firms to ensure the full utilization of downstream assets by
selecting a number of compounds into clinical trials, at most one of which is marketed, thereby reducing
estimated innovative performance. The problem lies with the measure of program level economies of
scale (commonly used in the literature), which confounds the economies of scale with the portfolio effect.
Our results imply that even after controlling for scale and scope of the firm, there are significant
differences across different types of firms. These differences reflect both performance and behavior, most
notably, selection. The different results in Tables 4 and 5 in the previous section suggest that explicitly
Specification 2 in the two tables. In Table 4 the dummies for Pioneer Biotech and Other Biotech are
negative and significant in the selection equation, but in the success equation the estimates are
insignificant. Table 5 shows that they have significantly lower µ but also lower Pg*. Thus, we conclude
that the reason biotech firms are less likely to advance compounds into clinical is because on average
they have lower quality compounds compared to average pharmaceutical firms, not because biotech firms
are more selective.
Robustness checks: We conduct a series of tests to explore the robustness of our results to changes in the
sample, alternative measures of market profitability, and alternative assumptions about the distribution of
Pg. For brevity, we summarize our results. Details are available from the authors upon request. First, our
results are largely unchanged if we expand our sample to include projects initiated in Europe, or by
universities and other public research organizations. Similarly, defining an established pharmaceutical
firm to be one that appears on the list of the top 50 pharmaceutical firms by sales for three, five or ten
years does not materially change our results. Second, although the non-linear specification of our
likelihood function contributes to identification, our results do not depend upon it. We also estimate a
specification where the log-odds ratio of Pg is uniformly distributed over some subset of the unit interval,
with little qualitative change in our results. Finally, our results are robust to some alternative empirical
measures. For instance, using the herfindal index of the market shares in an indication (for the year 2001)
to measure competition in the market leads to similar results. Similarly, using sales at the ATC3 level in
an indication (albeit for a single year, 2001) to measure market size does not affect our findings.
Exploring the implications of our results. Since we estimate structural parameters, we can use them for
“what-if” scenarios to provide additional insights into the implications of our estimates. We begin by
16
To validate our estimation results we also compared our estimated Pg*, which corresponds to the ratio of development costs and expected revenues, with estimates of costs and revenues provided by the existing literature (DiMasi et al., 2003; OTA, 1993; and Grabowski et al., 2002). The estimates of Pg* obtained from these
using the estimated coefficients from specification 2 in Table 5 to compute the probability of selection,
[image:28.595.67.530.166.247.2]the unconditional probability of success, the value of Pg* and µ for the firm types in our sample.
Table 6: Estimated selection and success probabilities, Pg*, µ, by originator type
Pr. Selection Pr. Success Pg* µ
Overall 0.48 0.25 0.12 -2.87
Pioneer Biotech 0.44 0.19 0.11 -2.97
Established Pharma 0.57 0.27 0.13 -2.35
Other Biotech 0.30 0.07 0.03 -4.79
Other Pharma 0.55 0.43 0.31 -1.04
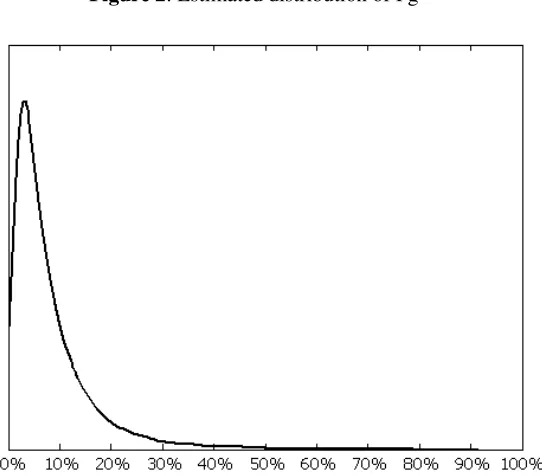
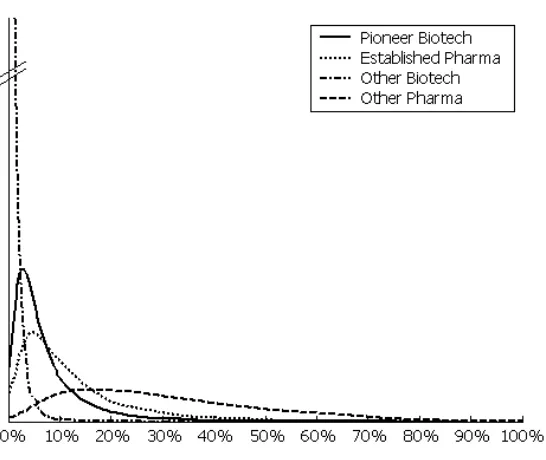
Figures 2 and 3 show the simulated the distributions of Pg for the whole sample and by originator types,
using our estimates from specification 2 in Table 5. The distribution of Pg is skewed, with a low number
of highly successful projects and a high number of projects with low probability of success. In general,
the right tails of the four distributions become fatter as we move from the Other Biotech to Pioneer
Biotech, Established Pharma, and Other Pharma. Using the estimated coefficients of specification 2 in
[image:28.595.171.442.426.664.2]Table 5 we also perform some simulation exercises. We first study the effects of changes in firm size.
Figure 3: Estimated distribution of Pg, by Originator type
Table 7: Simulating an increase in the research scale of the firm (Scale_Firm)
Pioneer Biotech Established Pharma Other Biotech Other Pharma Baseline +1 σ Baseline +1 σ Baseline +1 σ Baseline +1 σ Pr Selection 0.44 0.44 0.57 0.57 0.30 0.30 0.55 0.55
Pr Success 0.15 0.15 0.22 0.23 0.04 0.04 0.38 0.39
Pg* 0.11 0.11 0.13 0.13 0.03 0.03 0.31 0.31
µ -2.97 -2.95 -2.35 -2.33 -4.79 -4.77 -1.04 -1.01
Table 7 reports the estimated effects of a one-standard-deviation increase in Scale_Firm. When
this variable increases Pg* increases. Since µ also increases, the probability of selection increases too.
Interestingly, the effects of the firm research scale are rather small. Thus, while Scale_Firm is
statistically significant in both the selection and performance equations in Table 5, ultimately its overall
effect is small relative to the impact of firm type. As discussed, we believe these firm types reflect
different organization structures and strategic behavior. Our empirical results suggest that these
differences are important for understanding differences in innovation performance.
Limitations and future research: Our results are from the pharmaceutical sector. This sector is
transformed, with a much greater role for genetics and molecular biology. These transformations have
opened up opportunity for entry. Thus, it is a good test bed for exploring differences in innovation
capability between incumbents and entrants. Even so, we focus only on one part of the innovation
process, drug development, and arguably the part most favourable to incumbents. A fuller analysis,
which also incorporates the more upstream research and discovery process, is left for further research.
Another avenue for additional research has to do with differences in risk aversion. We discussed
the impact of risk aversion on the selection process. However, such differences may also be a source of
unobserved heterogeneity in conditioning other outcomes. We assume that market size, measures of
competition, the presence of downstream assets, whether the molecule is first-in-class or not, as well as
the other disease characteristics such as lethality, chronicity, and multiplicity of causes, together control
for differences in the potential net revenues. However, it is possible that incumbents show superior
performance by trying to hit singles while entrants are swinging for the fences. In economic terms,
entrants are willing to take bets with smaller probabilities of success but much higher rewards if
successful. By contrast, incumbents have more financial reserves, which also makes them more cautious
in terms of how much they are willing to bet on any particular project. From a societal perspective, this is
an efficient division of labor. Society enjoys the benefits of experimentation by entrants without unduly
risking the valuable capabilities in research, development and marketing of the established incumbents.
Though plausible and consistent with our results, this story is inconsistent with the conventional wisdom,
which holds that even the incumbents pharmaceutical firms are focusing on blockbusters. We leave this
issue for further research.
Our results on licensed compounds point to the benefits of the division of labor between entrants
and incumbents. From an econometric viewpoint, we treat licensing as exogenous, because estimating a
separate licensing equation (to account for potential endogeneity) will require much more detail about
potential licensors and licensees than we currently have. The available evidence suggests that projects
that are out-licensed and those that are retained in-house appear to be drawn from very similar
Another extension would be to allow for interactions across projects carried out by a single firm.
In developing our hypotheses we discussed some such interactions, most notably the portfolio effect,
discussed earlier. A firm with multiple projects for the same indication will likely commercialize the
most promising and abandon others, even perhaps some that could have successfully passed clinical trials.
In our estimation, we cluster the errors at the level of the firm, but are unable to cluster at the firm cum
indication level. As a result, such interactions may be captured through our measures of scale and scope,
leading to potentially confounding results. Future research may explicitly model how a firm chooses
among the portfolio of compounds in clinical trials for a particular indication, and how this choice varies
with whether it has relevant downstream assets, and with potential for product cannibalization.
Despite these limitations, our paper makes two important contributions. It provides a simple
model wherein firms choose which compounds to advance into clinical trials, taking into account the
technical promise of the compound, but also economic and commercial considerations. The model also
specifies how the observed innovation performance is conditioned by this choice. Our second
contribution is to analyze the factors that drive this choice, and in particular, how differences in the
underlying innovativeness between established firms and entrants and the differences across them in the