R E S E A R C H
Open Access
Global loss of DNA methylation uncovers intronic
enhancers in genes showing expression changes
Adam Blattler
1,2, Lijing Yao
1, Heather Witt
1, Yu Guo
1, Charles M Nicolet
1, Benjamin P Berman
1and Peggy J Farnham
1,3*Abstract
Background:Gene expression is epigenetically regulated by a combination of histone modifications and methylation of CpG dinucleotides in promoters. In normal cells, CpG-rich promoters are typically unmethylated, marked with histone modifications such as H3K4me3, and are highly active. During neoplastic transformation, CpG dinucleotides of CG-rich promoters become aberrantly methylated, corresponding with the removal of active histone modifications and transcriptional silencing. Outside of promoter regions, distal enhancers play a major role in the cell type-specific regulation of gene expression. Enhancers, which function by bringing activating complexes to promoters through chromosomal looping, are also modulated by a combination of DNA methylation and histone modifications.
Results: Here we use HCT116 colorectal cancer cells with and without mutations in DNA methyltransferases, the latter of which results in a 95% reduction in global DNA methylation levels. These cells are used to study the relationship between DNA methylation, histone modifications, and gene expression. We find that the loss of DNA methylation is not sufficient to reactivate most of the silenced promoters. In contrast, the removal of DNA methylation results in the activation of a large number of enhancer regions as determined by the acquisition of active histone marks.
Conclusions: Although the transcriptome is largely unaffected by the loss of DNA methylation, we identify two distinct mechanisms resulting in the upregulation of distinct sets of genes. One is a direct result of DNA methylation loss at a set of promoter regions and the other is due to the presence of new intragenic enhancers.
Background
Genes are regulated by epigenetic modifications and transcription factor binding at their promoters and at distally located regulatory regions. Studies over the past two decades have shown that promoters having high levels of DNA methylation are not transcriptionally active [1-3]. Recent genome-wide epigenetic profiling efforts demonstrate that promoter regions with high levels of DNA methylation have low levels of active marks such as H3K4me3 and that methylated distal regulatory regions lack the active mark H3K27ac [4-8]. During neoplastic transformation, DNA methylation is reduced
genome-wide, but accumulates at certain promoters. Because some of the promoters that become highly methylated are tumor suppressor genes [9-11], DNA de-methylating agents are being used in the clinic to reactivate silenced promoters. However, it has yet to be determined whether the global eradication of DNA methylation is advanta-geous for the cell or the patient. One could imagine that global loss of DNA methylation would have major effects on the transcriptome and epigenome of the cell. The DNA de-methylating drug 5-azacytidine (5-Aza-CR) has been approved for use as an epigenetic chemotherapeutic agent [12,13]. 5-Aza-CR functions by incorporating into DNA in place of cytosine and trapping DNA methyltrans-ferases (DNMTs), which leads to their degradation and a subsequent passive loss of DNA methylation via replica-tion. Previously, we treated HEK293 cells with 5-Aza-CR and analyzed the effects on histone modifications and RNA expression [12]. We found that 5-Aza-CR treatment
* Correspondence:[email protected]
1Norris Comprehensive Cancer Center, University of Southern California, Los Angeles, CA 90089, USA
3Department of Biochemistry & Molecular Biology, Norris Comprehensive Cancer Center, University of Southern California, Los Angeles, CA 90089-9601, USA
Full list of author information is available at the end of the article
caused changes in gene expression in approximately 1,500 genes (out of the 24,000 genes analyzed) but less than 800 of the genes were up-regulated as a result, and most genes that showed increased expression were not regulated by promoters that displayed DNA methylation prior to treat-ment. In addition to affecting DNA methylation, 5-Aza-CR can also incorporate into RNA and interrupt normal cellular processes such as ribosomal assembly and transla-tion [14,15]. Therefore, it was not clear if the observed changes in transcript levels were due to changes in tran-scription rate from de-methylated promoters or to changes in RNA stability caused by intercalation of the 5-Aza-CR into the transcripts, affecting cellular signaling pathways due to translational defects. In addition, treatment with 5-Aza-CR does not completely abolish DNA methylation. Even with high doses, the overall levels of DNA methyla-tion are reduced only 50 to 60% [12]. Therefore, it was also possible that de-repression of genes was incomplete after treatment with the drug (due to the remaining DNA methylation) and that many more transcripts whose pro-moters are normally silenced by DNA methylation would be identified if a more dramatic reduction in DNA methy-lation could be achieved. Here we explore the remethy-lationship between DNA methylation and the epigenome using both HCT116 colorectal cancer cells and DKO1 cells, a derivative of HCT116 cells that have a bi-allelic knock-out of DNMT1 and bi-allelic deletion of exons 2 to 21 of DNMT3b [16]. Surprisingly, we found only a modest effect on the transcriptome and very limited increases in active marks on promoter regions. In order to fully understand the effects of global DNA methylation loss on the transcrip-tome and the epigenome at promoters and distal regulatory regions, we employed genome-wide methods for examining DNA methylation, RNA expression changes, histone modi-fication patterns, and RNA polymerase II (RNAPII) occu-pancy. We found that the most robust epigenomic changes occurring after loss of DNA methylation were due to the acquisition of thousands of new enhancers. Interestingly, many of the genes that were up-regulated in DKO1 cells via mechanisms distinct from de-methylation of promoter regions had multiple newly acquired intragenic enhancers.
Results
Loss of DNA methylation does not result in an increase in active histone marks at promoters
To determine the relationship between a reduction of DNA methylation and global epigenetic marks, we per-formed functional genomic analyses using DNMT-deficient HCT116 DKO1 cells. The DKO1 cell line has a bi-allelic knockout of DNMT1 and bi-allelic deletion of exons 2 to 21 of DNMT3b and is reported to have 5% of the overall DNA methylation levels relative to the parental HCT116 cell line [16]. However, these results were obtained using a liquid chromatography approach which monitored overall
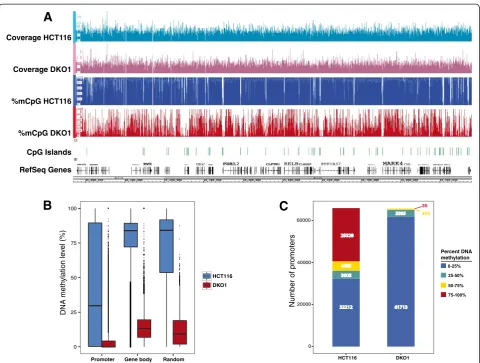
5-methylcytosine content genome-wide and thus did not examine DNA methylation reduction in specific genomic compartments such as promoters or gene bodies. We therefore performed whole genome bisulfite sequencing (WGBS) on HCT116 parental and DKO1 cells (Figure 1A); to achieve adequate coverage of GC-rich promoters, WGBS library preparation was performed as discussed in the Materials and methods section. We found that pro-moters, gene bodies, and randomly selected regions of the genome showed extensive losses of DNA methylation, with the median level of DNA methylation in DKO1 cells being <1%, 13%, and 9% of the parental cell line, respect-ively (Figure 1B). We note that randomly selected regions of the genome showed an overall reduction of 89% of their original methylation levels, which is slightly different than the value determined previously (95% reduction in methy-lation). However, Rhee et al. [16] used a method that monitors percentage methylation of all cytosines in the genome whereas we measured methylated cytosines in the context of CpG dinucleotides that are located in the uniquely mappable, non-repetitive regions of the human genome. As shown in Figure 1B, the promoters in parental HCT116 cells display a wide range of methylation levels. These promoters generally fall into two major groups, those having very high methylation or very low methyla-tion levels (Figure 1C); essentially all promoters have greatly reduced DNA methylation in DKO1 cells.
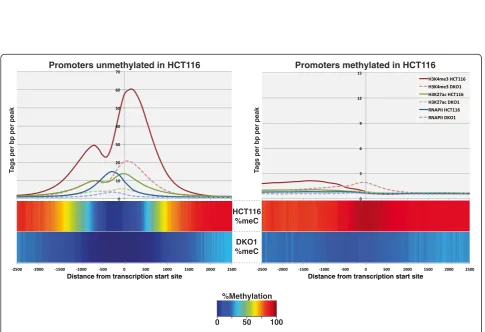
H3K4me3 peaks in both HCT116 and in DKO1 cells. A comparison of the two datasets revealed that very few new promoter-proximal H3K4me3 peaks were identified (Additional file 4). In fact, the overall level of H3K4me3 was greatly reduced at promoters originally unmethylated in HCT116, and promoters losing methylation in DKO1 did not gain H3K4me3 (Figure 3). To determine if other ac-tive epigenetic marks were also reduced at these promoter regions, we examined H3K27ac levels. Again, we found that relatively few promoters gained H3K27ac (Additional file 5) and that the active H3K27ac mark was reduced in DKO1 cells at promoters having H3K27ac in HCT116 (Figure 3). It was possible that the loss of DNA methylation did result in more active promoter regions, but somehow also inter-fered with recruitment of histone modifying enzymes, thus
altering the histone ChIP-seq profiles. Therefore, we next monitored the binding of RNAPII and found that essentially no promoters gained RNAPII in DKO1 cells (Additional file 6) and that, similar to the active histones, the levels of RNAPII also decreased at the vast majority of promoters in the DKO1 cells (Figure 3).
Identification of genes affected by loss of DNA methylation We had expected that the large increase in the number of accessible promoters in DKO1 cells due to the loss of DNA methylation (approximately 30,000 additional unmethylated promoters) would result in the transcriptional activation of a similar number of genes. However, we identified very few promoters that gained RNAPII in DKO1, suggesting that we would not find increased levels of transcripts for many
0 25 50 75 100
Promoter Gene body Random
HCT116 DKO1
DNA meth
l
n
oit
al
ye
v
)
%(
l
e
Coverage HCT116
Coverage DKO1
%mCpG HCT116
%mCpG DKO1
CpG Islands
RefSeq Genes
A
B
C
0 20000 40000 60000
Number of promoters
[image:3.595.58.539.86.449.2]Percent DNA methylation
RNAPII HCT116
H3K4me3 DKO1 H3K4me3 HCT116 RNAPII DKO1
H3K36me3 DKO1 H3K36me3 HCT116 H3K27ac DKO1 H3K27ac HCT116
[image:4.595.60.539.90.307.2]Region on chromosome 6.
Figure 2Overview of ChIP-seq data in HCT116 and DKO1 cells.Shown is a region of chromosome 6 illustrating the reduction in levels of active marks in DKO1 cells compared with HCT116 cells, for RNAP II (blues), H3K4me3 (reds), H3K27ac (greens), and H3K36me3 (oranges). Dark and light colors represent HCT116 and DKO1 cells, respectively. Although peaks are reduced in height at most sites, some genomic locations do have increases in H3K4me3 (blue boxes) or H3K27ac (red boxes) in DKO1 cells.
HCT116 %meC
DKO1 %meC
0 50 100
%Methylation
Promoters unmethylated in HCT116 Promoters methylated in HCT116
T
ags per bp per peak
T
ags per bp per peak
Distance from transcription start site Distance from transcription start site
[image:4.595.56.542.358.690.2]genes. Rather, because of the reduction in overall levels of active marks at promoters, we thought it was possible that lack of DNA methylation was causing a global decrease in transcription. We also note that DNA methylation is found in the body of genes and that studies have shown a correlation between gene body methylation and transcript levels [18-20]. Therefore, it was possible that the loss of
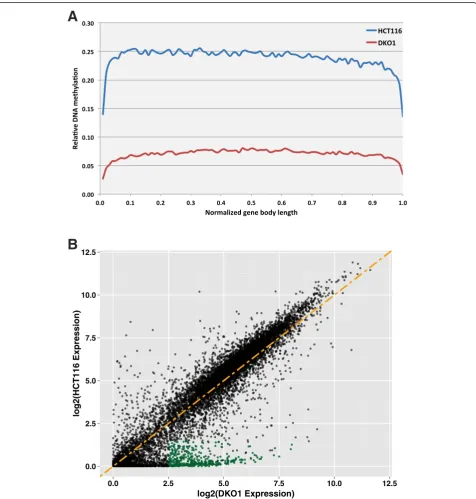
methylation was causing decreased transcription through-out the genome. To examine the consequences of the loss of DNA methylation on the transcriptome, we performed RNA-seq in HCT116 and DKO1 cells; see Additional file 7 for replicate comparisons of the RNA-seq samples and Additional file 8 for all gene expression values. Even though the relative levels of DNA methylation across gene
0.0 2.5 5.0 7.5 10.0 12.5
0.0 2.5 5.0 7.5 10.0 12.5
log2(DKO1 Expression)
log2(HCT116 Expression)
[image:5.595.60.537.185.685.2]B
A
bodies is much lower in DKO1 cells (Figure 4A), we found relatively similar transcriptome profiles in the two cell lines (Figure 4B), suggesting that gene body methylation does not play a significant role in regulating gene expres-sion in HCT116 and DKO1 cells.
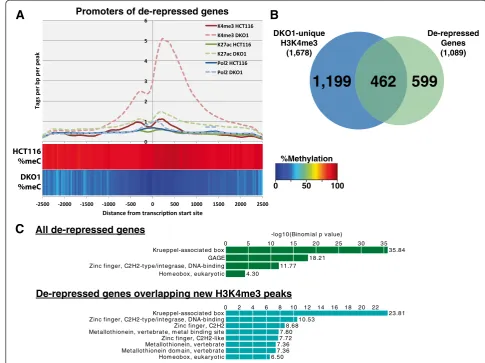
We did, however, identify three sets of transcripts that were affected by loss of DNA methylation (Additional file 8). One set of transcripts affected by a loss of methy-lation at promoters, shown in green in Figure 4B, corre-sponds to 1,089 transcripts that are lowly expressed (log2 normalized expression <1.5) in HCT116 and highly expressed (log2 normalized expression >2.5) in DKO1 cells. The promoters of these genes, which we have termed de-repressed, were highly methylated in HCT116 and unmethylated in DKO1 (Figure 5A). Because there are similar numbers of de-repressed genes as DKO1-specific H3K4me3 peaks (Additional file 4), we thought that per-haps the promoters of the de-repressed genes would show
an increase in levels of H3K4me3. Indeed, tag density plots across the promoters of de-repressed genes show that, on average, H3K4me3 is increased at these pro-moters. However, an overlap analysis showed that only ap-proximately 40% of the de-repressed genes gained a new H3K4me3 peak (Figure 5B). It was possible that the pro-moters of the 599 de-repressed genes that did not have a new H3K4me3 site were bound by H3K4me3 in HCT116, even though they were silenced. However, we found that only 78 of these 599 promoters were in the set of common H3K4me3 peaks. To investigate the possibility that the remaining 521 de-repressed genes might be utilizing a new (alternative) promoter region, we determined the dis-tance from the TSS of each gene to the nearest DKO1-specific H3K4me3 site. Only 48 of these genes had a newly acquired H3K4me3 site within 20 kb, with the median dis-tance from the known TSS to the nearest new H3K4me3 site in DKO1 cells being over 250 kb, suggesting that if
B
A
DKO1-unique H3K4me3
(1,678)
De-repressed Genes (1,089)
599
1,199
462
Krueppel-associat ed box GAGE Zinc finger, C2H2-t ype/int egrase, DNA-binding Hom eobox, eukaryot ic
0 5 10 15 20 25 30 35
35.84 18.21
11.77 4.30
-log10(Binom ial p value)
Krueppel-associat ed box Zinc finger, C2H2-t ype/int egrase, DNA-binding Zinc finger, C2H2 Met allot hionein, vert ebrat e, m et al binding sit e Zinc finger, C2H2-like Met allot hionein, vert ebrat e Met allot hionein dom ain, vert ebrat e Hom eobox, eukaryot ic
0 2 4 6 8 10 12 14 16 18 20 22
23.81 10.53
8.68 7.80 7.72 7.36 7.36 6.50
C
Promoters of de-repressed genes
All de-repressed genes
De-repressed genes overlapping new H3K4me3 peaks
0 50 100
[image:6.595.51.537.314.677.2]%Methylation
this mechanism is used, the alternative promoters are quite far from the rest of the gene. One hallmark of cancer cell gene expression is the repression of tumor suppressor genes via promoter methylation. Therefore, one would expect that some of the de-repressed genes would be tumor suppressor genes. Of the 1,089 de-repressed genes in DKO1, 38 were identified as tumor suppressor genes present in the current TSGene database [21] (Additional file 9). A Gene Ontology analysis of the entire site of de-repressed genes revealed enrichment for zinc finger and Krueppel-associated genes (Figure 5C), many of which are found in large clusters on chromosome 19. Zinc finger genes were particularly enriched in the set of de-repressed genes overlapping new H3K4me3 peaks in DKO1.
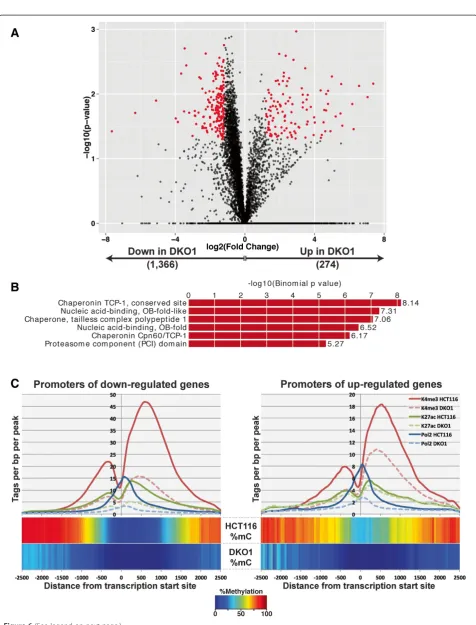
The other sets of transcripts that were altered in DKO1 cells are those that were expressed in HCT116 (and thus did not have high levels of DNA methylation at the promoter region in HCT116 cells) but showed expression changes (either up or down) in DKO1 cells (Figure 6A). A Gene Ontology analysis of the 274 genes up-regulated in DKO1 did not reveal any significant gene categories, but 22 genes were identified as tumor sup-pressor genes present in the TSGene database. Thus, loss of DNA methylation resulted in the up-regulation of tumor suppressor genes by both promoter methylation-dependent (38 genes) and promoter methylation-inmethylation-dependent (22 genes) mechanisms. Analysis of the 1,366 down-regulated genes showed enrichment for chaperonins (Figure 6B). Chaperonins, which are involved in protein folding, are overexpressed in cancers [22]; our studies suggest redu-cing global DNA methylation levels may be a suitable op-tion for reducing the levels of these proteins in cancer cells. However, we note that the expression differences of these genes in response to loss of DNA methylation are modest. Unlike the promoters of the de-represssed genes (Figure 5A), analysis of the promoter regions of the up-regulated genes (Figure 6C, right panel) did not show an increase in levels of active marks. Strikingly, active histone marks and RNAPII have similar profiles for the promoters of genes up- or down-regulated in DKO1, indicating that perhaps some other mechanism is responsible for the dif-ferential regulation of these genes. However, we have also considered that there may be a modest global change in gene expression due to loss of DNA methylation that is difficult to observe using RNA-seq as a read-out. For ex-ample, if expression of all genes is modestly increased in DKO1 cells, then the genes identified as 'down-regulated' may simply be those that did not increase as much as the rest of the transcriptome. Because modest global changes are difficult to quantify using current methods, it remains possible that the 1,336 down-regulated genes do not show a loss of active histone marks because they in fact repre-sent a set of genes that simply do not respond to a loss of DNA methylation (with all other genes showing increased
expression). Finally, to further classify the promoters of the altered genes, we determined if they were located within a CpG island or if they had a TATA box. We found that for all three categories of genes that responded to loss of DNA methylation, the majority of promoters were cate-gorized as CpG island promoters. However, a smaller per-centage of the de-repressed genes were CpG islands (58%) compared with the up-regulated (75%) or down-regulated (83%) genes. For all cases, the CpG islands averaged ap-proximately 1 kb in length. Allowing one mismatch to the TATAWAW motif, we found that few promoters in any class contained a TATA box within -20 to -40 of the TSS (de-repressed: 10%; up-regulated: 10%; down-regulated: 7%).
Loss of DNA methylation has major effects on distal regulatory regions
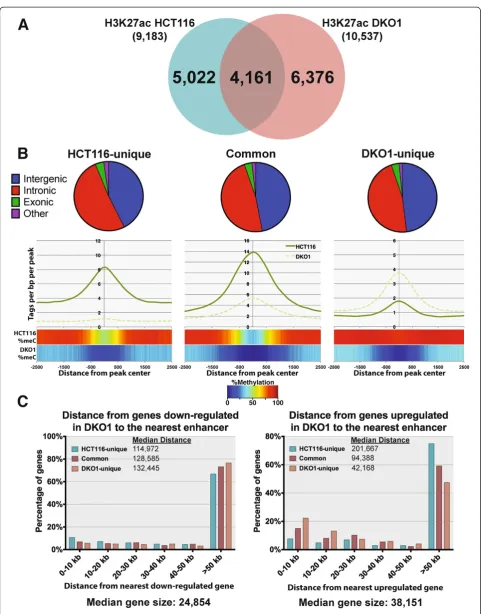
The median distance of a DKO1-unique enhancer from a gene up-regulated in DKO1 cells is approximately 42 kb, whereas the median distance to an HCT116-unique en-hancer is over 200 kb (Figure 7C, right panel). For com-parison, we show that the DKO1-unique enhancers have a median distance of approximately 132 kb to the down-regulated genes and are farther from the down-down-regulated genes than are the HCT116-unique enhancers (Figure 7C, left panel).
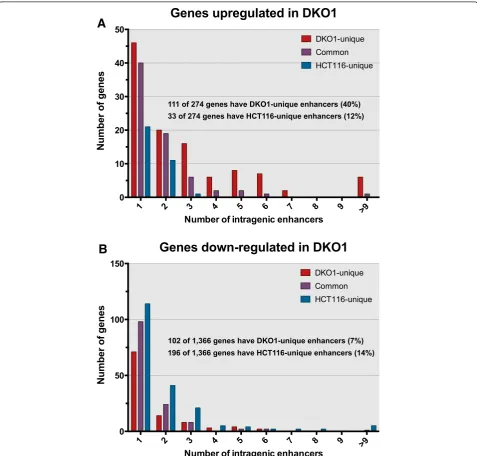
As noted above, the median distance between a DKO1-unique enhancer and the start site of a gene up-regulated in DKO1 cells was approximately 42 kb, which is similar to the median size of the up-regulated genes. Because en-hancers can function in either direction, this suggested that perhaps genes up-regulated in DKO1 cells contained DKO1-specific intragenic enhancers. We determined the number of enhancers within the genes up-regulated (Figure 8A) and down-regulated (Figure 8B) in DKO1 cells. We found that in the genes up-regulated in DKO1 cells, the number of DKO1-specific intragenic enhancers was much higher than the number of HCT-unique enhancers (40% of the genes had a DKO1-specific intra-genic enhancer but only 12% of the genes had a HCT-specific intragenic enhancer). In contrast, the number of HCT116-specific versus DKO1-specific enhancers was more similar for the genes down-regulated in DKO1 cells. The relative levels of H3K27ac at the promoter regions did not change for the 111 up-regulated genes that had new intragenic enhancers. However, the H3K27ac marks at the intragenic enhancers was higher in DKO1 than in HCT116 (Figure 9A). A motif analysis of these new intra-genic enhancers did not reveal an enrichment for any spe-cific transcription factor binding sites. Of the 310 intergenic enhancers identified within the gene bodies of 111 genes, 285 were identified as intronic and 25 were exonic (Figure 9A). We observed that 65 of the 111 genes that had a DKO1-unique enhancer had more than one new intra-genic enhancer. This suggested that perhaps the en-hancers were spreading throughout the gene. This is in fact what we observed, and an example is shown in
Fig-ure 9B. The SASH1 gene now has marks of active
en-hancers throughout the transcribed region and is expressed 3.7-fold higher in DKO1 cells.
Discussion
Using DKO1 cells that have a severe reduction in global DNA methylation levels due to genetic deletion of the DNMT1 and DNMT3b genes, we have investigated the
global relationship of DNA methylation with histone modifications, RNAPII binding, and gene expression. Al-though other groups have previously analyzed DNA methylation and gene expression in DKO1 cells [24-26], this had not been done on a genome-wide scale. Because methylated promoters are in condensed chromatin which cannot be accessed by transcription factors and because DNA methylation of recognition motifs has been shown to inhibit transcription factor binding [27,28], we had anticipated that the de-methylation of promoters in DKO1 cells would expose thousands of previously inaccessible binding motifs, many of which would be recognized by transcription factors that are ubiquitously expressed. Therefore, we hypothesized that a reduction in DNA methylation would create thousands of new binding sites for transcription complexes, which would recruit RNAPII, leading to reactivation of these promoters. In contrast, active enhancers are highly cell type-specific and thus it seemed likely that even upon removal of methylation at the distal regulatory regions, few new enhancers would be created because the cell type-specific factors would not be present in DKO1 cells to bind to the motifs and recruit histone acetylation complexes. In contrast, we found that relatively few pro-moters were activated in DKO1 cells but thousands of newly active enhancers (which were highly methylated in parental HCT116 cells) were created. Interestingly, 3,008 (47%) of the 6,376 new enhancers that appeared in DKO1 cells had the H3K4me1 mark of a poised enhan-cer in the parental HCT116 cell line. Our studies indi-cate that 1) in general, loss of DNA methylation does not lead to the acquisition of newly active promoters, suggesting that DNA methylation is not the primary driver of promoter repression, and 2) loss of DNA methylation has a major effect on promoter-distal regu-latory regions, uncovering intragenic enhancers within genes whose expression increases upon loss of DNA methylation.
We investigated the effect of loss of DNA methylation on histone modifications at promoters, enhancers, and gene bodies. We found that overall levels of all active histone marks were reduced at most promoters in DKO1 cells, regardless of their methylation status in HCT116 cells. The reason for this overall decrease in ac-tive promoter marks in DKO1 cells is not clear. How-ever, DKO1 cells do grow slightly more slowly than HCT116 cells [16] and it is possible that small differ-ences in the percentage of cells in S phase may influence
(See figure on previous page.)
ChIP-seq analysis of promoters. Conversely, we identi-fied thousands of new enhancers that have increased levels of H3K27Ac in DKO1 cells, indicating that the ChIP-seq assay is able to detect high levels of modified histones in DKO1 cells. These results suggest that DNA
methylation is in fact a primary regulator of the activity of enhancers. In addition, we found only modest changes in H3K36me3 or H3K9me3 levels in HCT116 versus DKO1 cells (data not shown). Our previous studies using ChIP-chip had suggested that DNA methylation
102 of 1,366 genes have DKO1-unique enhancers (7%) 196 of 1,366 genes have HCT116-unique enhancers (14%)
A
B
[image:11.595.62.542.90.103.2]111 of 274 genes have DKO1-unique enhancers (40%) 33 of 274 genes have HCT116-unique enhancers (12%)
[image:11.595.59.537.246.702.2]Figure 8Genes up-regulated in DKO1 cells have new intragenic enhancers. (A)Graph plotting the number of intragenic enhancers for the 274 genes up-regulated in DKO1 cells.(B)Graph plotting the number of intragenic enhancers for the 1,366 genes down-regulated in DKO1 cells. (See figure on previous page.)
may be required for H3K9me3 deposition [29]. In fact, follow-up studies using ChIP-seq showed a major reduc-tion in H3K9me3 across the entire chromosome 19 (PJ Farnham and S Iyengar, unpublished data). However, in those studies DNA methylation levels were reduced by treatment of cells with the DNMT inhibitor 5-Aza-CR. It is likely that the effect on H3K9me3 may have been due to redistribution of the KAP1/SETDB1 histone methyl-transferase complex due to the activation of the DNA damage response and not directly due to loss of DNA methylation [30]. We now show that the H3K9me3 pat-terns are essentially the same in HCT116 and DKO1 cells. An analysis of chromosome 19 in DKO1 cells using a ChIP-chip assay [26] is in agreement with our ChIP-seq data showing that H3K9me3 and H3K36me3 are not dra-matically affected in DKO1 cells. Thus, interpretation of the mechanisms leading to changes in histone marks caused by 5-Aza-CR must be made with caution.
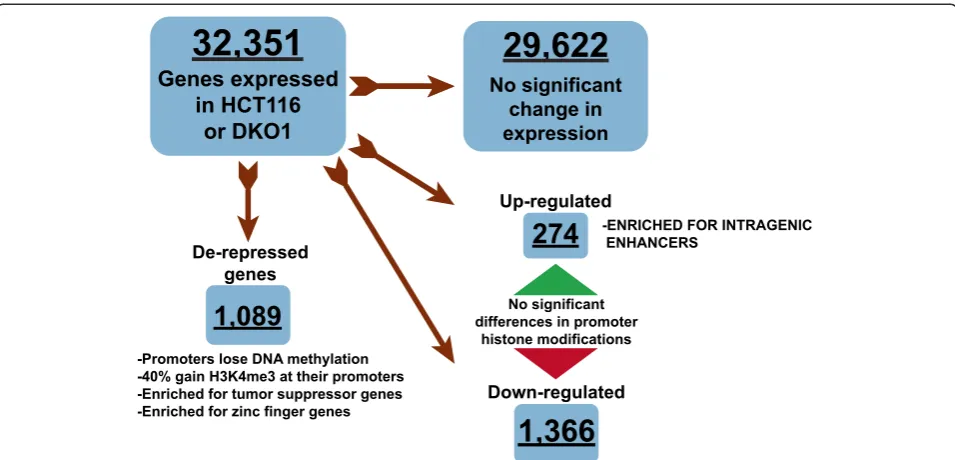
Unexpectedly, we found that very few genes increased in expression in DKO1 cells. However, we did identify two sets of genes whose expression increased by differ-ent mechanisms in these cells (Figure 10). One set of genes was up-regulated due to the removal of DNA
methylation from their promoters (de-repressed
[image:12.595.58.539.87.445.2]genes). The other set of up-regulated genes had unmethylated, active promoters in HCT116 cells, but showed increases in overall transcript levels in the DKO1 cells. Interestingly, the later set of genes con-tained multiple active enhancers within their gene bodies in DKO1 cells, and these same enhancers were methylated in HCT116 cells. Intronic enhancers have been previously described to regulate the genes they reside within [23,31-33]. Here, we have identi-fied several hundred genes that may be controlled by increases in active histones at intragenic enhancers. However, further functional studies in which these
enhancer regions are knocked out or repressed will be required to truly determine whether these intronic enhancers are responsible for the activation of these genes in DKO1 cells. Both the de-repressed and the up-regulated genes included tumor suppressor genes, and the resulting mutant cells display characteristics of normal cells (slightly slower doubling times
rela-tive to HCT116) as was previously shown by Rhee et
al. [16]. Thus, although reducing DNA methylation
has modest effects on gene expression, perhaps it will prove suitable as a therapeutic target.
Conclusions
While DNA methylation can play a role in the repres-sion of gene expresrepres-sion, our studies indicate that it is likely not the key determinant in the regulation of most promoters in HCT116 cells. Our finding that loss of DNA methylation does not result in the acquisition of active histone marks or an increase in gene expression from most de-methylated promoters suggests that these promoters may remain in a closed or condensed con-firmation. This interpretation is supported by other studies showing that promoters that lose DNA methyla-tion in DKO1 cells do not gain accessibility to a specific restriction enzymes [34] and do not gain nucleosome-depleted regions (FD Lay, Y Liu, and BP Berman, per-sonal communication). Thus, DNA methylation may be a consequence of, not causation for, promoter silencing. However, DNA methylation plays a much greater role in the silencing of distal regulatory elements, with many of
the enhancers activated by loss of DNA methylation fall-ing within the bodies of their probable target genes.
Materials and methods Cell growth conditions
The human cell lines HCT116 (ATCC #CCL-247) and
DKO1 [16] were grown in McCoy’s 5A Medium
supple-mented with 10% fetal bovine serum and 1% penicillin/ streptomycin and were harvested for downstream exper-iments at 80% confluence.
Whole genome bisulfite sequencing
Genomic DNA was collected from HCT116 and DKO1 cells using a Qiagen (Valencia, CA, USA) QIAeasy DNA mini kit. Genomic DNA (2μg) was sonicated using a Cov-aris to an average molecular weight of 150 bp. Achievement of the desired size range was verified by Bioanalyzer (Agilent Technologies, Santa Clara, CA, USA) analysis. Fragmented DNA was repaired to generate blunt ends using the END-It kit (Epicentre Biotechnologies, Madison, WI, USA) according to the manufacturer’s instructions. Following incubation, the treated DNA was purified using AmpureX beads (Beckman Coulter, Brea, CA, USA). In general, magnetic beads were employed for all nucleic acid purifications in the following protocol. Following end repair, A-tailing was performed using the NEB dA-tailing module according to the manufacturer’s in-structions (New England Biolabs, Ipswich, MA, USA). Adapters with a 3′ ‘T’ overhang were then ligated to the end-modified DNA. For whole genome bisulfite
29,622
No significant change in expression
32,351
Genes expressed
in HCT116
or DKO1
De-repressed genes
1,089
-Promoters lose DNA methylation -40% gain H3K4me3 at their promoters -Enriched for tumor suppressor genes -Enriched for zinc finger genes
Down-regulated
1,366
Up-regulated
274
No significant differences in promoter
histone modifications
[image:13.595.59.537.88.318.2]-ENRICHED FOR INTRAGENIC ENHANCERS
sequencing, modified Illumina paired-end adapters were used in which cytosine bases in the adapter are replaced with 5-methylcytosine bases. Depending on the specific application, we utilized either Early Access Methylation Adapter Oligos that do not contain barcodes, or the adapters present in later versions of the Illumina DNA Sample Preparation kits, which contain both indices and methylated cytosines. Ligation was carried out using ultra-pure, rapid T4 ligase (Enzymatics, Beverly, MA, USA) ac-cording to the manufacturer’s instructions. The final product was then purified with magnetic beads to yield an adapter-ligation mix. Prior to bisulfite conversion, bac-teriophage lambda DNA that had been through the same library preparation protocol described above to generate adapter-ligation mixes was combined with the genomic sample adapter ligation mix at 0.5% w/w. Adapter-ligation mixes were then bisulfite converted using the Zymo DNA Methylation Gold kit (Zymo Research, Orange, CA, USA) according to the manufacturer’s recommendations. Final modified product was purified by magnetic beads and eluted in a final volume of 20μl. Amplification of one-half the adapter-ligated library was performed using HiFi-U Ready Mix (Kapa Biosystems, Wilmington, MA, USA) for the following protocol: 98° for 2 minutes; then six cycles of 98° for 30 s, 65° for 15 s, 72° for 60 s; with a final 72° 10-minute extension, in a 50 μl total volume reaction. The final library product was examined on the Agilent Bioanalyzer, then quantified using the Kapa Biosystems Library Quantification kit according the to manufacturer’s instructions. Optimal concentrations to get the right clus-ter density were declus-termined empirically but tended to be higher than for non-bisulfite libraries. Libraries were plated using the Illumina cBot and run on the Hi-Seq 2000 according to the manufacturer’s instructions using HSCS v.1.5.15.1. Image analysis and base calling were car-ried out using RTA 1.13.48.0, and deconvolution and fastq file generation were carried out using CASAVA_v1.7.1a5. Raw reads were mapped using Bis-SNP [35], and percent-age methyl-C/C was calculated for every CpG dinucleotide in the human genome. All CpG dinucleotides with a mini-mum sequencing coverage of 3× were used for downstream analyses. To determine the average DNA methylation sur-rounding a set of promoters or enhancers, HOMER was used to calculate the percentage methylation across pro-moter or enhancer regions using the annotatePeaks.pl script and the‘-ratio’option for 2,500 bp surrounding the regions of interest using a bin size of 100 bp. The resulting bins were plotted as a heatmap using heatmap.2 in R.
ChIP-seq
ChIP assays were was performed in replicate for H3K4me3 (Cell Signaling Technology, Danvers, MA, USA; 9751S, lot# 4), H3K27ac (Active Motif, Carlsbad, CA, USA; #39133, lot# 21311004), and RNAPII (Covance, Princeton,
NJ, USA; MMS-126R (8WG16), Lot# D12LF0314) in DKO1 cells and one replicate of RNAPII ChIP-seq was performed in HCT116 cells, as previously described [36]. The ChIP-seq libraries were sequenced on a HiSeq2000; the H3K4me3 datasets from HCT116 were available via ENCODE and were downloaded from the UCSC browser, accession number [UCSC: wgEncodeEH000949]. All ChIP-seq data were mapped to hg19 using BWA (default param-eters) and peaks were called using Sole-Search [37,38] with the following parameters: Permutation:5; Fragment:250; AlphaValue: 0.00010 = 1.0E-4; FDR: 0.00010 = 1.0E-4; Peak-MergeDistance:0; HistoneBlurLength:1200 for H3K4me3 and H3K27ac. Each replicate ChIP-seq dataset was ana-lyzed separately and only peaks present in both replicates were used for the subsequent analyses; see Additional file 1 for ChIP-seq reproducibility measures. Peaks were sepa-rated by their proximity to promoters, with promoter-proximal peaks defined as those found within ±2 kb of a TSS and promoter-distal as everything else; enhancers were defined as promoter-distal H3K27ac sites. To create TSS-centered tag density plots, mapped reads were used with the HOMER annotatePeaks script [39] and the -hist option to average ChIP-seq tags relative to all (or in some cases to a subset of) RefSeq TSSs. To create enhancer-centered tag density plots, the center of the H3K27ac peaks were used. The mergePeaks option in HOMER was used to determine overlapping H3K27ac regions between HCT116 and DKO1 at proximal and distal sites. H3K27ac peak proximity to TSSs was determined using annotate-Peaks. Gene Ontology analysis was performed using Stan-ford’s Genomic Regions Enrichment of Annotations Tool (GREAT) [40].
RNA-seq
for HCT116 and for DKO1 shows that the RNA-seq data sets from the two replicates are highly reproducible (Additional file 7). In addition, visual inspection of the RNA-seq reads on a genome browser (with no normalization) shows very similar RNA profiles in HCT116 and DKO1 cells, except for the set of genes that were identified to have altered expression.
Data access
WGBS and RNA-seq datasets for HCT116 and DKO1 cells were produced for this manuscript and are deposited in Gene Expression Omnibus (GEO) [GEO: GSE60106]. H3K27ac and H3K4me3 ChIP-seq datasets in DKO1 cells and RNAPII ChIP-seq data for both HCT116 and DKO1 cells were produced for this manuscript and are deposited in GEO [GEO: GSE60106]. H3K4me3 [UCSC: wgEnco-deEH000949], H3K27ac [UCSC: wgEncodeEH002873], H3K4me1 [UCSC: wgEncodeEH002874] and part of the RNAPII [UCSC: wgEncodeEH000651] HCT116 ChIP-seq data were produced as part of the ENCODE Consortium [14] and can be downloaded from the UCSC genome browser.
Additional files
Additional file 1:Sequencing and peak metrics for all ChIP-seq, RNA-seq, and WGBS datasets.ChIP-seq reads were mapped using BWA and peaks were called using Sole-Search [37,38]. All data was collected as part of this study except for H3K4me3 from HCT116, which was from ENCODE. However, for consistency, the reads were remapped and peaks were called for this dataset using Sole-Search. High-confidence (HC) peaks were determined as those present in two independent biological replicates. Promoter-proximal or promoter-distal peaks were selected by their proximity to a TSS, with proximal being those peaks within 2000 bp of a TSS and distal being everything else.
Additional file 2:ChIP-seq peaks in HCT116 cells.Worksheet containing all peaks called using Sole-Search for H3K27ac (Sheet 1), H3K4me3 (Sheet2) and RNAPII (Sheet 3) in HCT116 cells.
Additional file 3:ChIP-seq peaks in DKO1 cells.Worksheet containing all peaks called using Sole-Search for H3K27ac (Sheet 1), H3K4me3 (Sheet2) and RNAPII (Sheet 3) in DKO1 cells.
Additional file 4:Characterization of H3K4me3 promoter-proximal peaks in HCT116 and DKO1 cells.Venn diagram showing differences in binding sites for promoter-proximal H3K4me3 peaks (top), and the density of H3K4me3 ChIP-seq tags in HCT116 and DKO1 for all three peak categories (bottom).
Additional file 5:Characterization of H3K27ac promoter-proximal peaks in HCT116 and DKO1 cells.Venn diagram showing differences in binding sites for promoter-proximal H3K27ac peaks (top), and the density of H3K27ac ChIP-seq tags in HCT116 and DKO1 for all three peak categories (bottom).
Additional file 6:Characterization of RNAP2 promoter-proximal peaks in HCT116 and DKO1 cells.Venn diagram showing differences in binding sites for promoter-proximal RNA polymerase 2 peaks (top), and the density of RNA polymerase 2 ChIP-seq tags in HCT116 and DKO1 for all three peak categories (bottom).
Additional file 7:Replicate RNA-seq analysis.log2 expression values are plotted comparing replicates for of the same cell type, and across cell types for HCT116 and DKO1 cells.
Additional file 8:RNA-seq analysis of HCT116 and DKO1 cells. Worksheet containing the output from RNA-seq analysis using Partek Flow version 3.0.14.0321. Sheet 1 contains Genes, statistics, and expression values for all transcripts from the gene-specific analysis. Sheet 2 lists all de-repressed genes, and their expression values in HCT116 and DKO1. Sheet 3 lists all up-regulated genes and their expression values in HCT116 and DKO1. Sheet 4 lists all down-regulated genes and their expression values in HCT116 and DKO1.
Additional file 9:Differentially expressed tumor suppressor and zinc finger genes.Sheet 1 lists all de-repressed tumor suppressor genes and their expression values in HCT116 and DKO1. Sheet 2 lists all up-regulated tumor suppressor genes and their expression values in HCT116 and DKO1. Sheet 3 lists all de-repressed zinc finger genes and their expression values in HCT116 and DKO1.
Additional file 10:ChIP-seq peaks of enhancer regions.Sheet 1 lists all H3K27ac peaks that are unique to HCT116 cells. Sheet 2 lists all H3K27ac peaks that are unique to DKO1. Sheet 3 lists all H3K27ac peaks that are common to HCT116 and DKO1. Sheet 3 lists all H3K27ac peaks present within intragenic regions of genes up-regulated in DKO1.
Abbreviations
5-Aza-CR:5-azacytidine; bp: base pair; ChIP: chromatin immunoprecipitation; DNMT: DNA methyltransferase; GEO: Gene Expression Omnibus; RNAPII: RNA polymerase II; TSS: transcription start site; WGBS: whole genome bisulfite sequencing.
Competing interests
The authors declare that they have no competing interests.
Authors’contributions
AB prepared samples, performed analyses for figures, and assisted in drafting the manuscript, LY performed analyses for figures, HW and YG performed ChIP-seq experiments, CMN and BPB carried out the DNA methylation library methods development, PJF conceived of the project, advised on all experiments and drafted the manuscript. All authors read and approved the final manuscript.
Acknowledgments
The H3K4me3 HCT116 ChIP-seq was produced by the laboratory of John Stamatoyannopoulos at the University of Washington and the H3K27ac and H3K4me1 HCT116 ChIP-seq data was produced by the Farnham laboratory, each as part of the ENCODE Consortium [17] and is available at (http:// genome.ucsc.edu); all data used in this study is past the 9 month moratorium. One replicate of H3K4me3 and one replicate of H3K27ac ChIP-seq in DKO, in addition to one replicate of RNA-seq in each cell type was produced by Fides Lay in the laboratory of Peter Jones at the University of Southern California. We thank them for this data and for their commentary on the project. This work was supported in part by 1U01ES017154, U54HG006996, and P30CA014089 from the National Cancer Institute; AB was supported in part by a pre-doctoral training fellowship from the National Human Genome Research Institute of the National Institutes of Health under grant number F3100HG6114. BB, YL, and LY were supported in part by National Institutes of Health under grant number U01ES017054. We thank Selene Tyndale and Helen Truong for services rendered at the USC Molecular Genomics Sequencing core. We thank Meng Li and Yibu Chen at the USC Norris Medical Library Bioinformatics Services Program for their assistance in running Partek Flow. We thank Matt Grimmer and the members of Farnham laboratory for helpful discussions.
Author details 1
Norris Comprehensive Cancer Center, University of Southern California, Los Angeles, CA 90089, USA.2Integrated Genetics and Genomics, University of California-Davis, Davis, CA 95616, USA.3Department of Biochemistry & Molecular Biology, Norris Comprehensive Cancer Center, University of Southern California, Los Angeles, CA 90089-9601, USA.
References
1. Boyes J, Bird A:Repression of genes by DNA methylation depends on CpG density and promoter strength: evidence for involvement of a methyl-CpG binding protein.EMBO J1992,11:327.
2. Cedar H, Siegfried Z, Eden S, Mendelsohn M, Feng X, Tsuberi B-Z:DNA methylation represses transcription in vivo - Nature Genetics.Nat Genet 1999,22:203–206.
3. Jones PA:The Role of DNA Methylation in Mammalian Epigenetics.
Science2001,293:1068–1070.
4. Laurent L, Wong E, Li G, Huynh T, Tsirigos A, Ong CT, Low HM, Kin Sung KW, Rigoutsos I, Loring J, Wei C-L:Dynamic changes in the human methylome during differentiation.Genome Res2010,20:320–331. 5. Hinoue T, Weisenberger DJ, Lange CPE, Shen H, Byun H-M, Van Den Berg D,
Malik S, Pan F, Noushmehr H, van Dijk CM, Tollenaar RAEM, Laird PW: Genome-scale analysis of aberrant DNA methylation in colorectal cancer.
Genome Res2012,22:271–282.
6. Kelly TK, Liu Y, Lay FD, Liang G, Berman BP, Jones PA:Genome-wide mapping of nucleosome positioning and DNA methylation within individual DNA molecules.Genome Res2012,22:2497–2506.
7. Xie W, Schultz MD, Lister R, Hou Z, Rajagopal N, Ray P, Whitaker JW, Tian S, Hawkins RD, Leung D, Yang H, Wang T, Lee AY, Swanson SA, Zhang J, Zhu Y, Kim A, Nery JR, Urich MA, Kuan S, Yen C-A, Klugman S, Yu P, Suknuntha K, Propson NE, Chen H, Edsall LE, Wagner U, Li Y, Ye Z,et al:Epigenomic analysis of multilineage differentiation of human embryonic stem cells. Cell2013,153:1134–1148.
8. Zhu Y, Sun L, Chen Z, Whitaker JW, Wang T, Wang W:Predicting enhancer transcription and activity from chromatin modifications.Nucleic Acids Res 2013,41:10032–10043.
9. Sakai T, Toguchida J, Ohtani N, Yandell DW, Rapaport JM, Dryja TP:Allele-specific hypermethylation of the retinoblastoma tumor-suppressor gene.Am J Hum
Genet1991,48:880–888.
10. Merlo A, Herman JG, Mao L, Lee DJ, Gabrielson E, Burger PC, Baylin SB, Sidransky D:5′CpG island methylation is associated with transcriptional silencing of the tumour suppressor p16/CDKN2/MTS1 in human cancers.
Nat Med1995,1:686–692.
11. Esteller M, Sanchez-Cespedes M, Rosell R, Sidransky D, Baylin SB, Herman JG: Detection of aberrant promoter hypermethylation of tumor suppressor genes in serum DNA from non-small cell lung cancer patients.Cancer Res 1999,59:67–70.
12. Komashko VM, Farnham PJ:5-azacytidine treatment reorganizes genomic histone modification patterns.Epigenetics2010,5:229–240.
13. Kaminskas E, Farrell AT, Wang Y-C, Sridhara R, Pazdur R:FDA drug approval summary: azacitidine (5-azacytidine, Vidaza) for injectable suspension.
Oncologist2005,10:176–182.
14. Li LH, Olin EJ, Buskirk HH, Reineke LM:Cytotoxicity and mode of action of 5-azacytidine on L1210 leukemia.Cancer Res1970, 30:2760–2769.
15. Stresemann C, Lyko F:Modes of action of the DNA methyltransferase inhibitors azacytidine and decitabine.Int J Cancer2008,123:8–13. 16. Rhee I, Bachman KE, Park BH, Jair K-W, Yen R-WC, Schuebel KE, Cui H,
Feinberg AP, Lengauer C, Kinzler KW, Baylin SB, Vogelstein B:DNMT1 and DNMT3b cooperate to silence genes in human cancer cells.Nature2002, 416:552–556.
17. ENCODE Project Consortium:An integrated encyclopedia of DNA elements in the human genome.Nature2012,489:57–74. 18. Hellman A, Chess A:Gene body-specific methylation on the active X
chromosome.Science2007,315:1141–1143.
19. Feng S, Cokus SJ, Zhang X, Chen P-Y, Bostick M, Goll MG, Hetzel J, Jain J, Strauss SH, Halpern ME, Ukomadu C, Sadler KC, Pradhan S, Pellegrini M, Jacobsen SE:Conservation and divergence of methylation patterning in plants and animals.Proc Natl Acad Sci2010,107:8689–8694.
20. Lister R, Pelizzola M, Dowen RH, Hawkins RD, Hon G, Tonti-Filippini J, Nery JR, Lee L, Ye Z, Ngo Q-M, Edsall L, Antosiewicz-Bourget J, Stewart R, Ruotti V, Millar AH, Thomson JA, Ren B, Ecker JR:Human DNA methylomes at base resolution show widespread epigenomic differences.Nature2009, 462:315–322.
21. Zhao M, Sun J, Zhao Z:TSGene: a web resource for tumor suppressor genes.Nucleic Acids Res2012,41:D970–D976.
22. Coghlin C, Carpenter B, Dundas SR, Lawrie LC, Telfer C, Murray GI: Characterization and over-expression of chaperonin t-complex proteins in colorectal cancer.J Pathol2006,210:351–357.
23. Thurman RE, Rynes E, Humbert R, Vierstra J, Maurano MT, Haugen E, Sheffield NC, Stergachis AB, Wang H, Vernot B, Garg K, John S, Sandstrom R, Bates D, Boatman L, Canfield TK, Diegel M, Dunn D, Ebersol AK, Frum T, Giste E, Johnson AK, Johnson EM, Kutyavin T, Lajoie B, Lee B-K, Lee K, London D, Lotakis D, Neph S,et al:The accessible chromatin landscape of the human genome.Nature2012,489:75–82.
24. Paz MF, Wei S, Cigudosa JC, Rodriguez-Perales S, Peinado MA, Huang TH-M, Esteller M:Genetic unmasking of epigenetically silenced tumor suppressor genes in colon cancer cells deficient in DNA methyltransferases.Hum Mol
Genet2003,12:2209–2219.
25. Jacinto FV, Ballestar E, Ropero S, Esteller M:Discovery of epigenetically silenced genes by methylated DNA immunoprecipitation in colon cancer cells.Cancer Res2007,67:11481–11486.
26. Hahn MA, Wu X, Li AX, Hahn T, Pfeifer GP:Relationship between gene body DNA methylation and intragenic H3K9me3 and H3K36me3 chromatin marks.PLoS One2011,6:e18844.
27. Blattler A, Yao L, Wang Y, Ye Z, Jin VX, Farnham PJ:ZBTB33 binds unmethylated regions of the genome associated with actively expressed genes.
Epigenetics Chromatin2013,6:13.
28. Blattler A, Farnham PJ:Cross-talk between site-specific transcription factors and DNA methylation states.J Biol Chem2013,288:34287–34294. 29. Komashko VM, Acevedo LG, Squazzo SL, Iyengar SS, Rabinovich A, O’geen H, Green R, Farnham PJ:Using ChIP-chip technology to reveal common principles of transcriptional repression in normal and cancer cells.
Genome Res2008,18:521–532.
30. Iyengar S, Farnham PJ:KAP1 Protein: An Enigmatic Master Regulator of the Genome.J Biol Chem2011,286:26267–26276.
31. Zhang X, Zhou L, Fu G, Sun F, Shi J, Wei J, Lu C, Zhou C, Yuan Q, Yang M: The identification of an ESCC susceptibility SNP rs920778 that regulates the expression of lncRNA HOTAIR via a novel intronic enhancer.
Carcinogenesis2014,31:2062–2067.
32. Mercer TR, Edwards SL, Clark MB, Neph SJ, Wang H, Stergachis AB, John S, Sandstrom R, Li G, Sandhu KS, Ruan Y, Nielsen LK, Mattick JS,
Stamatoyannopoulos JA:DNase I-hypersensitive exons colocalize with promoters and distal regulatory elements.Nat Genet2013,45:852–859. 33. Yoshida T, Landhuis E, Dose M, Hazan I, Zhang J, Naito T, Jackson AF, Wu J,
Perotti EA, Kaufmann C, Gounari F, Morgan BA, Georgopoulos K: Transcriptional regulation of the Ikzf1 locus.Blood2013,122:3149–3159. 34. Pandiyan K, You JS, Yang X, Dai C, Zhou XJ, Baylin SB, Jones PA, Liang G:
Functional DNA demethylation is accompanied by chromatin accessibility.Nucleic Acids Res2013,41:3973–3985.
35. Liu Y, Siegmund KD, Laird PW, Berman BP:Bis-SNP: Combined DNA methylation and SNP calling for Bisulfite-seq data.Genome Biol2012,13:R61. 36. O’geen H, Nicolet CM, Blahnik K, Green R, Farnham PJ:Comparison
of sample preparation methods for ChIP-chip assays.Biotech2006, 41:577–580.
37. Blahnik KR, Dou L, O’geen H, McPhillips T, Xu X, Cao AR, Iyengar S, Nicolet CM, Ludäscher B, Korf I, Farnham PJ:Sole-Search: an integrated analysis program for peak detection and functional annotation using ChIP-seq data.Nucleic Acids Res2010,38:e13.
38. Blahnik KR, Dou L, Echipare L, Iyengar S, O’geen H, Sanchez E, Zhao Y, Marra MA, Hirst M, Costello JF, Korf I, Farnham PJ:Characterization of the contradictory chromatin signatures at the 3′exons of zinc finger genes.
PLoS One2011,6:e17121.
39. Heinz S, Benner C, Spann N, Bertolino E, Lin YC, Laslo P, Cheng JX, Murre C, Singh H, Glass CK:Simple combinations of lineage-determining transcription factors prime cis-regulatory elements required for macrophage and B cell identities.Mol Cell2010,38:576–589.
40. McLean CY, Bristor D, Hiller M, Clarke SL, Schaar BT, Lowe CB, Wenger AM, Bejerano G:GREAT improves functional interpretation of cis-regulatory regions.Nat Biotechnol2010,28:1630–1639.
41. Kim D, Pertea G, Trapnell C, Pimentel H, Kelley R, Salzberg SL:TopHat2: accurate alignment of transcriptomes in the presence of insertions, deletions and gene fusions.Genome Biol2013,14:R36.
42. Robinson MD, Oshlack A:A scaling normalization method for differential expression analysis of RNA-seq data.Genome Biol2010,11:R25.
doi:10.1186/s13059-014-0469-0