5
IV
April 2017
©IJRASET: All Rights are Reserved
1536
PSO Algorithm based Loss Minimization Approach
for Optimal Placement and Sizing of Renewable
Energy Source
Pardeep Kaur1, Dr. Sudhir Sharma2, Mrs. Chintu Rza3 1
M.Tech student, 2H.O.D & Associate Professor, 3Associate Professor EEE Dept, D.A.V.I.E.T, P.T.U Jalandhar, Punjab
Abstract: In this research paper, PSO is joint with Newton Raphson method of power flow to optimize optimal location along with size of renewable energy source. A NR method is used to measure the losses and find the voltage at each bus. The PSO is used to locate the best location as well as sizing of renewable energy source. The main aim is to reduce the losses and keep the voltage profile acceptable. IEEE 30 bus standard system is used for the observations. There is the comparison of results of system without renewable energy source and with renewable energy source by some methods of optimization. Wind farm is considered as the renewable energy source.
Keywords: PSO, Newton Raphson power flow,losses reduction,voltage profile, intermittent energy sources
I. INTRODUCTION
Setting up of renewable energy resources in power system arrangement can gives the better impacts like voltage profile improvement and reduction in losses[1].Renewable energy sources usage is increasing day by day fastly, due to its number of benefits like small size, few environmental causes, less cost[2].These non-conventional energy resources like wind, hydro, biomass, solar, ocean and geothermal energy are naturally spread in all over the world[3].Reducing the power system loss, minimizing the variation in voltage and infraction the limits of power flow are the main objectives of the optimal sizing and placement of renewable energy sources[4]. Also, these sources are intermittent in nature i.e there is variability present in some of the sources [5]. Therefore to overcome this problem, optimization techniques are used for optimal allocation of these sources[6].In this research paper, PSO technique advanced method is used for optimization to reduce the system losses and improve the profile of voltage with Newton Raphson power flow method. PSO is the basic technique inspired by the flocking and schooling patterns of birds and fishes. It is very simple algorithm. It can be used to find the best position and rating of any variable energy source by the iteration procedure [7] In this research paper, wind is considered as renewable energy source, supposed to be an active power source. In this present work we make an effort, to find out the optimal sizing and placement of a wind energy source in an IEEE thirty test system bus by using the PSO technique which is combined with the Newton Raphson power flow method. With this motive, the whole work is divided as following, introduction, methodology with Newton Raphson method, Particle swarm optimization method with its flowchart. Then there is model of flow of power with wind energy is discussed and in the end diverse grades of simulation get achieved as well as examined. Further, the result gets compared with the outcome of Artificial Bee Colony (ABC) technique and seems to be cheering.
II. METHODOLOGY
In this research paper, PSO gets joint with Newton Raphson technique to discover best rating with location of renewable energy resources in large scale system[8]. The bus data and line data had altered with the cause of renewable energy sources. While renewable energy sources linked with a bus and the bus will supposed to be a generator bus [9]. Newton raphson method of power flow in some pattern volume is available [10].
A. Newton Raphson Method
Technology (IJRASET)
©IJRASET: All Rights are Reserved
1537
1) Inserted Power: At bus ‘i’ the power is:
Si*=Vi* YirVr (1)
The restructured variables following r th iteration and represent as:
Δδi(r+1)= Δδi(r)+ Δδi (2)
|Vi|(r+1) = |Vi|(r)+Δ|Vi| (3)
2) Flow of Power in Lines: The flow of power starting from i th bus to j th bus during line which is connected in middle of these buses and is given by:[12]
Sij = ViIi*j = Vi (vi-vj/ zij +ViYij0) (4)
Also, the flow of power from the j th bus to i th bus is:
Sji = VjIj*i = Vi(vj-vi/ zji +VjYji0) (5)
3) Line Losses:
Pi = (Sij +Sji) (6)
Pi = {(Pij +jQij) +(Pji+jQji)} (7)
B. Particle Swarm Optimization Algorithm
Kennedy and Eberhart give a intelligent method PSO related with similarity between birds swarm and school of fish. Each entity exchanges its preceding knowledge with others [13]. This optimizing implementation of PSO offers a search which is based upon the population having the particles known as individuals [14]. These individuals modify the location in which individuals called particles modify their location instantly. Particles fly about with multiple dimension search area in PSO. Throughout flight each particle adjust its location on basis of its own knowledge .This information of the adjacent particles, building the utilization of the most excellent location come across with itself also with the nearby particles.
With the multi-dimensional area wherever only optimum answer be wanted, every element within the group is motivated toward a optimum purpose by accumulation of a speed with its location. This speed of a constituent part is inclined by 3 elements these are, inertial, social plus cognitive [15].The inertial element replicates the inertial behaviour of the fowl to flutter in the earlier track. The cognitive element replicate the remembrance of the fowl of its earlier most excellent location, and the common element replicates the remembrance of the fowl regarding the finest location between particles. These elements move around the multi-dimensional search area till they find best location [16].Every particle has its personal best location called pbest and one location best from overall swarm is known as gbest. With the result of top values, the revised elements with its velocity and locations are given with these two equations (8) and (9).
(8) , i=1,2,...,n (9) d=1,2,...m
r = group of various particles; s =various particles members; t= various iterations;
ω = weighting factor of inertia;
c1,c2 = invariables of acceleration ;
rand (), Rand () = identical casual values with [0,1] range; at t iteration the velocity of ith particle,
= a t iteration the location of ith particle,
(10)
III. PROBLEMFORMULATION
The most important function of this proposed method is decrease the losses as in [20]
Min {Pl= Sij+Sji)} (11)
Voltage constraints: |Vimin|<=|Vi|<=|Vimax| (12)
©IJRASET: All Rights are Reserved
[image:4.612.149.462.77.479.2]1538
Fig 1. Flowchart for PSO
IV. WINDPOWER
The power of wind is modelled [21]as the inserted active power in the given bus system. The wind can produce mechanical power with the turbine in steady state conditions and it is given as:
(14)
In this equation ρ called density of air (kg/ms)
R gives the radius of blade of turbine (m) V gives the speed of wind (m/s)
Cp (ϴ ) gives efficiency in aerodynamics. It depends on angle of its pitch within its speed ( [23] The power of wind is also modelled to solve the problem of economic dispatch and it is given as [24]
(15) In equation (15), Pda gives the required command,
Pdt gives the demand of entire load and Pwind gives the response of wind energy.
V. RESULTS&DISCUSSION
Technology (IJRASET)
©IJRASET: All Rights are Reserved
1539
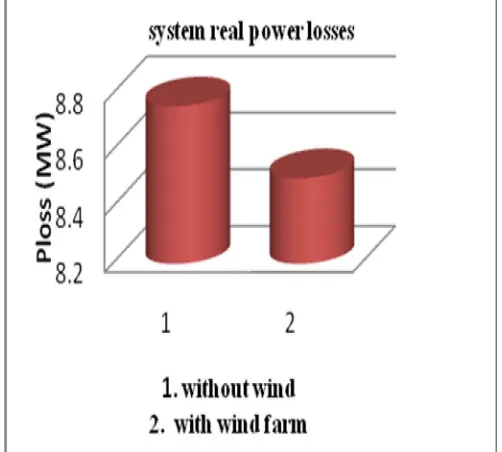
Case I: system without considering any renewable source.
Case II: system with wind farm installed at bus 10 with installed capacity between 1.5MW and 4.5MW. The results obtained are shown in the following tables and figures.
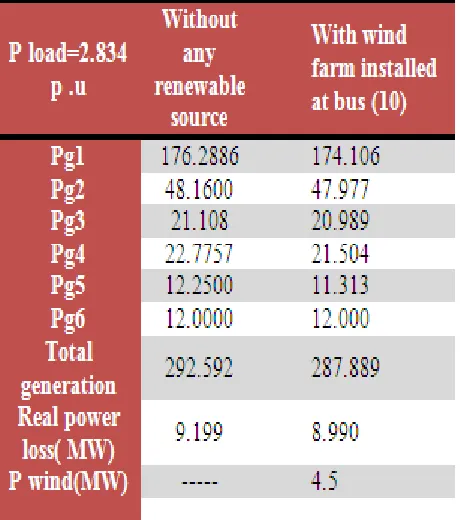
[image:5.612.191.420.182.370.2]In table 1, there are the calculated values of generation of power of different generating stations with renewable energy resource and without renewable energy resources. It also gives the best location and sizing of wind farm with minimum losses. The results are obtained with PSO technique.
TABLE 1
POWER GENERATION AND LOSSES WITH PSO
In fig. 2 there is the comparison of real power losses with and without any renewable energy resource. It shows the better results with less loss in the case with presence of wind farm. So the overall losses of system reduced by using wind in the system with PSO technique. In fig.3 there is the graph showing the results of voltage profile improvement. It shows the variation of voltage before compensation and after compensation with respect to the number of iterations. The results are obtained with PSO technique.
[image:5.612.181.432.445.671.2]©IJRASET: All Rights are Reserved
1540
Fig 3. Voltage before and after compensation
Technology (IJRASET)
[image:7.612.186.424.104.340.2]©IJRASET: All Rights are Reserved
1541
Fig 5. Iterations vs object position
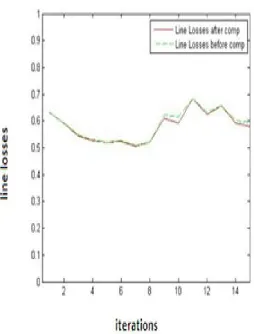
[image:7.612.195.425.454.714.2]In fig. 4 there is the graph showing the result of line losses of system before compensation and after compensation. It shows less loss after the compensation. It gives the overall losses of line with respect to number of iterations. In fig. 5 there is graph showing the variation of different objects with respect to the number of iterations. It gives the position of objects with different corresponding iterations. These above results also obtained with PSO technique.
TABLE 2
©IJRASET: All Rights are Reserved
1542
Fig 6 Entire real power losses with wind and with no wind by using ABC
In the above given table 2, there is the calculated values of generation of power of different generating stations with renewable energy resource and without renewable energy resources. It also gives the best location and sizing of wind farm with minimum losses. The results are obtained with ABC technique. In fig. 6 there is the comparison of real power losses with and without any renewable energy resource. It shows the better results with less loss in the case with presence of wind farm. So the overall losses of system reduced by using wind in the system with ABC technique.
TABLE 3
[image:8.612.191.432.420.708.2]Technology (IJRASET)
©IJRASET: All Rights are Reserved
1543
Fig 7 Total real power losses with PSO and ABC for 30 system bus
In table 3 there are the results of comparison of both methods PSO and ABC. It gives the comparison of total power generation of system and real power losses. It discussed the two cases with and without renewable energy resource. It also showing the best location and sizing of wind farm with both the cases. The losses are less with the applied technique PSO. In fig. 7 there are the results of total real power losses with both techniques PSO and ABC for thirty test bus system. It basically shows the comparison of two techniques with and without wind farm. When there is no wind then it shows the more4 losses as compare to the case when it has the wind in the system to reduce the losses and improve the voltage profile of the system.
VI. CONCLUSION
In this paper the IEEE 30 bus system is used to solve the diverse working situations of system with consideration; earlier we considered the case with no using wind source as well as with wind source infiltration in the IEEE thirty test system bus. It can lessen the overall real losses of power efficiently; improve the voltage profile of system. PSO technique is applied amongst another heuristic algorithm to perform computation functions due to certain along with quick convergence, a smaller time of computations and simple utilization method.
REFERENCES
[1] S.A Hosseini,S.H.H. Sadeghi “Optimal placement and sizing of distributed generation sources considering network parameters and protection issues”IEEE201
[2] N.K Aryani,M.Abdillah “Optimal placement and sizing of distributed generation using quantum genetic algorithm for reducing losses and improving voltage
profile”, IEEE 201
[3] K.Nadhir,D.Chabene “Firefly algorithm energy loss minimization approach for optimal sizing &placement of distributed genetration”,IEEE201
[4] ]C.Yammani,M.sydulu “Optimal placement and sizing of DGs at various load conditions using Shuffled Bat algorithm”,IEEE201
[5] C.Yammani,M.sydulu “Optimal placement and sizing of DER in distribution systems using Shuffled Frog Leap algorithm”, IEEE201
[6] ] H.Sebaa,T.Bouktir “optimal sizing and placement of renewable energy source in large scale power system using ABC technique in presence of UPFC”,
IEEE2014
[7] N. Phuangpornpitaka, S.Tia, "Opportunities and Challenges of Integrating Renewable Energy in Smart Grid System", Energy Procedia 34, pp.282-290, 2013
[8] T.R. Ayodele, AA Jimoh, J. L Munda, J.T Agee, " Challenges of Grid Integration of Wind Power on Power System Grid Integrity: A Review", International
Journal of Renewable Energy research, Vol.2, No.4, 2012
[9] Elaine K. Hart, Eric D. Stoutenburg, and Mark Z. Jacobson ," The Potential of Intermittent Renewable to Meet Electric Power Demand: Current Methods and
Emerging Analytical Techniques ", Department of Civil and Environmental Engineering, Stanford University. Vol. No. 2, Feb. 2012
[10] Frank kreith, Y Goswami, "Handbook of energy efficiently and renewable energy", Tylor and Francis group, 2007
[11] L.Wang and C. Singh, "A New Method for Capacity Credit Estimation of Wind Power ", Fifteenth National Power Systems Conference (NPSC), TIT Bombay,
Dec. 2008
[12] D.Karaboga and B. Basturk, " Artificial Bee Colony (ABC) optimization Algorithm for Solving Constrained Optimization problems", IFSA 2007, LNAI 4529,
pp. 789-79
[13] M. A. Kashem, A. D. T. Le, M. Negnevitsky, G. Ledwich, “Distributed Generation for Minimization of Power Losses in Distribution Systems,” IEEE Power
©IJRASET: All Rights are Reserved
1544
331-334, 21-24 Nov., 2004
[15] B. A. de Souza, J. M. C. de Albuquerque, “Optimal Placement of Distributed Generators Networks Using Evolutionary Programming,” Transmission &
Distribution Conference and Exposition: Latin America, pp. 1-6, 2006
[16] N. Acharya, P. Mahat, N. Mithulananthan, “An Analytical Approach for DG Allocation in Primary Distribution Network,” Electric Power Systems Research,
vol. 28, Issue 10, pp. 669-678, Dec. 2006
[17] S. L. Payyala and T. C. Green, “Sizing of distributed generation plant through techno-economic feasibility assessment,” in Proc. IEEE PES Conf., Montreal,
QC, Canada, 2006, p. 8.
[18] S. L. Payyala and T. C. Green, “An estimation of economic benefit values of DG,” in Proc. IEEE Power Eng. Soc. Conf., Tampa, FL, USA, 2007, pp. 1–8.
[19] A. D. T. Le, M. A. Kashem, M. Negnevitsky, and G. Ledwich, “Optimal distributed generation parameters for reducing losses with economic consideration,” in
Proc. IEEE Power Eng. Soc. Conf., Tampa, FL, USA, 2007,pp. 1–8
[20] B. Kuri, M. Redfern, and F. Li, “Optimization of rating and positioning of dispersed generation with minimum network disruption,” in Proc. IEEE Power Eng.
Soc. Gen. Meet., Denver, CO, USA, 2004, pp. 2074–2078
[21] N. Chopra and S. Mehta, "Multi-objective optimum generation scheduling using Ant Lion Optimization," 2015 Annual IEEE India Conference (INDICON),
New Delhi, 2015, pp. 1-6.doi: 10.1109/INDICON.2015.744383
[22] Linda SLTMANI, Tarek BOUKTTR, "Economic power dispatch of power systems with pollution control using artificial bee colony optimization", Turkish
Journal of Electrical Engineering & Computer Sciences, pp. 15 15- 1527, Department of Electrical Engineering, University of Setif; march 20 12 Algeria
[23] C.R. Fuerte-Esquivel, E. Acha, and H. Ambriz- Perez, "A Comprehensive Newton-Raphson UPFC Model for the Quadratic Power Flow Solution of Practical
Power networks", IEEE Trans. Power System, v01. 15, No. 1, Feb 2000
[24] F.R. Pazheri, M.F. Othman, N. H. Malik and AA Al-Arainy, "Optimization of Pollution Emission in Power Dispatch including Renewable Energy and Energy