Multicenter Evaluation of Two Next-Generation HIV-1
Quantitation Assays, Aptima Quant Dx and Cobas 6800, in
Comparison to the RealTi
m
e HIV-1 Reference Assay
Frank Wiesmann,aRobert Ehret,bGudrun Naeth,aMartin Däumer,gJörg Fuhrmann,cRolf Kaiser,dChristian Noah,i Martin Obermeier,bGunnar Schalasta,fCarsten Tiemann,eEva Wolf,hHeribert Knechten,aPatrick Brauna
aPZB Aachen, Medical Center for Infectious Diseases, Aachen, Germany
bMVZmib AG, Medical Center for Infectious Diseases, Berlin, Germany
cLabor 28, Berlin, Germany
dUniversity of Cologne, Institute of Virology, Cologne, Germany
eLabor Krone, Laboratory for Medical Diagnostics, Bad Salzuflen, Germany
fLabor Enders, Laboratory for Medical Diagnostics, Stuttgart, Germany
gIIG-Institute of Immunology and Genetics, Kaiserslautern, Germany
hMUC Research, Munich, Germany
iMVZ Labor Lademannbogen, Hamburg, Germany
ABSTRACT High accuracy and precision at the lower end of quantification are
cru-cial requirements of a modern HIV viral load (VL) assay, since some clinically relevant thresholds are located at 50 and 200 copies/ml. In this study, we compared the per-formance of two new fully automated HIV-1 VL assays, Aptima HIV-1 Quant Dx and Cobas HIV-1 (Cobas 6800), with the established RealTimem2000 assay. Assay preci-sion and accuracy were evaluated in a retrospective evaluation out of excess plasma material from four HIV-1⫹individuals (subtypes B, C, CRF01_AE, and CRF02_AG). Na-tive plasma samples were diluted to nominal concentrations at 50 and 200 cop-ies/ml (according to the RealTimem2000 assay). All dilutions were tested in triplicate in five independent runs over 5 days and in three labs per system. Assay concor-dance was determined using 1,011 surplus clinical routine samples, as well as se-lected retrospective longitudinal samples from 7 patients on treatment. The three assays yielded highly concordant results for individual clinical samples (R2 ⬎ 0.98;
average difference,ⱕ0.2 log copies/ml) and retrospective longitudinal samples from patients on treatment. The Aptima and RealTime assays showed similar high preci-sion, meeting the 5 criterion for the majority of samples across all labs and sub-types. The Cobas assay was less precise, missing the 5criterion for the majority of samples at low concentrations. In this analysis, results from the Cobas assay ap-peared less reliable near the clinically relevant cutoff and should be interpreted with more caution in this context. Due to high precision, full automation, and high con-cordance with the RealTime assay, the Aptima assay represents a good alternative in routine VL monitoring.
KEYWORDS Abbott, Aptima, Cobas 6800, HIV, Hologic, RNA, RealTime, Roche, viral
load, viral load monitoring
T
he primary surrogate marker for the prediction of therapy success is the quantita-tion of HIV-1 RNA, or viral load (VL), in a patient’s plasma (1–4). VL should be measured in all HIV-1-infected patients at entry into care, at initiation of therapy, and on a regular basis thereafter. Therapeutic success has been defined as the suppression of VL to⬍50 copies/ml both in clinical trials and in clinical routine (1–4). Nevertheless, due to a constant virus release out of the proviral CD4 T-cell reservoir, some treatedReceived7 March 2018Returned for modification23 April 2018Accepted23 June 2018
Accepted manuscript posted online1 August 2018
CitationWiesmann F, Ehret R, Naeth G, Däumer M, Fuhrmann J, Kaiser R, Noah C, Obermeier M, Schalasta G, Tiemann C, Wolf E, Knechten H, Braun P. 2018. Multicenter evaluation of two next-generation HIV-1 quantitation assays, Aptima Quant Dx and Cobas 6800, in comparison to the RealTime HIV-1 reference assay. J Clin Microbiol 56:e00292-18.https://doi.org/10.1128/ JCM.00292-18.
EditorAngela M. Caliendo, Rhode Island Hospital
Copyright© 2018 Wiesmann et al. This is an open-access article distributed under the terms of theCreative Commons Attribution 4.0 International license.
Address correspondence to Frank Wiesmann, [email protected].
crossm
on May 16, 2020 by guest
http://jcm.asm.org/
patients still have detectable low-level plasma viremia above 50 copies/ml but below 200 copies/ml. Despite a well-functioning therapy in terms of improved immune parameters and the absence of disease progression and treatment adverse effects, as well as a low risk of emerging resistance, this release takes place (5). Thus, current therapy guidelines for HIV-1 have defined virologic failure as a VL repeatedly exceeding 200 copies/ml (2), which indicates that the current treatment has failed and needs to be reevaluated and probably substituted by an alternate treatment. Patients with VLs of 50 to 200 copies/ml, however, may continue with the same treatment and have their VL monitored more frequently (at least every 3 months) (2). There is no consensus on how to manage patients in this range. The risk of emerging resistance is thought to be low. It is suggested to confirm that levels remain above the lower limit of detection (LLOD) and to assess adherence and possible drug-drug or drug-food interactions.
A sudden rise in VL above the 200 copies/ml threshold may indicate an acute change in the patient’s status (e.g., virologic failure) or may just be a viral “blip,” an isolated detectable VL observed after virologic suppression and subsequently followed by a return to virologic suppression or unconfirmed upon repeat testing (2). Blips are not associated with an increase in treatment failure and are generally considered artifacts due to random assay variation rather than clinically significant elevations in viremia (6, 7).
Thus, identification and confirmation of true HIV-1 virologic failure are critical for patient management, as patients typically visit physicians only twice per year in the United States or United Kingdom (4 times in Germany). Imprecision in a test result at low VLs (around the 50 and 200 copies/ml cutoffs) could have important medical implications, such as a patient remaining on a failing therapy, possibly leading to resistance, disease progression, and potential increase of transmission. Consequently, current HIV-1 VL assay systems need to deliver precise, reproducible, specific, and sensitive results, particularly around the clinical relevant benchmarks (50 and 200 copies/ml). Because patient management decisions rely entirely on each test result, the reliability of the HIV VL assay used in the clinical laboratory should be assessed and confirmed through objective rigorous modern analysis methods, such as the sigma metrics (8). The Greek letter sigma is used to represent standard deviations and to show how wide the distribution of values spans. Samples with a high standard deviation are more spread out and show more variability, while samples with a low standard deviation cluster more tightly around the corresponding mean. In quality control processes, it is important to know how many values (standard deviations) fit into a certain defined acceptable range (total analytical error). Therefore, it is recommended that laboratories estimate the total analytical error by combining the estimate of bias from a method comparison study and the estimate of precision from a replication study. Accordingly, we used a multiple of the standard deviation (SD) or coefficient of variation (CV) and total analytical error/bias for a 95% confidence interval, as recently published (8).
Currently, the most widely used HIV RNA quantitation assays in Germany are the Abbottm2000 RealTime HIV-1 (here, RealTime) and the Roche Cobas AmpliPrep/Cobas TaqMan HIV-1 v2 (here, CAP/CTM) assays, with lower limits of quantitation (LLOQs) of 40 and 20 copies/ml, respectively. The recent Hologic Aptima HIV-1 Quant Dx (here, Aptima) assay and the new Roche Cobas HIV-1 assay for use in the 6800/8800 systems (here, Cobas 6800/8800) are new adapted VL assays for the quantitation of HIV-1 on fully automated instrument platforms offering random access and LLOQs of 30 and 20 copies/ml, respectively. All comparative studies published to date have demonstrated that the Aptima assay is highly sensitive, precise, accurate, and highly concordant with other assays (9–19). Although there are currently no publications assessing the perfor-mance of the Cobas 6800/8800 HIV assay, two publications on the Cobas 6800/8800 system for human hepatitis C virus (HCV) VL determination have reported good analytical performance (20) and good correlation with the CAP/CTM v2 assay (21).
This systematic and comprehensive study had three aims. First, we compared the precision of the three assays around the clinically relevant cutoffs of 50 and 200
on May 16, 2020 by guest
http://jcm.asm.org/
copies/ml in a multicenter approach using clinical samples from patients infected with the four most prevalent HIV-1 subtypes worldwide. A sigma metrics analysis was used to provide an objective evaluation of the assays’ reliability. Second, we compared the results from the three assays in serial retrospective blood samples from patients receiving antiretroviral therapy over time. Third, we compared VL quantitation results from the Aptima, RealTime, and Cobas 6800 assays in a large number of prospective fresh clinical samples from HIV-infected patients.
MATERIALS AND METHODS
HIV-1 VL assays.The Hologic Aptima HIV-1 Quant Dx assay was used on the fully automated Panther system (Hologic, Inc., San Diego, CA). The assay targets the polymerase (pol) and long terminal repeat (LTR) regions. The assay has a minimal required sample volume of 0.7 ml of specimen (0.5 ml plus 0.2 ml of dead volume) and reports quantitative HIV-1 results in a range of 30 to 10,000,000 copies/ml (22).
The Roche Cobas HIV-1 assay was performed on the fully automated 6800 system (Roche Molecular Diagnostics, Pleasanton, CA). The assay targets thegaggene and LTR region (dual target). The assay requires at least 0.655 ml of specimen (0.5 ml plus 0.15 ml of dead volume) and reports quantifiable HIV-1 results between 20 and 10,000,000 copies/ml (23).
The Abbott RealTime HIV-1 Quant Dx assay was used on the automatedm2000 system (Abbott Molecular, Inc., Des Plaines, IL). The assay targets thepolintegrase region (single target). The assay is designed to use 0.2, 0.5, 0.6 (used in this study), or 1.0 ml of specimen and reports quantifiable HIV-1 results over the range of 40 to 10,000,000 copies/ml (24).
All three assay manufacturers report 100% specificity in the respective package inserts.All laboratories used the same sample loading volume specified in the package insert when the same assay was tested at different sites and with different sample handling methods. Assays were performed in accordance to the instructions by trained technicians who had demonstrated proficiency. For laborato-ries using the newly introduced Aptima assay, at least one Panther operator per site was required to demonstrate assay proficiency prior to the study initiation. The proficiency evaluation involved testing Hologic panels, including a dedicated HIV proficiency panel.
Assay precision analysis for different subtypes at low viremia in a multicentric approach. (i) Evaluation of assay precision. Four clinical samples covering HIV-1 subtypes B, C, CRF01_AE, and CRF02_AG (1 sample each) were pretested with the RealTime assay and diluted in BaseMatrix to the nominal concentrations of 50 copies/ml and 200 copies/ml to test for subtype-specific assay precision at the lower end of quantitation. In order to minimize operator-related errors, triplicates of each dilution were tested in 5 independent runs with the Aptima, RealTime, and Cobas 6800 assays in nine labora-tories, with 3 laboratories testing each assay. The same lot numbers were used for quantification processes as well as the same software versions on all systems used to minimize systematic errors. The three Aptima testing centers were PZB Aachen, Lab Enders, Stuttgart, and MIB, Berlin; the three RealTime testing centers were PZB Aachen, Labcon-OWL Analytik, Bad Salzuflen, and Institut für Immunologie und Genetik, Kaiserslautern; the three Cobas 6800 testing centers were Institut für Virologie, Koeln, MUC Research GmbH/MVZ Karlsplatz, Munich, and Labor Lademannbogen, Hamburg (all laboratories are in Germany). Samples were prepared in one laboratory (Aachen) and distributed frozen on dry ice to the testing laboratories. Each laboratory used an identical sample volume and identical sample handling in the testing process. The average assay values and 95% confidence interval (CI) were plotted by assay, subtype, and dilution to determine assay precision.
(ii) RoU analysis.An additional statistical analysis was conducted to evaluate the range of uncer-tainty (RoU) based on the precision and mean difference in assay values compared with the RealTime results. Calculations for the lower limit (equation 1) and upper limit (equation 2) of the RoU were derived from two one-sided confidence limit calculations approaching the clinical decision point from the lower or higher VL, as previously described (25):
RLLow⫽
COA
1⫹
冉
z⫻CV%冑n
冊
(1)
RLUp⫽
COA
1⫹
冉
CV%冑n
冊
(2)
where RL is the limit of the range of uncertainty, COAis the assay-specific equivalent of the clinical cutoff in the reference assay, CV% is the assay-specific coefficient of variation at the respective cutoff level, and nis the number of replicates. Calculations were assuming a 95% confidence level, resulting in azvalue of 1.645.
(iii) Sigma analysis.A sigma analysis of imprecision was also conducted, as described by Westgard and Lucic (8), for quality controls in which the sigma metric is calculated using the following equation: sigma metric⫽(TEa⫺bias)/%CV, where TEa is the allowable total error and CV is the coefficient of variation. The %CV values were calculated from nonlogarithmic values. The sigma metric was used to determine how likely it would be to identify a real change in the VL within the range of 50 to 200 copies/ml that represents the two clinically relevant thresholds (2). The sigma metric was graphed as a method decision chart that plots the %bias (using the assay-specific cutoff equivalent) versus the %CV.
on May 16, 2020 by guest
http://jcm.asm.org/
Statistical analysis was conducted by using SPSS version 21.0, Graph Pad Prism 5.0, and MedCalc version 17.4.4.
Assay comparison in retrospective clinical samples at different time points during antiretro-viral therapy.In a retrospective evaluation, samples from 7 individual patients undergoing antiretroviral therapy were reanalyzed anonymously with the Aptima, RealTime, and Cobas 6800 assays by using leftover EDTA-plasma samples. For each patient, undiluted samples from five serial/consecutive time points during antiretroviral treatment were analyzed. The patients were selected to represent the majority of HIV group M subtypes (A, B, C, CRF02_AG, and CRF01_AE), to cover the dynamic quantitation range (from 30 to 10,000,000 copies/ml), based on the initial VL monitoring values measured with the RealTime assay, and to reflect different key steps and time points in the course of antiretroviral therapy, such as baseline VL, viral breakthrough, low-level viremia, and successful suppression of VL below the limit of quantification. Each assay was performed by one laboratory, as follows: Aptima testing and RealTime testing were performed at the PZB Aachen, Aachen, Germany, and Cobas 6800 testing was performed at the Institute of Virology at the University of Cologne, Germany.
Assay comparison in fresh clinical samples.Fresh consecutive clinical routine samples (n⫽1,011) from HIV-1-infected patients seen for HIV-1 monitoring at the MIB Dienstleistung GmbH, Berlin, Germany, were tested fresh side by side with the routinely used RealTime assay and in parallel with the Aptima, RealTime, and Cobas 6800 assays during a period of 1 week (5 testing days). Plasma was obtained by centrifugation directly after arrival at the MIB laboratory. The only criterion for inclusion was sufficient plasma volume to test in all three assays. RealTime and Aptima testing was performed batch-wise at MIB, and Cobas 6800 testing was performed at Labor 28, Berlin. Samples were transported twice daily from MIB to Labor 28 in a frozen state to ensure real side-by-side comparison. All samples underwent the same freeze/thaw cycle and treatment conditions. The results were grouped in three categories, as follows: “not detected,” “detected⬍LLOQ,” and “quantitated” using the individual assays’ LLOQs (RealTime assay, 40 copies/ml; Aptima, 30 copies/ml; and Cobas 6800, 20 copies/ml). Assay results were also compared at the clinically defined cutoff of 50 copies/ml and at low VL (between 50 and 250 copies/ml) using Venn diagrams. Agreement between assays for the 50 copies/ml cutoff was determined using kappa statistics. The overall concordance of VL values for samples quantitated in all three assays was analyzed pairwise by Deming regression (with calculation of the correlation coefficientR) and by Bland-Altman analysis (with calculation of the mean difference and the 95% assay agreement).
RESULTS
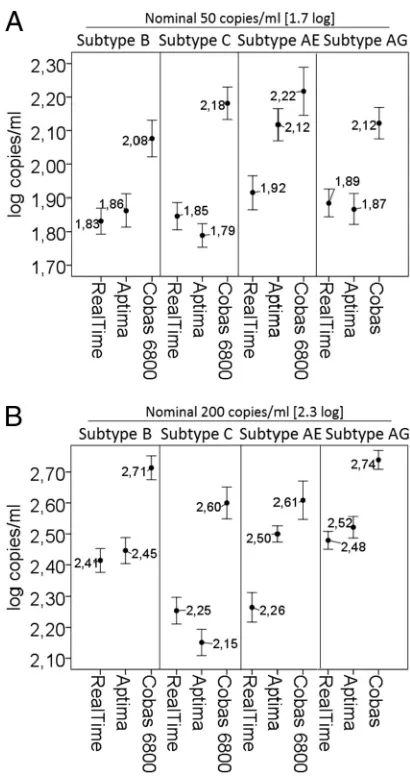
Assay accuracy and precision. The RealTime and Aptima assays both yielded results closest to the target values (within 0.13 and 0.20 log/copies/ml, respectively), while the Cobas 6800 assay was the least accurate, yielding results on average 0.41 log copies/ml from the target values (RealTime), with systematically higher confidence intervals (95%) across all subtypes (Fig. 1). For the 50 copies/ml replicates, the majority (ⱖ95%) of the samples would be expected to be located below the clinically relevant cutoff of 200 copies/ml for all three assays (Fig. 1a). For the replicates with 200 copies/ml, the Cobas 6800 assay systematically yielded values clearly above this cutoff, while the RealTime and Aptima assays yielded results both above and below the 200 copies/ml cutoff (Fig. 1b).
Of all three assays, the Cobas 6800 had the lowest precision for all subtypes and VL levels (50 and 200 copies/ml), as shown by the largest 95% CIs and coefficients of variation for the 45 replicates tested (Fig. 1).
In general, the best precision of all assays was achieved for subtypes B and CRF02_AG. At the critical 50 copies/ml threshold, the Aptima and RealTime assays performed equally well for these subtypes, with an SDⱕ0.15 log. At this level, a higher imprecision was observed with the Cobas 6800 assay and subtype CRF01_AE, with an SD of 0.23 log.
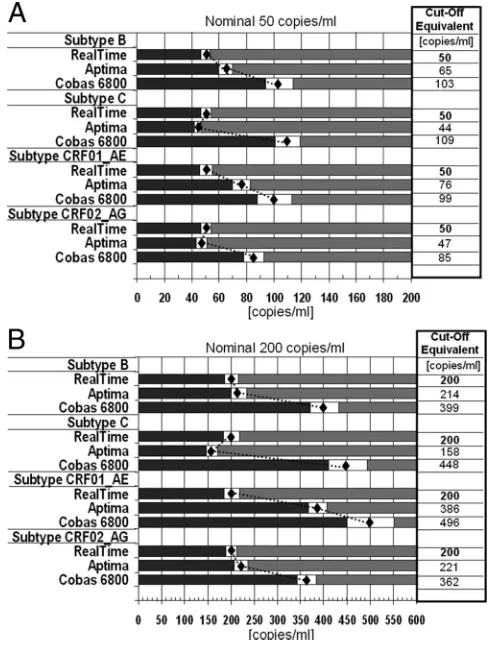
Analysis of range of uncertainty.RoU analysis confirmed these results. Of all three assays, the Cobas 6800 assay had the lowest precision for all subtypes tested and VL levels (50 and 200 copies/ml), as shown by the widest RoU and values much higher than those of the other two assays (Fig. 2). As an example, for subtype C replicates, a 100 copies/ml result in the Cobas 6800 assay would correspond to⬍50 copies/ml with the RealTime and Aptima assays inⱖ95% of the replicates. The Aptima results were in close agreement with the RealTime results for 3 out of the 4 subtypes tested (B, C, and CRF02_AG) (Fig. 2). The Aptima assay showed the highest precision (smallest RoU) with subtype C, while the RealTime assay showed highest precision with subtypes B, CRF01_AE, and CRF02_AG, with only slight differences from the Aptima assay for subtypes B and CRF02_AG (Fig. 2).
on May 16, 2020 by guest
http://jcm.asm.org/
Differences in results between laboratories. Significant interlaboratory differ-ences were observed with the RealTime assay for subtypes B, C, and CRF02_AG for the 200 copies/ml replicates and with the Cobas 6800 assay for subtypes C and CRF01_AE for all VLs tested (50 and 200 copies/ml), while none were observed for the Aptima assay (Table 1). In fact, we found that approximately half of the 50 copies/ml replicates of subtype CRF01_AE were quantitated above the cutoff of 200 copies/ml when tested with the Cobas 6800 assay in laboratory 3, while all samples were quantified below this cutoff when being tested in laboratory 2. A similar systematic error was observed for the subtype C results. In contrast, the majority of subtype replicates were quantified below 200 copies/ml with the Aptima and RealTime assays.
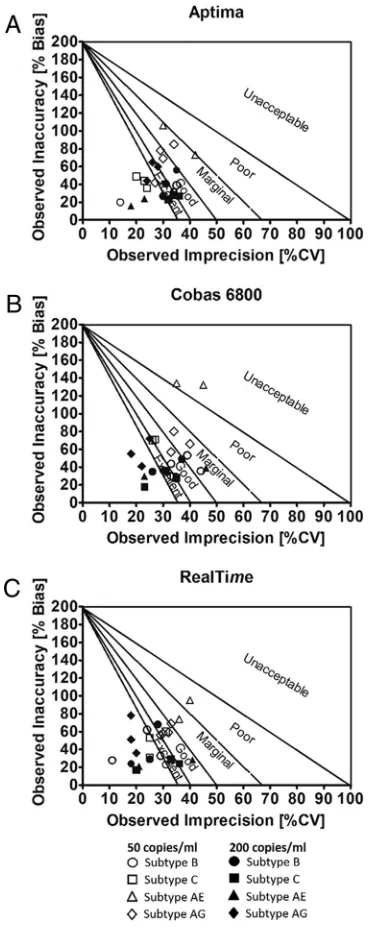
6analysis of imprecision.Aptima was the only assay exceeding the 3criterion for all subtypes at all VLs tested (50 and 200 copies/ml) (Fig. 3). The RealTime assay failed for subtype CRF01_AE replicates at 50 copies/ml. However, the majority of the Aptima and RealTime results exceeded the 5criterion for excellence. The majority of the Cobas 6800 results did not reach the 5 level, particularly for replicates at 50 copies/ml. Subtype CRF01_AE results failed to pass the 1criterion in this analysis.
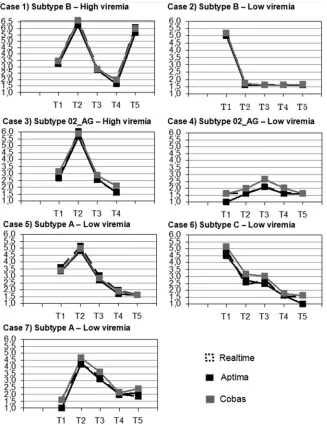
Longitudinal patient VL monitoring.Serial retrospective samples from 7 patients (two subtypes B, two CRF02_AG, one CRF01_AE, one A, and one C) receiving different courses of therapy showed an excellent agreement between all three assays across a FIG 1Assay accuracy and precision with various subtypes for replicates at 50 copies/ml (A) and 200 copies/ml (B). Whiskers plot with center dots represent the mean value (which is indicated in each box) and bars represent the 95% CI.
on May 16, 2020 by guest
http://jcm.asm.org/
[image:5.585.102.307.69.457.2]wide range of VLs, different HIV subtypes, and therapy regimens (Fig. 4). Generally, the Aptima results tended to be close to the RealTime values, with both assays slightly below the corresponding Cobas 6800 values. The lowest average difference was observed between the Aptima and RealTime (0.13 log copies/ml) results. There was a trend for the Cobas 6800 assay to return slightly higher values across the time course and more noticeably at low viral loads, except for subtype A. The average values for the FIG 2RoU for replicates at 50 copies/ml (A) and 200 copies/ml (B) in relation to the RealTime assay (reference). Gray bars represent areas ofⱖ95% confidence that do not cross the decision threshold of 50 or 200 copies/ml for the reference assay (RealTime). Diamonds represent the assay-specific values corresponding to the reference assay threshold value. White bars around the diamond represent the RoU of each assay’s results. COa, assay-specific equivalent of the clinical cutoff in the reference assay (Abbott m2000 RealTime).
TABLE 1Test for significant differences between results obtained from the three different participating laboratories
Subtype
Nominal concn (copies/ml)a
ANOVAPvalue by assayb
RealTime Aptima Cobas 6800
B 50 0.014 0.750 0.218
200 0.005 0.517 0.357
C 50 0.113 0.580 <0.001
200 0.003 0.581 <0.001
CRF01_AE 50 0.351 0.226 <0.001
200 0.041 0.015 <0.001
CRF02_AG 50 0.726 0.103 0.462
200 <0.001 0.404 0.082
aDetermined bym2000 RealTime HIV-1 assay.
bValues indicated in bold are statistically significant at aPvalue of⬍0.01. ANOVA, analysis of variance.
on May 16, 2020 by guest
http://jcm.asm.org/
[image:6.585.41.371.588.721.2]Cobas 6800 assay were 0.17 and 0.30 log10copies/ml higher than those for the Aptima
and RealTime assays, respectively.
Concordance of clinical sample results in the three assays.(i) Concordance of qualitative results. A total of 1,011 fresh clinical leftover samples were analyzed side by side in the three assays. Concordance between the three assays for characterizing the samples’ VLs as detected, detectedⱕLLOQ, or quantitated differed depending on the cutoff chosen. Using the system-specific cutoffs, nearly twice as many quantitated results were reported with the Cobas 6800 assay than with the Aptima and RealTime assays (234 versus 140 and 136 samples, respectively; Table 2). Not detected results FIG 3Sigma precision analysis for all laboratories and all assays. Plots were performed according to Westgard and Lucic (8) for each participating laboratory, subtype, and dilution. Diagonal lines on the chart represent different sigma zones, from world-class-quality performance (more than 6) near the graph’s origin, to excellent performance (5), good performance (4), etc., with the upper right quadrant of the graph representing less than 2performance, which is considered unacceptable, unstable, and unreliable. Each symbol corresponds to one subtype measured in three different labs. The open symbols represent 50 copies/ml, and the filled symbols represent 200 copies/ml.
on May 16, 2020 by guest
http://jcm.asm.org/
[image:7.585.114.299.71.537.2]were highest with the RealTime assay (712 samples) and comparably lower with the Aptima (512 samples) and Cobas 6800 (506 samples) assays, respectively (Table 2), indicating a higher clinical sensitivity of the Aptima and Cobas 6800 assays.
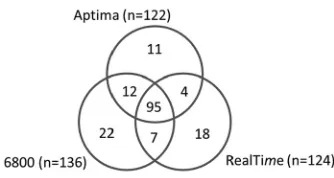
[image:8.585.44.371.71.496.2]Using the clinically established cutoff of 50 copies/ml as a benchmark reduced the differences between the assay results, with 122 (12.1%), 136 (13.5%), and 124 (12.3%) samples yielding quantitated results beyond 50 copies/ml with the Aptima, Cobas 6800, and RealTime assays, respectively (Table 3); in that case, the Cobas assay quantitated FIG 4Longitudinal HIV-1 RNA monitoring in 7 patients (2 subtypes B, 5 non-B). T1 to T5 represent 5 different consecutive time points, with corresponding logarithmic viral loads on theyaxis. Black, Aptima results; dashed lines, RealTime results; gray, Cobas 6800 results.
TABLE 2Characterization of sample detection by each assay
Assay result
No. of samples by assay (nⴝ1,011)a
RealTime Aptima Cobas 6800
Not detected 712 512 506
Detected⬍LLOQ 163 359 271
Quantitated 136 140 234
aLLOQ, lower limit of quantitation (RealTime, 40 copies/ml; Aptima, 30 copies/ml; Cobas 6800, 20 copies/ml).
on May 16, 2020 by guest
http://jcm.asm.org/
[image:8.585.41.373.670.730.2]⬃10 to 12% more samples at⬎50 copies/ml than the other two assays. Of the samples quantitated atⱖ50 copies/ml by each assay (122 samples with Aptima, 136 samples with Cobas 6800, and 124 samples with RealTime assays; Table 2), the Aptima assay showed the lowest number of results of⬎50 copies/ml not confirmed by any of the comparator assays (12), followed by the RealTime (19) and then Cobas 6800 (26) assays (Fig. 5). The overall agreement between assays for the quantitation of samples at the threshold of 50 copies/ml was high, as demonstrated by a kappa factor of 0.80 for the Aptima/Cobas 6800 comparison, 0.78 for the Aptima/RealTime comparison, and 0.75 for the RealTime/Cobas 6800 comparison, indicating almost perfect agreement in all cases. Overall, 58, 72, and 65 samples were quantitated between 50 and 250 copies/ml by the Aptima, Cobas 6800, and RealTime assays, respectively. Thirty-nine samples were quantitated between 50 and 250 copies/ml by Aptima and Cobas 6800, 37 by Cobas 6800 and RealTime, 34 by Aptima and RealTime, and 26 by all three assays. The Aptima assay demonstrated the highest clinical sensitivity together with Roche and at the same time the lowest number of ⬎50 copies/ml results not confirmed by any of the two comparator assays.
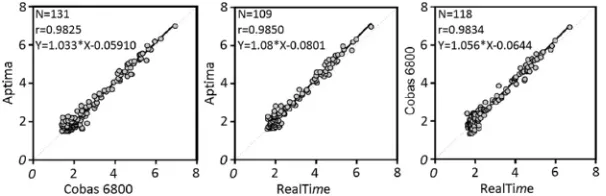
(ii) Correlation of quantitative values.In Deming regression analyses comparing the assays’ VL values in a pairwise fashion, all comparisons led toRvalues above 0.98 (Fig. 6). Bland-Altman analyses showed that the average differences between paired assay results were all under 0.2 log copies/ml (Cobas 6800-Aptima ⫽ 0.038 log copies/ml; Cobas 6800-RealTime⫽0.103 log copies/ml; Aptima-RealTime⫽0.168 log copies/ml) and that ⬎92% of the observed values were within the 95% confidence limits of agreements between the assays in all comparisons (data not shown).
DISCUSSION
[image:9.585.40.371.83.143.2]Correct quantitation of HIV-1 VL around 50 copies/ml (virologic suppression thresh-olds are generally regarded as below the limit of quantitation of current assays, 20 to 40 copies/ml) and 200 copies/ml (virologic failure threshold according to recent guidelines) during therapy is critical for making an adequate treatment decision in the management of HIV-infected patients. Indeed, quantifiable results above 200 copies/ ml, which are suggestive of therapeutic failure or viral breakthrough, require repeat testing and, if confirmed, should prompt treatment modification. VL assays that have substantial variability around these cutoffs can yield false positives, which require repeat testing, or yield false negatives, masking true virologic failure, which leads to the patient remaining on an ineffective treatment. False positives have direct conse-quences on the patient’s health, as they increase the risks of drug resistance, virus TABLE 3Characterization of sample concentrations by each assay
Assay result
No. of samples by assay (nⴝ1,011)
RealTime Aptima Cobas 6800
Not detected 712 512 506
Detectedⱕ50 copies/ml 175 377 369
Quantitated⬎50 copies/ml 124 122 136
FIG 5Assay concordance for quantitating samples at ⱖ50 copies/ml. Venn diagram indicates the number of samples quantitated atⱖ50 copies/ml by one, two, or three of the assays. 6800, Cobas 6800.
on May 16, 2020 by guest
http://jcm.asm.org/
[image:9.585.122.289.628.717.2]transmission, and clinical progression. It has been reported that although about 90% of the first-line-treated patients show suppressed viral loads below the quantification limits, another 3 to 4% are likely to remain somewhere between this critical range of 50 to 500 copies/ml (as tested with the RealTime assay) (27). Approximately 4% to 8% of the total population that achieved an initial plasma viral load below 50 copies/ml in the studies subsequently developed persistent low-level viremia of⬍500 copies/ml (28). Therefore, we would estimate the relative impact of quantifiable results in daily routine and within this critical ⬍2.5-log range to be somewhere in the low-single-digit-percentage range. Thus, it is imperative that in order to be used for patient treatment monitoring, VL assays have great precision and accuracy (low noise level) at the low end of viral concentration (the 50 and 200 copies/ml cutoffs). Assays that can achieve 6 performance at those cutoffs will by their nature have fewer false positives and false negatives, thereby reducing unnecessary repeat testing and avoiding medical errors.
Published reports have shown that the widely used CAP/CTM and RealTime assays may yield unexplained viral blips with no obvious clinical cause in patients on stable antiretroviral (ARV) therapy (7, 29, 30). It is possible that these blips are due to the viral load assay used and the underlying technology that may lead to the detection of proviral DNA (6). It has also been demonstrated that probes within the 2-LTR target regions may be more prone to result in higher coefficients of variation than probes within thepolregion (31). Therefore, we aimed to compare the performances at the point of decision of two new fully automated VL assays for HIV quantitation, the Cobas 6800 and Aptima assays, with the conventional RealTime assay. Assay precision and accuracy were compared in replicates of clinical samples of various subtypes at the two clinically relevant thresholds of 50 and 200 copies/ml, respectively. Assay performance comparisons were performed in retrospective follow-up samples from 7 patients under antiretroviral treatment representing various HIV-1 subtypes and in 1,011 fresh clinical samples.
Accuracy and precision analyses at the two relevant cutoffs (50 and 200 copies/ml) showed the best accuracy and precision for the RealTime and Aptima results, with the two assays performing similarly, while the Cobas 6800 assay appeared to be more inaccurate. Indeed, the RealTime and Aptima assays yielded values that were within 0.20 log copies/ml from the target values, while the Cobas 6800 results were on average ⬃0.4 log copies/ml systematically above the target. The Cobas 6800 assay was also much less precise than the RealTime and Aptima assays, as shown by a much wider RoU around the average values. Sigma analysis of assay accuracy and precision showed that, similar to RealTime, the Aptima assay was highly precise, meeting at least the 3 requirement for all subtypes and viral load levels. Although Cobas 6800 performance reached 5 (excellent) for the majority of higher-viremia replicates, its performance dropped down to 4and less for lower-viremia replicates.
As HIV assays exhibit various degree of variability at low VLs around the clinically relevant cutoffs, assay performance at these key thresholds can be objectively evalu-ated using the sigma metrics (8). Westgard and Lucic (8) used previously published data on HIV VL assays (6, 26) to retrospectively calculate the sigma metrics for two compar-FIG 6Deming regression analyses for assay comparisons. The solid lines represent assay results best fit. The dots represent logarithmic values of each tested clinical sample from one assay (xaxis) versus the comparator assay (yaxis).
on May 16, 2020 by guest
http://jcm.asm.org/
[image:10.585.55.358.72.170.2]ator assays and found the RealTime assay to be 6(world-class; in both studies) and the CAP/CTM assay to be 4(good in reference 6) to 3(marginal in reference 26). The Westgard sigma analysis for RealTime is in agreement with our findings.
In 1,011 fresh plasma samples, a qualitative comparison (quantitated versus not quantitated) of assay results using the assay-specific cutoffs showed that the Cobas 6800 assay quantitated nearly twice as many plasma samples than the Aptima and RealTime assays. This may be attributed to a combination of both amplification of cell-associated proviral DNA and increased detection of very low viral loads, as sug-gested by Ouma et al. (32). The first is relatively unlikely because the EDTA-blood samples were centrifuged immediately after entering the laboratory, and fresh plasma was used for all three assays. The RealTime and Cobas 6800 assays should at least be able to detect free plasma viral DNA in a comparable manner. The second seems unlikely because the limits of detection (LOD) for Cobas 6800 and Aptima are compa-rably low. Switching to the clinical validated cutoff of 50 copies/ml, the number of quantitated samples by the Cobas 6800 was⬃10 to 12% higher than with the Aptima and RealTime assays. In analyses of all quantitated results, the three assays showed high correlation of VL values, withR2⬎0.98 and average differences of⬍0.2 log copies/ml.
These findings are comparable with those from prior studies that compared the Aptima and RealTime assays (13–15, 18, 19).
For longitudinal data from 7 patients under treatment, there was a high agreement with all three assays across a wide range of VLs and different HIV subtypes. Generally, the Aptima and RealTime assay values were closer, and slightly below the Cobas 6800 values, except in one patient (subtype A).
In conclusion, this study is the first comparing the Aptima, Cobas 6800, and RealTime assays for HIV VL quantitation side by side, and to use the sigma metrics in a primary analysis to objectively rate the assays’ performance based on a multicenter evaluation. The RealTime and Aptima assays demonstrated a very high agreement, and the two assays performed equally well in relation to clinically relevant cutoffs, showing excellent accuracy and precision. In this analysis, the results from the Cobas 6800 assay appeared to be more discordant with the other two assays and less precise and accurate at the clinically relevant cutoffs (50 and 200 copies/ml). Thus, the Cobas 6800 results should be interpreted with more caution before clinical decisions are made. Of the three tested assays, Aptima was the only assay showing at least 3performance for all tested subtypes and dilutions. Assays that can achieve highperformance inher-ently have fewer false positives and false negatives, which allows clinicians to unequiv-ocally trust the assay results. Owing to itsperformance, high concordance with the RealTime reference assay, and user-friendly handling, full automation, flexibility of operation (random access), and efficient workflow (no batches), the Aptima assay represents a good choice for diagnostic laboratories performing routine monitoring of HIV-1 VLs.
ACKNOWLEDGMENT
We thank Florence Paillard for her assistance.
REFERENCES
1. World Health Organization (WHO). March 2014 supplement to the 2013 consolidated guidelines on the use of antiretroviral drugs for treating and preventing HIV infection: recommendations for a public health approach. World Health Organization, Geneva, Switzerland.http://apps .who.int/iris/bitstream/handle/10665/104264/9789241506830_eng.pdf ?sequence⫽1.
2. Department of Health and Human Services (DHHS). 2018. Guidelines for the use of antiretroviral agents in HIV-1-infected adults and adolescents. Department of Health and Human Services, Washington, DC.http:// aidsinfo.nih.gov/contentfiles/lvguidelines/AdultandAdolescentGL.pdf. 3. Thompson MA, Aberg JA, Hoy JF, Telenti A, Benson C, Cahn P, Eron JJ,
Günthard HF, Hammer SM, Reiss P, Richman DD, Rizzardini G, Thomas DL, Jacobsen DM, Volberding PA. 2012. Antiretroviral treatment of adult
HIV infection: 2012 recommendations of the International Antiviral Society-USA panel. JAMA 308:387– 402. https://doi.org/10.1001/jama .2012.7961.
4. European AIDS Clinical Society (EACS). 2013. Guidelines, version 7.0, October 2013. European AIDS Clinical Society, Brussels, Belgium.http:// www.eacsociety.org/files/guidelines_9.0-english.pdf.
5. Ribaudo H, Lennox J, Currier J. 2009. Virologic failure endpoint definition in clinical trials: is using HIV-1 RNA threshold⬍200 copies/mL better than⬍50 copies/mL? An analysis of ACTG studies. 16th Conference on Retroviruses and Opportunistic Infections, 8 to 11 February 2009, Montreal, Canada. 6. Nettles RE, Kieffer TL, Kwon P, Monie D, Han Y, Parsons T, Cofrancesco J,
Jr, Gallant JE, Quinn TC, Jackson B, Flexner C, Carson K, Ray S, Persaud D, Siliciano RF. 2005. Intermittent HIV-1 viremia (Blips) and drug resistance
on May 16, 2020 by guest
http://jcm.asm.org/
in patients receiving HAART. JAMA 293:817– 829. https://doi.org/10 .1001/jama.293.7.817.
7. Ruelle J, Debaisieux L, Vancutsem E, De Bel A, Delforge ML, Piérard D, Goubau P. 2012. HIV-1 low-level viraemia assessed with 3 commercial real-time PCR assays show high variability. BMC Infect Dis 12:100.https:// doi.org/10.1186/1471-2334-12-100.
8. Westgard S, Lucic D. 2015. Sigma metrics for assessing accuracy of molecular testing. Clin Microbiol Newslett 37:103–110.https://doi.org/ 10.1016/j.clinmicnews.2015.06.001.
9. Schønning K, Johansen K, Landt B, Benfield T, Westh H. 2017. Compar-ison of the Hologic Aptima HIV-1 Quant Dx assay to the Roche COBAS Ampliprep/COBAS TaqMan HIV-1 test v2.0 for the quantification of HIV-1 RNA in plasma samples. J Clin Virol 92:14 –19.https://doi.org/10.1016/j .jcv.2017.05.006.
10. Sauné K, Raymond S, Boineau J, Pasquier C, Izopet J. 2016. Detection and quantification of HIV-1 RNA with a fully automated transcription-mediated-amplification assay. J Clin Virol 84:70 –73.https://doi.org/10 .1016/j.jcv.2016.09.002.
11. Hatzakis A, Papachristou H, Nair SJ, Fortunko J, Foote T, Kim H, Peling TL, Worlock AJ. 2016. Analytical characteristics and comparative evaluation of Aptima HIV-1 Quant Dx assay with AmpliPrep/COBAS TaqMan HIV-1 test v2.0. Virol J 13:176.https://doi.org/10.1186/s12985-016-0627-y. 12. Sahoo MK, Varghese V, White E, Winslow M, Katzenstein DA, Shafer RW,
Pinsky BA. 2016. Evaluation of the Aptima HIV-1 Quant Dx Assay using plasma and dried blood spots. J Clin Microbiol 54:2597–2601.https:// doi.org/10.1128/JCM.01569-16.
13. Manak MM, Hack HR, Nair SV, Worlock A, Malia JA, Peel SA, Jagodzinski LL. 2016. Evaluation of Hologic Aptima HIV-1 Quant Dx assay on the Panther system on HIV subtypes. J Clin Microbiol 54:2575–2581.https:// doi.org/10.1128/JCM.01350-16.
14. Amendola A, Pisciotta M, Aleo L, Ferraioli V, Angeletti C, Capobianchi MR. 2016. Evaluation of the Aptima HIV-1 Quant Dx assay for HIV-1 RNA viral load detection and quantitation in plasma of HIV-1-infected individuals: a comparison with Abbott RealTime HIV-1 assay. J Med Virol 88:1535–1544.https://doi.org/10.1002/jmv.24493.
15. Sam SS, Kurpewski JR, Cu-Uvin S, Caliendo AM. 2016. Evaluation of performance characteristics of the Aptima HIV-1 Quant Dx assay for detection and quantitation of human immunodeficiency virus type 1 in plasma and cervicovaginal lavage samples. J Clin Microbiol 54: 1036 –1041.https://doi.org/10.1128/JCM.03289-15.
16. Nair SV, Kim HC, Fortunko J, Foote T, Peling T, Tran C, Nugent CT, Joo S, Kang Y, Wilkins B, Lednovich K, Worlock A. 2016. Aptima HIV-1 Quant Dx–a fully automated assay for both diagnosis and quantification of HIV-1. J Clin Virol 77:46 –54.https://doi.org/10.1016/j.jcv.2016.02.002. 17. Schalasta G, Börner A, Speicher A, Enders M. 2016. Comparative
evalu-ation of the Aptima HIV-1 Quant Dx assay and COBAS TaqMan HIV-1 v2.0 assay using the Roche High Pure System for the quantification of HIV-1 RNA in plasma. Clin Chem Lab Med 54:493– 499.https://doi.org/10.1515/ cclm-2015-0522.
18. Mor O, Gozlan Y, Wax M, Mileguir F, Rakovsky A, Noy B, Mendelson E, Levy I. 2015. Evaluation of the RealTime HIV-1, Xpert HIV-1, and Aptima HIV-1 Quant Dx assays in comparison to the NucliSens EasyQ HIV-1 v20 assay for quantification of HIV-1 viral load. J Clin Microbiol 53: 3458 –3465.https://doi.org/10.1128/JCM.01806-15.
19. Hopkins M, Hau S, Tiernan C, Papadimitropoulos A, Chawla A, Beloukas
A, Geretti AM. 2015. Comparative performance of the new Aptima HIV-1 Quant Dx assay with three commercial PCR-based HIV-1 RNA quantita-tion assays. J Clin Virol 69:56 – 62.https://doi.org/10.1016/j.jcv.2015.05 .020.
20. Kessler HH, Stelzl E 2017. Profile of Roche’s cobas HCV tests. Expert Rev Mol Diagn 17:311–319.https://doi.org/10.1080/14737159.2017.1293526. 21. Vermehren J, Stelzl E, Maasoumy B, Michel-Treil V, Berkowski C, Marins EG, Paxinos EE, Marino E, Wedemeyer H, Sarrazin C, Kessler HH. 2017. Multicenter comparison study of both analytical and clinical perfor-mance across four Roche hepatitis C virus RNA assays utilizing different platforms. J Clin Microbiol 55:1131–1139.https://doi.org/10.1128/JCM .02193-16.
22. Hologic, Inc. Aptima HIV-1 Quant Dx assay product information. 11/2014. Hologic, Inc., San Diego, CA. https://www.hologic.com/sites/default/ files/package-insert/AW-11853-001_003_01.pdf.
23. Roche Molecular Systems. 2015. cobas HIV-1, quantitative nucleic acid test for use on the cobas 6800/8800 systems. Instructions for use. Roche Molecular Systems, Pleasanton, CA.
24. Abbott Laboratories. 2011. Abbott RealTime HIV product information. Abbott Laboratories, Abbott Park, IL.
25. Jülicher P, Dhein J. 2014. The range of uncertainty: a tool for efficiently addressing result variability around clinical decision points for hepatitis C response-guided therapy. Biomark Insights 9:9 –13.https://doi.org/10 .4137/BMI.S14481.
26. Naeth G, Ehret R, Wiesmann F, Braun P, Knechten H, Berger A. 2013. Comparison of HIV-1 viral load assay performance in immunological stable patients with low or undetectable viremia. Med Microbiol Immu-nol 202:67–75.https://doi.org/10.1007/s00430-012-0249-y.
27. Wiesmann F, Braun P, Knickmann M, Knechten H. 2014. Low level HIV viremia is more frequent under protease-inhibitor containing firstline therapy than under NNRTI-regimens. J Int AIDS Soc 17(4 Suppl 3):19828.
https://doi.org/10.7448/IAS.17.4.19828.
28. Ryscavage P, Kelly S, Li JZ, Harrigan PR, Taiwo B. 2014. Significance and clinical management of persistent low-level viremia and very-low-level viremia in HIV-1-infected patients. Antimicrob Agents Chemother 58: 3585–3598.
29. Garrett NJ, Apea V, Nori A, Ushiro-Lumb I, Oliver AR, Baily G, Clark DA. 2012. Comparison of the rate and size of HIV-1 viral load blips with Roche COBAS TaqMan HIV-1 versions 1.0 and 2.0 and implications for patient management. J Clin Virol 53:354 –355.https://doi.org/10.1016/j .jcv.2011.12.024.
30. Briggs R, Templeton K, Fernando I. 2014. Comparing HIV viral load assays and frequency of low level virological rebound in clinical practice. Int J STD AIDS 25:1029 –1034.https://doi.org/10.1177/0956462414528313. 31. Strain MC, Lada SM, Luong T, Rought SE, Gianella S, Terry VH, Spina CA,
Woelk CH, Richman DD. 2013. Highly precise measurement of HIV DNA by droplet digital PCR. PLoS One 8:e55943.https://doi.org/10.1371/ journal.pone.0055943.
32. Ouma KN, Basavaraju SV, Okonji JA, Williamson J, Thomas TK, Mills LA, Nkengasong JN, Zeh C. 2013. Evaluation of quantification of HIV-1 RNA viral load in plasma and dried blood spots by use of the semiautomated Cobas Amplicor assay and the fully automated Cobas AmpliPrep/ TaqMan assay, version 2.0, in Kisumu, Kenya. J Clin Microbiol 51: 1208 –1218.https://doi.org/10.1128/JCM.03048-12.