M E T H O D
Open Access
TOAST: improving reference-free cell
composition estimation by cross-cell type
differential analysis
Ziyi Li and Hao Wu
*Abstract
In the analysis of high-throughput data from complex samples, cell composition is an important factor that needs to be accounted for. Except for a limited number of tissues with known pure cell type profiles, a majority of genomics and epigenetics data relies on the “reference-free deconvolution” methods to estimate cell composition. We develop a novel computational method to improve reference-free deconvolution, which iteratively searches for cell
type-specific features and performs composition estimation. Simulation studies and applications to six real datasets including both DNA methylation and gene expression data demonstrate favorable performance of the proposed method. TOAST is available athttps://bioconductor.org/packages/TOAST.
Keywords: Reference-free deconvolution, Tissue-heterogeneity, DNA methylation, Gene expression, Cell-type composition
Background
There have been an increasing number of large-scale clin-ical studies using high-throughput technologies to pro-file biological samples collected from human subjects, in order to identify molecular biomarkers and therapeutic targets for different diseases [1, 2]. These samples (e.g., blood, tumor, or brain tissues) are often mixtures of differ-ent cell types. The importance of accounting for cell com-position in high-throughput data analyses has been well-recognized [3–5]. For example, researchers proposed to include the compositions in regression models as covari-ates to adjust for the association between proportions and phenotype [6,7], or to use them as inputs to solve for cell type-specific profiles [8]. Adjusting for cell composition is especially emphasized in epigenome-wide association studies (EWAS), where ignoring the composition has been shown to produce biased results [4]. As a result, adjusting for cell composition has become a standard procedure in EWAS studies [6,9–11].
Regardless of the approach and goal, an important first step in the analysis of high-throughput data from complex
*Correspondence:hao.wu@emory.edu
Department of Biostatistics and Bioinformatics, Rollins School of Public Health, Emory University, 1518 Clifton Road NE, Atlanta, GA 30322, USA
tissues is to estimate the cell compositions. Experimen-tal approaches including different cell sorting techniques [12,13] are accurate, but too laborious and expensive to be used in large-scale studies. A number of computational methods based on signal deconvolution algorithms have been proposed. These methods mainly fall into two major categories: based (RB) [14–17] and reference-free (RF) deconvolution [18–23].
There have been some discussions and comparisons of RB and RF deconvolution methods. It was reported that the RB deconvolution in general provides more accurate and robust estimation than RF deconvolution [17,24,25]. However, the application of RB methods are limited because it requires reference panels—the data from puri-fied cell types. Currently, such reference panels only exist for a few tissue types, including blood [14,26,27], brain [6], and pancreas [28]. When reference panels are unavail-able, for example in under-studied tissues or new high-throughput data modalities, RF deconvolution is the only viable solution. Moreover, the reference data are collected from a small number of samples with limited clinical con-ditions (mostly healthy subjects) and phenotypes such as age and gender. It has been reported that reference-based method fails to provide accurate cell composition esti-mation when the subjects of mixed tissues and reference
panels have significant differences in clinical conditions and phenotypes, for example, when mixed samples are collected from newborns while the pure tissue samples are from adults [29]. In this case, reference-free decon-volution could be a better option [23,30]. Due to these reasons, RF deconvolution is widely applied in recent studies of complex tissues [10,31,32]; therefore, new tech-niques with potential of improving RF deconvolution is worthy of further investigation.
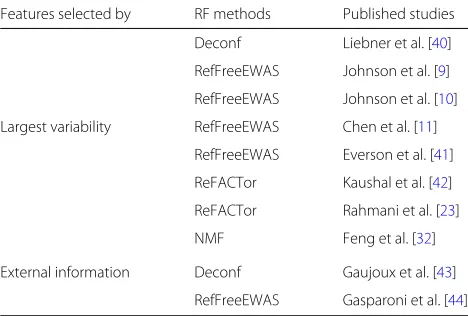
[image:2.595.56.290.522.680.2]The high-throughput data from complex samples are weighted averages of signals from different cell types. To solve for cell compositions, most RF deconvolution methods are based on some type of factor analysis. They usually apply on the data for a subset of “informative” features, or the ones containing information for the cell composition. It has been reported that feature selection plays an important role in the deconvolution and has great impacts on the accuracy of cell composition esti-mation [33–35]. Intuitively, the good features are the cell type-specific ones, i.e., the ones with distinct profiles in different cell types [36]. However, without reference panels, these features cannot be easily identified. As a result, most popular RF methods resort to ad hoc fea-ture selection procedure. The variability of feafea-tures has been commonly used as indicator of how “informative" a feature is for sample mixing [35, 37–39]. Using the most variable features in reference-free deconvolution is also recommended by a number of existing reference-free deconvolution publications [22,23,36]. A review of pub-lished studies that used RF deconvolution (Table1) reveals that 8 out of 10 methods select the most variable sites as features.
Table 1Summary of different feature selection techniques used
by reference-free deconvolution methods in published studies
Features selected by RF methods Published studies
Deconf Liebner et al. [40]
RefFreeEWAS Johnson et al. [9]
RefFreeEWAS Johnson et al. [10]
Largest variability RefFreeEWAS Chen et al. [11]
RefFreeEWAS Everson et al. [41]
ReFACTor Kaushal et al. [42]
ReFACTor Rahmani et al. [23]
NMF Feng et al. [32]
External information Deconf Gaujoux et al. [43]
RefFreeEWAS Gasparoni et al. [44]
RefFreeEWAS is EWAS using Reference-Free DNA Methylation Mixture Deconvolution, from CRAN packageRefFreeEWAS. ReFACTor is reference-free adjustment for cell type composition, from theGLINTpackage. NMF is non-negative matrix factorization, available fromhttps://github.com/haoharryfeng/cfDNAmethy. Deconf is the in-silico deconfounding approach, i.e., alternate least-square NMF method using heuristic constraints, available from theCellMixpackage
In this work, we develop a straightforward and effective algorithm to improve RF deconvolution by better select-ing features. The key idea is to identify features showselect-ing distinct profiles among different cell types, without know-ing the pure cell type profiles or mixknow-ing proportions a priori. The feature selection procedure is purely data-driven, without requiring any additional information. The algorithm is based on a recently developed statistical framework, which provides functionality to detect cross-cell type differential signals for high-throughput data from mixed samples [45]. The proposed algorithm in this work iteratively performs feature selection (based on cross cell type differential analysis) and RF deconvolution and only needs a small number of iterations (less than 30) to achieve the best estimation.
We evaluate our method through extensive simulation and analyses of six real datasets and show that the pro-posed method can significantly improve the accuracy of proportion estimation based on existing RF deconvo-lution techniques. From our method, we observe sub-stantial improvement in correlation and reduction in bias in the estimated proportions. In addition, there are significant improvements by using several other met-rics including root mean squared error and goodness-of-fit of the deconvolution model, and precision of the selected features. Our method is applicable to both gene expression data and DNA methylation data as demon-strated in both simulation and real data applications. The method is implemented in the R package TOAST (TOols for the Analysis of heterogeneouS Tissues), which is freely available on Bioconductor (https://bioconductor. org/packages/TOAST).
Results
Method overview
In this work, we develop an iterative algorithm to improve feature selection. Figure1summarizes the general work-flow of the proposed method in an intuitive way. Given the original data matrixYand a list of initial features, step (a) is to conduct an RF deconvolution to estimate mix-ture proportions. With estimated proportions, step (b) is to identify cell type-specific features using cross-cell type differential analysis. These features are then used for the RF deconvolution in step (a) in a new iteration. By iter-ating steps (a) and (b), the updated feature list can better capture the cell type distinction and improve RF decon-volution compared with initial features that are usually selected by choosing the most variable ones. The detailed notations and algorithm are described in the “Method and material” section.
a
b
Fig. 1A schematic plot to illustrate the proposed method. We assume four cell types (K= 4) and six subjects (N= 6). Our method starts with the original data matrixYand a list of initial markers. In step a, mixture proportions are estimated using existing RF deconvolution algorithms. In step b, cross-cell type differential analysis is performed to identify cell type specific-features as updated feature list. We improve the feature selection and RF deconvolution through iterating steps (a) and (b)
we conduct extensive simulation and real data analyses of both gene expression data and DNA methylation data. We apply TOAST with the most popular reference-free methods,deconf [19] for gene expression data and Ref-FreeEWAS[22] andBayesCCE[23] for DNA methylation data.
Simulation
To comprehensively assess the proposed method, we design a series of simulation studies where we can man-ually control the cell mixing procedure and sample sizes. Simulation data are generated based on real microarray experiments, one for gene expression and the other one for DNA methylation. We evaluate the impact of sev-eral factors on the deconvolution results, including sam-ple size, initial marker selection, endpoint selection, and number of cell types in the mixture. The simulation pro-cedure is described in detail in the “Method and material” section. In each simulation setting, the results presented are summarized over 100 Monte Carlo datasets.
To obtain a fair assessment of the proposed method, we adopt a number of metrics including correlations and root
mean squared bias (RMSBias) of estimated versus true proportions, overlaps with true cell type-specific features, goodness of fit, and root mean squared error (RMSE) of the fitted deconvolution model. These metrics quantify the deconvolution results from the quality of estimated proportions, precision of selected features, and goodness of the overall deconvolution model. These metrics have been used by several previous studies [17, 23, 27, 46]. The details of calculating these metrics are available in the “Method and material” section. Using these metrics, higher correlations with true proportions, more overlaps with cell type-specific markers, higher goodness of fit, smaller RMSBias, and RMSE indicate better deconvolu-tion performance.
Benchmarking TOAST through simulation
[image:3.595.58.542.87.398.2]a
b
Fig. 2Results of the simulation study based on gene expression microarray dataset (GSE19830).aThe correlations between estimated and true proportions by number of iterations. Left panel ofa: boxplot of correlations for four cell types by number of iterations. Right panel ofa: mean correlations across four cell types by number of iterations.bThe number of overlaps with true cell type-specific (CTS) markers before and after iterations in the top left panel, the root mean squared bias (RMSBias) in the top right panel, the goodness of fit in the bottom left panel, and the root mean squared error (RMSE) in the bottom right panel. Sample size is 100 forb.pvalues in each panel are obtained using pairedttest. Red font indicates being statistical significant. Top 1001–2000 most variable features are selected as initial features. Baseline performance is presented in the “number of iterations = 0” columns inaand “Before” columns inb
types (left panels) and averaged over four cell types (right panels). From the top row to bottom row, samples sizes increase from 50, 100 to 200. It is clear from left panels that overall the correlations between estimated and true proportions keep increasing during the iteration for all four cell types. The improvements are more dramatic and at the same time more stable with larger sample sizes. In the right panels, we compare the mean correlations over four cell types from the proposed method (black solid lines) versus by using the 1000 “real” cell type-specific features (red dashed lines). Here the real cell type-specific features are obtained from analyzing the pure cell type profiles. Note that these cell type-specific features are not available in real datasets. The results in right panels of Fig. 2a show that our iterative procedure achieves similar or even slightly better results than using true cell type-specific features. This indicates that our method is able to identify better cell type-specific features than using reference panels, which are usually of limited sam-ple size (e.g., only one biological replicate in the current simulation study) and biological variances. In real world scenarios when reference panels are often obtained from a population different from the samples being stud-ied, there could be biases in the reference. When the biases in the existing reference panels are large, TOAST can achieve better performance than using external reference panel.
Figure2b shows the change of other metrics before and after applying the proposed method using 100 simulated samples. We observe that applying the proposed method significantly increases the number of overlaps with cell type-specific features (p < 1e−16) and goodness of fit (p < 1e−16) and significantly decreases RMSBias (p < 1e−16) and RMSE (p<1e−16). Additional file1: Figure S8 is a Venn diagram that intuitively presents the overlaps between initial, TOAST-selected, and cell type-specific features.
[image:4.595.56.539.87.296.2]Initial feature selection
As described in the “Background” section, variability is commonly used to select “informative” features for reference-free deconvolution. Along the same line, we consider six different approaches to select initial features, including the top 1000 most variable features; the top 1001 to 2000, 2001 to 3000, 5001 to 6000, and 10,001 to 11,000 most variable features; and 1000 randomly selected features. Figure3and Additional file1: Figure S7 demonstrate that regardless of the method being used, the improvements from without applying TOAST (“Initial” columns) to after applying TOAST (“TOAST” columns) are consistent and stable across different sample sizes (rows) and data types (gene expression in Fig.3and DNA methylation in Additional file1: Figure S7). Even a ran-domly selected set of initial features can lead to substantial improvements after applying TOAST (Additional file 1:
Figure S4). This indicates that TOAST is very robust and stable to selections of initial features.
Closer comparisons of initial feature selections reveal that different initial features only have slight impacts on the converging rate. We compare using the top 1000 most variable features as initial features (Additional file1: Figure S2, S3) versus using the second 1000 most variable features (Fig.2, Additional file1: Figure S1). We find the latter set of features requires fewer iterations to achieve a satisfactory deconvolution results than the former set. However, with enough number of iterations (e.g., 30 iter-ations), the ending correlations with true proportions are similar for these two sets of initial features.
To further investigate this phenomenon, we first check the overlaps between selected features and the true cell type-specific features (identified from pure profiles) in our simulation study with 100 simulated subjects. Additional
[image:5.595.57.544.320.664.2]file1: Figure S6a shows an increasing trend for overlaps during the iteration. This trend is clear for both top 1000 and second 1000 most variable features as initial features, however, the second 1000 features have higher numbers of overlaps with cell type-specific features. This explains why selecting the second 1000 features could converge faster than the top 1000. With the increasing of iteration num-bers, the difference between the two lines in Additional file1: Figure S6a shrinks, which is consistent with the sim-ilar ending correlations by using the two sets of initial features.
In the same direction, we also compare the within-cell type standard deviations for different sets of features: the top 1000 most variable features, the second 1000 most variable features, and the features selected after applying TOAST, using the pure tissue profiles of the Mouse-Mix dataset (described later). As shown in Additional file 1: Figure S6b, the top 1000 most variable features have greater within-cell type variance than the second 1000 most variable features, and the features selected after applying TOAST have the smallest variation. This indi-cates that selecting the most variable features might not be a good idea in general, since the large variance can be from within-cell type (whereas one wants features with large between-cell type variation).
Considering the final performance using different initial features is similar, and the 1001–2000 most variable fea-tures have better converging rate than the top 1000 most variable features, we stick with using the 1001–2000 most variable features as initial features.
Ending point of iterations selection
In addition to initial feature selection, it is also impor-tant to understand how to choose the ending point of iterations. Ideally, we want to choose the iteration where the correlations of estimated and true proportions reach maximum. However, these correlations cannot be com-puted without knowing the true proportions. Root mean squared error (RMSE) of the fitted data from deconvo-lution methods has been used to choose tuning parame-ters in deconvolution algorithm [17]. Technically speak-ing, RMSE is not directly related to correlation with true proportions. However, RMSE reflects the fitness of the deconvolution model to the observed data, and bet-ter fitness usually leads to betbet-ter proportion estimation. Figure4a and c show the scatterplots of RMSE versus cor-relations with true proportions, from the gene expression and DNA methylation simulation studies, respectively. Significant negative correlations can be observed between RMSE and correlations with true proportions, indicat-ing that smaller RMSE is related with better proportion estimation.
Figure4b and d are boxplots of correlations with true proportions using different endpoint in the algorithm,
from gene expression and DNA methylation simulations. Initis the results of using conventional RF methods with-out applying the proposed method. Iter20, Iter30, and RMSEare different ways of selecting endpoint.Bestis the best correlation results from the 30 iterations. Note that Bestis not observed in real data analysis but is presented here to make us aware of the best possible results.
We find no matter which endpoint selection method is used, the increase of correlations with true proportions over initial point is dramatic, which demonstrates the sta-bility of the proposed method. Among the three endpoint selection methods, choosing by smallest RMSE results in the highest mean correlations in both gene expression and DNA methylation simulation studies. This finding also holds if we use randomly selected initial features (Addi-tional file 1: Figure S5). Together with the significant negative correlations observed in Fig.4a and c, we decide to choose the ending point of the proposed algorithm by the smallest RMSE. In our software, users could specify the total number of iterations, and among them, the iter-ation with the smallest RMSE would be chosen. Based on our experience, 30 iterations are sufficient for gene expres-sion and DNA methylation datasets with four cell types and moderate or large sample size. The number of itera-tions should be increased for studies with smaller sample size (e.g., less than 50) or more cell types (e.g., 6 or more).
Impact of number of cell types in the mixture
For RF deconvolution, selecting an appropriate number of cell types is a difficult question. We provide more dis-cussion toward the selection of cell type numbers in the “Discussions” section. Here we use our DNA methylation simulation study to explore the impact of having 6 cell types (CD4T, CD8T, Gran, Mono, NK, B cells) versus 4 cell types (CD4T+CD8T+NK, Gran, Mono, B cells) on RF deconvolution and the proposed method. As expected, increasing number of cell types leads to lower correla-tions of estimated proporcorrela-tions versus true proporcorrela-tions even after applying TOAST (Additional file1: Figure S9).
320 340 360 380 400 420 440
0.2
0.4
0.6
0.8
1.0
a
RMSE
Corr with tr
ue prop
Corr = 1.78−0.00282RMSE
r = −0.2994
Init Iter20 Iter30 RMSE Best
0.2
0.4
0.6
0.8
1.0
b
d
Selected endpoint0.1032 0.1036 0.1040 0.1044
0.2
0
.4
0.6
0
.8
1.0
c
RMSE
Corr with tr
ue prop
Corr = 57.03−544.2RMSE
r = −0.5409
Init Iter20 Iter30 RMSE Best
0.2
0.4
0
.6
0.8
1.0
Selected endpoint
Fig. 4Exploration of endpoint selection.a,bResults from gene expression simulation settings.c,dDNA methylation simulation settings.a,c
Negative correlations between RMSE and the correlations of estimated versus true proportions.b,dThe boxplots of correlations with true proportion using different endpoint selection methods. Init is based on the initial features. Iter20 is based on features after 20 iterations. Iter30 is based on features after 30 iterations. RMSE is based on results with the smallest RMSE in 30 iterations. Best is the best possible correlations over all iterations (not obtainable in real data analysis)
just a few cell types, so it is reasonable to just model the major ones. To what level the cell types should be combined and modeled is another question worth further investigations.
Compatibility with other RF method
TOAST is a feature selection method and works in con-junction with existing RF deconvolution methods for cell composition estimation. For all above results, TOAST uses deconf for gene expression and RefFreeEWAS for DNA methylation deconvolution. However, TOAST will work with other RF deconvolution methods and improve the results through better feature selection. Here we choose the state-of-the-art deconvolution method for DNA methylation data, BayesCCE [23], to demonstrate the flexibility of the proposed method. In their semi-nal paper published in 2018, BayesCCE has been shown to outperform existing deconvolution methods including ReFACTor [47], NNMF [20], and MeDeCom [48]. Here
we compare performance of BayesCCE with and without applying TOAST for feature selection.
We find TOAST can significantly improve the decon-volution performance of BayesCCE (Fig. 5). Compared to BayesCCE, the proportions estimated by BayesCCE+T (BayesCCE with TOAST incorporated) achieve signifi-cantly higher correlation with true proportions (p = 7.9e−07), smaller root mean squared error (p=3.4e−07), and root mean squared bias (p=5.8e−4). The improve-ment pattern holds in settings with different sample sizes (Additional file 1: Figure S10), and the improvement is more significant with the increase of sample size.
Real data results
[image:7.595.60.539.86.415.2]Fig. 5The proposed method could improve the deconvolution performance of BayesCCE in simulation studies. BayesCCE is the BayesCCE results without applying TOAST. BayesCCE+T is the BayesCCE algorithm with the proposed method TOAST. Results are based on 100 DNA methylation simulation datasets with four cell types. Panels from left to right demonstrate correlations of estimated versus true proportions (Corr with true prop), root mean squared error, and root means squared bias. 200 samples are simulated in each dataset. Thepvalues are obtained from pairedttest. Red fonts indicate significant test results. Boxplots are summarized from 100 Monte Carlo experiments
expression, the Mouse-Mix data [8] and Immune data [14]), and four DNA methylation datasets, the EPIC (European Prospective Investigation into Cancer and Nutrition) data [49], Aging data [50], RA (Rheumatoid Arthritis) data [51], and Breast data [10].
These datasets are diverse in a number of aspects. For example, the sample sizes of these datasets range from 12 (Immune data) to 689 (RA data). Both Mouse-Mix and Immune data have true proportions from experiments, but the rest of the datasets do not have “true” propor-tions to provide benchmarks. As a surrogate, we obtain blood reference panels from [4] with profiles of six cell types (CD8T, CD4T, NK, Bcell, Mono, Gran) and apply RB deconvolution methodEpiDISH[24] to obtain proportion estimates. Moreover, the Breast data is collected based on non-diseased breast tissue and does not have a reference panel to refer to. This is a perfect example to showcase the utility of RF deconvolution. To evaluate our method in the case with no prior information of cell type number of the tissue, we adopt goodness of fit in addition to correla-tion with true or RB proporcorrela-tions as metrics, as calculating goodness of fit does not require known true proportions (details demonstrated the “Method and material” section). The goodness of fit has been extensively used in previous studies to evaluate the deconvolution performance [27]. Even though it can be affected by the selected features to some degree, our simulation studies show that goodness of fit is highly and positively correlated with “correla-tions with true propor“correla-tions” (Additional file1: Figure S11). Thus, it is a reasonable metric to assess the deconvolution
results since better goodness of fit is more likely to be associated with estimates having higher correlation with true proportions.
Benchmarking TOAST through six real data experiments Figure6summarizes the correlations and goodness of fit from all real data applications. These analyses reveal in most of cases a significant increase of correlations with true or RB proportions (p = 0.0246) and in all cases a substantial increase of goodness of fit (p = 0.0139). We further examine the proportions estimated before and after applying TOAST for each dataset. Figure7and Addi-tional file1: Figure S12–S14 shows the estimated versus true proportions at initial point (“Before”) and after apply-ing TOAST (“After”). The improvements in proportion estimation can be dramatic for some datasets. For exam-ple in the application to the Mouse-Mix data shown in Fig.7a, the correlations of estimated and true proportions for liver increase from 0.857 to 0.923 after applying the proposed algorithm. Similarly, the correlations increase from 0.756 to 0.942 for the brain and from 0.862 to 0.964 for the lung.
[image:8.595.56.539.88.291.2]a
b
Fig. 6The proposed method improves the deconvolution results in real data applications. Boxplots show the evaluation metrics before and after updating features.aThe correlation of estimated versus true (Mouse-Mix, Immune datasets) or reference-based deconvolution solved proportions (EPIC, Aging, RA datasets).bThe goodness of fit for the deconvolution models before and after applying TOAST. The “Before” columns in both plots are baseline reference-free results without applying TOAST. Small jitter noises are added to points to provide better visualization
than Fig.7a and Additional file1: Figure S12, which have true proportions to benchmark the results. Neverthe-less, our proposed method still demonstrates significant improvements in the composition estimation.
The Breast data have neither true proportions nor RB proportions because of the lack of pure tissue profiles; thus, we cannot present correlations nor scatterplot of proportions as with other datasets. We use the RefFreeE-WASpackage to determine the number of cell types, and six is selected in the analysis (consistent with [10]). The goodness of fit shows a dramatic increase before and after applying TOAST (Purple crossed squares in Fig.6b).
We further demonstrate the compatibility of TOAST with BayesCCE and evaluate the performance in the three DNA methylation datasets (EPIC, Aging, and RA) which collect blood samples, as blood samples have prior knowl-edge of blood proportions provided in the BayesCCE paper. Additional file 1: Figure S16 shows that TOAST improves the performances from both RefFreeEWAS and BayesCCE. With TOAST, both methods have higher mean absolute correlations and lower root mean squared bias.
Comparison of RB and RF estimations in RA data
Finally, we ask whether the estimated proportions are bio-logically meaningful? Moreover, we are curious between RB and RF, which provides more meaningful estimation? Previous studies have shown that when reliable refer-ence panel is available, RB deconvolution can obtain pro-portion estimates with high accuracy [14–17]. However, when the reference panel is obtained from subjects with
different phenotypes such as age, gender, and disease sta-tus from the population of interests, RF could provide better proportion estimates than RB method [30].
RA dataset [51] epitomizes such a scenario, as it collects the whole blood from 354 RA patients and 335 normal controls with males and females in each group, while the blood reference panel is obtained from 6 healthy males in a separate study [26]. It was reported that RA can signif-icantly change the proportions of some blood cell types in patients [52, 53], making blood cell proportions from RA patients differ from healthy subjects. Thus, the blood cell proportions can potentially be used for predicting RA. To compare the proportion estimations from differ-ent methods, we adopt a tenfold cross validation and use the estimated proportions to predict the disease status of each patient. Proportions that can better predict disease are deemed better estimated.
[image:9.595.60.541.87.296.2]a
b
Fig. 7Proportion estimation from the Mouse-Mix dataset (GSE19830, upper panel) and EPIC dataset (GSE51032, lower panel). Left panels ofaand
b: estimated proportions versus true proportions without applying TOAST (baseline performance). Right panels ofaandb: estimated versus true proportions after updating feature selection by the proposed algorithm. “True” proportion of the EPIC dataset is obtained using RB deconvolution methodEpiDISH
a
b
[image:10.595.61.538.86.430.2] [image:10.595.63.539.481.685.2]We also investigate the impacts of gender on the pre-diction performance (Additional file 1: Figure S15). In both male and female groups, we observe comparable or improvements after applying TOAST (yellow and red lines) over without TOAST (green and purple lines). These results again demonstrate the favorable and robust performance of the proposed method. On another note, we observe greater improvements by using TOAST in females than in males. In male populations, there is mini-mum advantage in reference-free deconvolution methods (colored lines) over reference-based method (black line), while the advantage is more profound in the female group and overall population. We believe this could be explained through gender distinctions in RA etiology [54–56] and sample size differences (197 males and 492 females). Nev-ertheless, TOAST still provides robust performance in improving proportion estimations and disease predictions for both male and female samples.
Discussions
We present TOAST, a feature selection method for reference-free deconvolution to estimate cellular compo-sition from high-throughput data of complex samples. We design an iterative algorithm, based on cross-cell type differential analysis, that improves feature selec-tion and subsequently proporselec-tion estimaselec-tion. Different from other methods that improve deconvolution per-formance through prior knowledge of markers or cell type proportions, TOAST is a purely data-driven method without requiring additional information. This provides great convenience for analyzing novel complex tissues or data from new modalities. TOAST can be incorporated with most, if not all, existing RF methods. The appli-cations to deconf, RefFreeEWAS, and BayesCCE show-case this flexibility. If any prior information about cell type proportions are available, TOAST together with a RF method that utilizes such information, for exam-ple, BayesCCE, could further improve the estimation accuracy.
It is important to note that in general the RF decon-volution methods require large sample size to work well. As described in the “Background” section, sample decon-volution is important for analyzing data from large-scale clinical studies for human diseases. In such studies, large sample size is not only reasonable, but also necessary. In our opinion, the small sample size study is only reasonable for very homogeneous samples, such as cell lines or model organisms. To study heterogeneous and complex diseases in human subject, large sample size is necessary to provide enough power to identify disease biomarkers and thera-peutic targets. This is the reason why most serious studies of human diseases have large sample sizes, for example, TCGA for cancers [57] and ROS/MAP for neurodegenera-tive diseases [58]. On another note, for datasets with small
sample sizes, reference-free method is not recommended and one has to rely on reference-based method.
One universal difficulty of applying RF methods is to choose an appropriate number of cell types. Toward this end, we first want to join the discussions in previous publications and mention the usage of prior knowledge [23, 48]. For tissues that have been well-studied, such as blood and brain, prior knowledge about cell types can be easily obtained [26,59]. When there is no prior informa-tion about the number of cell types, many RF methods provide schemes to select cell type number automatically, for example, by comparing the estimation error and the approximation error [48], or by AIC and BIC [20]. In our application to the Breast dataset, we use the “Est-DimIC” function provided by the RefFreeEWAS package and choose six cell types, which is in consistent with pre-vious analysis [10]. In addition, the selection of cell type numbers is dependent on sample size. As demonstrated in the simulation results, estimation accuracy is much lower for 6 cell types than 4 cell types with moderate sample sizes, even if the proposed method is applied. As a rec-ommendation, when sample size is small and RF method is needed, one should consider to combine similar cell types and decrease the cell type number specified in RF deconvolution.
In the evaluations of initial feature selection, we con-sider six sets of selections, the top 1000, 1001 to 2000, 2001 to 3000, 5001 to 6000, and 10,001 to 11,000 most variable features and 1000 randomly selected features. These results provide comprehensive evaluations of the robustness of TOAST. Regardless of the initial features, TOAST could improve the feature selection and subse-quently improve deconvolution accuracy.
The proposed method is primarily focused on microar-ray data (for gene expression or DNA methylation) in this work. However, the same principal is applicable for cell composition estimation in other data types, such as RNA-seq. Since the RF deconvolution method for RNA-seq is still underdeveloped, we did not test our functional-ity to deconvolve RNA-seq. Instead, we have evaluated our cross-cell type differential analysis method on RNA-seq data. We have designed a simulation study based on a real RNA-seq dataset [60] using Bioconductor package PROPER[61]. Detailed procedures of our RNA-seq sim-ulation study have been described in Additional file 1: Section S2. As demonstrated in Additional file1: Figure S17, TOAST is able to detect cross-cell type differential expressed genes (DEGs) with high accuracy (> 70% of the top ranked 1000 genes are true DEGs), which means TOAST is able to accurately select desired features from RNA-seq data.
methylation data. It is therefore important to follow the data preparation procedures suggested by those pack-ages. For example, BayesCCE suggested to incorporate methylation-altering covariates into the analysis [23], which has been shown to generate more biologically meaningful results in our real data applications.
TOAST also demonstrates favorable computationally performance since the feature selection step is based on linear regression. We have benchmarked TOAST on a lap-top computer with 4GB RAM and Intel Core i5 CPU. For a real gene expression dataset with 54,675 features and 100 samples, it takes less than 2 min to complete 30 iterations. For a real DNA methylation dataset with 459,226 features and 100 samples, it takes around 8 min to complete 30 iterations.
Finally, the proposed methods have some connections to SVA (Surrogate Variable Analysis) [62] and RUV (Remove Unwanted Variation) [63, 64]. Both RUV and SVA are targeting at the removal of “unwanted” variations or “undesired” confounding factors. For complex tissues, the cell compositions, which we are interested in, might be considered as unwanted variations under their con-text. All methods use some type of factor analysis (SVD for RUV and SVA, and NMF for TOAST), and the esti-mated “unwanted variations” (or proportions in our study) can be used for downstream analysis by including them as covariates in a linear model. One important distinc-tion in TOAST is the iterative feature selecdistinc-tion procedure, since SVA and RUV use a fixed set of features. From this perspective, an extension of SVA, the ISVA (Indepen-dent Surrogate Variable Analysis) [65], has more similarity to TOAST for its data-driven feature selection. However, ISVA identifies informative features through regressing observed data on each individual surrogate variable (SV). If the SVs contain proportion information, this approach can be considered as a special case of TOAST. Moreover, ISVA only performs one round of feature selection instead of iterating between feature selection and ICA (indepen-dent component analysis). This may not be ideal since we have shown that the iteration greatly improves the results.
Conclusion
We study the problem of feature selection in RF decon-volution for cellular composition estimation from high-throughput data of complex samples. We design an itera-tive algorithm, based on cross-cell type differential anal-ysis, that improves feature selection and subsequently proportion estimation. There are two advantages of the proposed methods. First, our algorithm is flexible enough to work with existing RF deconvolution methods. The applications to gene expression data and DNA methyla-tion data showcase this flexibility. Second, our current results show that only a few iterations (e.g., 30 itera-tions) can achieve good improvements, which means it
is computationally efficient. With the wide applications of RF deconvolution and the increasing needs of analyz-ing heterogeneous samples, we expect broad applications of the proposed method to microarray data and to other omics data as well.
Method and material Notations and model
We first provide a formal definition of the problem that most RF deconvolution algorithms try to solve. Denote the data generated from high-throughput experiments byY, aPby Nmatrix with rows representing features (genes, CpGs, etc.) and columns representing samples. AssumeY contains mixed signals fromK (assumed known) “pure” cell types. Most deconvolution methods seek the optimal solutions for matrix factorizationY = WH. Here refer-ence panelWis aPbyKmatrix, where thek-th column of Wis the profile of cell typek.His the mixture proportion matrix with dimensionK by N, each column represents the mixture proportions ofK cell types for each subject. Hhas a constraint that every column sums up to one. If the input is DNA methylation data, another constraint, in which elements ofWare bounded by 0 and 1, is added to the algorithm.His the variable of interests in this analysis. Using this notation, selecting high variable features is equivalent to selecting rows with highest variance Var(Yi·) = j(Yij − ¯Yi·)2, which contains contribu-tions from within-cell type variances (biological variation among samples for pure cell types), cross-cell type ances (mean differences among pure cell types), and vari-ation from the mixing proportions. As discussed in recent published studies [32,46], the good features for deconvo-lution are those with low within-cell type variation and high cross-cell type variation. If we select features solely based on variance of raw observations, features with high within-cell type variances could also be included, which will have negative impact on the RF deconvolution in later step.
Now we briefly introduce the method for cross-cell type differential analysis for data from mixed sample, which is a special case of our previously proposed method [45]. Assume the observed data for thep-th feature areYp =
[Yp1,Yp2,· · ·,YpN]T,p = 1,· · ·,P. Denote the propor-tions obtained for sample s are θs = (θs1,θs2,· · ·,θsK). With known proportions, the observed data can be mod-eled by a linear model:
E(Yp)=Vβp (1)
where V= ⎡ ⎢ ⎢ ⎢ ⎣
θ11 θ12 · · · θ1K
θ21 θ22 · · · θ2K ..
. ... ...
θN1 θN2 · · · θNK
⎤ ⎥ ⎥ ⎥ ⎦, βp=
⎡ ⎢ ⎢ ⎢ ⎣
μp1
μp2
.. . μpK ⎤ ⎥ ⎥ ⎥
Regression coefficientμpk represents the mean level for thep-th feature in thek-th cell type. Using this model, one can test the difference between cell typekversus other cell types in featurepby following hypothesis test:
H0:μpk− 1 K−1
i=k
μpi=0, k=1,· · ·,K. (3)
Features with significant test results are cell type-specific features.
The above linear model can be fit using ordinary least squares (OLS) method. We find that sometimes extremely small variance estimation can lead to undesirable results for some features. To overcome this problem, we impose a data-driven lower bound (10th quantile values of all estimated variances) to stabilize the variance estimates. Similar methods are widely used in popular tools for dif-ferential expression analysis which has been proven to have good results [66]. In addition, as all theμpi’s repre-sent the mean observation levels for each cell type, it may not be reasonable to have negative estimators. As such, we provide options to bound negative estimated parame-ters in the TOAST software. In our experiments, we find bounding negative estimators has minimum impact on the results due to the small proportions of negative estimators (e.g., less than 2% in RA data analysis).
With this method, we design the following iterative algorithm to improve feature selection in RF deconvolu-tion. The algorithm starts with a list of initial features, denoted as M0, which could be selected using
conven-tional methods, such as choosing the top variable fea-tures. In the “Initial feature selection” section, we have provided more discussion about this. Observed data for these features, denoted asYM0, are used as inputs for RF deconvolution to estimate mixture proportions. With the estimated proportions, we run cross-cell type differen-tial analysis on the whole observed dataYto detect cell type-specific features. In each iteration, the top features from this analysis with the same length asM0 are then
used for another round of RF deconvolution. In our soft-ware implementation, the function “DEVarSelect()” has an argument “nMarker” for users to specify the number of initial features and selected features in each iteration. The default value is 1000, as used throughout this paper. The feature selection and RF deconvolution are iterated for a number of times then stop. In the “Ending point of itera-tions selection” section, we have more discussions about choosing endpoint. The algorithm is summarized below.
Note that Algorithm 1 is not constrained to a specific deconvolution method, so most existing RF methods can be applied in conjunction with this procedure. For exam-ple in our simulation study and real data applications, we
Algorithm 1:Improve feature selection in RF decon-volution
Input: Y(observed data matrix) andK(number of cell types);
1. Select a list of initial featuresM0;
2. Conduct RF deconvolution onYM0withKcell types, whereYM0is a sub-matrix ofYand rows ofYM0 are the corresponding rows for features inM0.
InitializeH0by the estimated proportions;i=0; whileStopping criteria is not metdo
3.Hˆ =Hi;i=i+1;
4. Use proportionHˆ andYas inputs for cross-cell type differential analysis;
5. Construct a new feature listMiof the same length asM0containing the top cell type-specific
features for allKcell types;
6. Conduct RF deconvolution onYMiwhere the rows ofYMiare the corresponding rows ofYfor features inMi.Hi= estimated proportions; end
Output: Hi.
use RF algorithmdeconf [19] for gene expression microar-ray data and RefFreeEWAS [20] and BayesCCE [23] for DNA methylation microarray data.
The proposed algorithm guarantees the improvements of proportion estimations from two aspects. The first is that RF deconvolution performs better with more “cor-rect” or informative features. The second is that feature selection can be improved with more accurate estimated proportions. The first point has been empirically demon-strated by all our results and by discussions about feature selection in many RF deconvolution publications [23,36]. The latter point is a natural result from the measurement error model [67,68].
Simulation setting
We design two simulation studies based on real datasets, one for gene expression data and the other one for DNA methylation data, so that the simulation studies mimic the real data scenarios well.
cell type-specific mean and variance of each feature. In the second simulation study, the four cell types in the refer-ence panels are simulated from normal distributions, with cell type-specific means and variances estimated from the GEO dataset GSE35069 [26]. Note that GSE35069 has DNA methylation measurements for six types of purified blood cells (CD4T, CD8T, B-cell, Mono, Gran, NK, Gran). For our simulation study, we combined CD4T, CD8T, and NK to one pseudo-cell type when estimating the cell type-specific mean and variance of each feature. In the “Impact of number of cell types in the mixture” section, we explore the impacts of using 6 cell types to deconvolve observed signals versus using 4 cell types.
After subject-specific reference panels are generated, the simulated pure cell types are manually mixed using known mixture proportions, which are simu-lated from a Dirichlet distribution with parameters
(0.968, 4.706, 0.496, 0.347) for four-cell type setting or
(0.89, 4.12, 0.47, 0.33, 0.61, 1.02) for six-cell type setting. Randomly simulated measurement errors are added to the mixed signals. For all settings, results are summarized over 100 Monte Carlo datasets.
Evaluation metrics
We calculated a number of metrics to evaluate the pro-posed method. First, we compute the correlations and biases for comparison between estimated and true pro-portions. Correlations with true proportions is widely used in almost all studies that involve evaluating the deconvolution performance [14, 17,20,24]. Specifically, we calculate:
Corr with true prop=diag(r(H,Hˆ)) (4)
wherer(·)represents the Pearson correlation anddiag(·) is the diagonal operation extracting the diagonal elements from the variance-covariance matrix. RMSBias is the root mean squared bias of the estimated versus the true pro-portions, i.e.,
RMSBias= (H− ˆH)2/KN. (5)
Number of overlaps between selected and cell type-specific markers is to evaluate the agreement between our selected markers, and the best markers can be chosen if pure tissue profiles are known. The cell type-specific markers are selected by the largest log fold changes of the cell type-specific value against the mean value of other cell types, iterating over all cell types (details presented in Additional file 1: Section S1). Higher overlap usually leads to better proportion estimation.
Goodness-of-fit score is the Pearson correlation of real observations and fitted values from the RF deconvolution results, which we find is a metric especially suitable when
true proportions are unknown [27]. Briefly, for estimated basis matrixWˆ and cell proportionsHˆ, the reconstructed observation isYˆ = ˆWHˆ. Goodness of fit is defined as:
Goodness of fit=r(vec(Y),vec(Yˆ)). (6)
vec(·)is the vectorization operation.
RMSE is also a widely used metrics calculated by the root mean squared error between the estimated and true proportions, i.e.,
RMSE= (Y− ˆY)2/PN. (7)
Datasets
All the six datasets used in the study are publically avail-able and can be downloaded from the Gene Expression Omnibus (GEO): Mouse-Mix data by Shen-Orr et al. [8] (accession GSE19830), Immune data by Abbas et al. [14] (accession GSE11058), EPIC (European Prospective Investigation into Cancer and Nutrition) data by Riboli et al. [49] (accession GSE51032), Aging data by Hannum et al. [50] (accession GSE40279), RA (Rheumatoid Arthri-tis) data by Liu et al. [51] (accession GSE42861), and Breast data [10] (accession GSE88883). The purified blood cell profiles are obtained from the R/Bioconductor pack-age FlowSorted.Blood.450k and are originally obtained by Reinius et al. [26]. After the preprocessed data are downloaded from GEO, RMA are used to normalize gene expression data and quantile normalization are used to normalize the DNA methylation data.
Implementation of the reference-free methods
We use the ged function from R package CellMix[69], downloaded from GitHub (https://github.com/rforge/ cellmix/tree/master/pkg), for the deconf algorithm [19] implementation. We use the RefFreeCellMix function from R packageRefFreeEWAS[20] which is obtained from its CRAN page (https://cran.r-project.org/web/packages/ RefFreeEWAS/index.html). The BayesCCE Matlab tool-box is downloaded from GitHub (https://github.com/ cozygene/BayesCCE). In order to incorporate BayesCCE with our algorithm, we call the matlab function from R using theR.matlabpackage [70].
When implementing BayesCCE, we set parametersk= 6 andd= 10 and select the initial variables with ReFACTor as recommended in the BayesCCE paper. In addition to high-throughput data matrix, BayesCCE accepts known patient phenotype information. We accounted for age and gender for all analyzed DNA methylation, EPIC, Aging, and RA data. We also accounted for the smoking status when analyzing the RA data. For the prior information of cell proportions used in BayesCCE, we use the true parameter values in generating simulation proportions
when evaluating BayesCCE in simulation study. In real data analysis with blood samples, we use the parameter
(15.0727, 1.8439, 2.5392, 1.7934, 0.7240, 0.7404) for gran-ulocytes, monocytes, CD4+, CD8+, B cells, and NK cells provided by the BayesCCE paper and originally obtained from the Perioperative Medicine at UCLA’s perioperative data warehouse (PDW) [71].
Additional files
Additional file 1:Supplementary Section S1 (Procedures to obtain cell type-specific features in simulation study); Section S2 (Simulation study for RNA-seq data); Figure S1-S17. (PDF 1526 kb)
Additional file 2:Review history. (DOCX 961 KB)
Acknowledgements
We thank Yijian Eugene Huang, Hao Feng, and Yunxiao Li for their helpful discussions during manuscript preparation and revision. We also thank the editor and three anonymous reviewers who provided constructive comments to improve the manuscript.
Review history
The review history is available as Additional file2.
Authors’ contributions
HW and ZL designed the method, performed the simulation studies and real data analyses, and wrote the manuscript. Both authors read and approved the final manuscript.
Funding
This project was partially supported by National Institutes of Health (R01GM122083 to HW and ZL, P01NS097206 and U01MH116441 to HW) and Emory University WHSC 2018 Synergy Award to HW.
Availability of data and materials
The datasets analyzed in this study are available from the Gene Expression Omnibus (GEO) repository under the following accession numbers: GSE19830 [8], GSE88883 [10], GSE11058 [14], GSE51032 [49], GSE40279 [50], and GSE42861[51]. TOAST is a Bioconductor package with license GPL-2 available athttps://bioconductor.org/packages/TOAST.
Ethics approval and consent to participate No applicable.
Competing interests
The authors declare that they have no competing interests.
Received: 24 April 2019 Accepted: 30 July 2019
References
1. Bennett DA, Schneider JA, Buchman AS, de Leon CM, Bienias JL, Wilson RS. The rush memory and aging project: study design and baseline characteristics of the study cohort. Neuroepidemiology. 2005;25(4): 163–75.
2. Weinstein JN, Collisson EA, Mills GB, Shaw KRM, Ozenberger BA, Ellrott K, Shmulevich I, Sander C, Stuart JM, Network CGAR, et al. The cancer genome atlas pan-cancer analysis project. Nat Genet. 2013;45(10):1113. 3. Kamme F, Salunga R, Yu J, Tran D-T, Zhu J, Luo L, Bittner A, Guo H-Q, Miller N, Wan J, et al. Single-cell microarray analysis in hippocampus ca1: demonstration and validation of cellular heterogeneity. J Neurosci. 2003;23(9):3607–15.
4. Jaffe AE, Irizarry RA. Accounting for cellular heterogeneity is critical in epigenome-wide association studies. Genome Biol. 2014;15(2):31.
5. Zheng X, Zhang N, Wu H-J, Wu H. Estimating and accounting for tumor purity in the analysis of dna methylation data from cancer studies. Genome Biol. 2017;18(1):17.
6. Guintivano J, Aryee MJ, Kaminsky ZA. A cell epigenotype specific model for the correction of brain cellular heterogeneity bias and its application to age, brain region and major depression. Epigenetics. 2013;8(3):290–302. 7. Westra H-J, Arends D, Esko T, Peters MJ, Schurmann C, Schramm K,
Kettunen J, Yaghootkar H, Fairfax BP, Andiappan AK, et al. Cell specific eQTL analysis without sorting cells. PLoS Genet. 2015;11(5):1005223. 8. Shen-Orr SS, Tibshirani R, Khatri P, Bodian DL, Staedtler F, Perry NM,
Hastie T, Sarwal MM, Davis MM, Butte AJ. Cell type–specific gene expression differences in complex tissues. Nat Methods. 2010;7(4):287. 9. Johnson KC, Houseman EA, King JE, Von Herrmann KM, Fadul CE,
Christensen BC. 5-hydroxymethylcytosine localizes to enhancer elements and is associated with survival in glioblastoma patients. Nat Commun. 2016;7:13177.
10. Johnson KC, Houseman EA, King JE, Christensen BC. Normal breast tissue dna methylation differences at regulatory elements are associated with the cancer risk factor age. Breast Cancer Res. 2017;19(1):81. 11. Chen Y, Armstrong DA, Salas LA, Hazlett HF, Nymon AB, Dessaint JA,
Aridgides DS, Mellinger DL, Liu X, Christensen BC, et al. Genome-wide DNA methylation profiling shows a distinct epigenetic signature associated with lung macrophages in cystic fibrosis. Clin Epigenetics. 2018;10(1):152.
12. Schmitz B, Radbruch A, Kümmel T, Wickenhauser C, Korb H, Hansmann M, Thiele J, Fischer R. Magnetic activated cell sorting (MACS)—a new immunomagnetic method for megakaryocytic cell isolation: comparison of different separation techniques. Eur J Haematol. 1994;52(5):267–75. 13. Basu S, Campbell HM, Dittel BN, Ray A. Purification of specific cell
population by fluorescence activated cell sorting (facs). J Visualized Exp JoVE. 2010;41:e1546.
14. Abbas AR, Wolslegel K, Seshasayee D, Modrusan Z, Clark HF. Deconvolution of blood microarray data identifies cellular activation patterns in systemic lupus erythematosus. PloS ONE. 2009;4(7):6098. 15. Clarke J, Seo P, Clarke B. Statistical expression deconvolution from mixed
tissue samples. Bioinformatics. 2010;26(8):1043–9.
16. Gong T, Hartmann N, Kohane IS, Brinkmann V, Staedtler F, Letzkus M, Bongiovanni S, Szustakowski JD. Optimal deconvolution of transcriptional profiling data using quadratic programming with application to complex clinical blood samples. PloS ONE. 2011;6(11):27156.
17. Newman AM, Liu CL, Green MR, Gentles AJ, Feng W, Xu Y, Hoang CD, Diehn M, Alizadeh AA. Robust enumeration of cell subsets from tissue expression profiles. Nat Methods. 2015;12(5):453.
18. Brunet J-P, Tamayo P, Golub TR, Mesirov JP. Metagenes and molecular pattern discovery using matrix factorization. Proc Natl Acad Sci. 2004;101(12):4164–9.
19. Repsilber D, Kern S, Telaar A, Walzl G, Black GF, Selbig J, Parida SK, Kaufmann SH, Jacobsen M. Biomarker discovery in heterogeneous tissue samples-taking the in-silico deconfounding approach. BMC
Bioinformatics. 2010;11(1):27.
20. Houseman EA, Molitor J, Marsit CJ. Reference-free cell mixture adjustments in analysis of dna methylation data. Bioinformatics. 2014;30(10):1431–9.
21. Assenov Y, Müller F, Lutsik P, Walter J, Lengauer T, Bock C. Comprehensive analysis of dna methylation data with RnBeads. Nat Methods. 2014;11(11):1138.
22. Houseman EA, Kile ML, Christiani DC, Ince TA, Kelsey KT, Marsit CJ. Reference-free deconvolution of dna methylation data and mediation by cell composition effects. BMC Bioinformatics. 2016;17(1):259.
23. Rahmani E, Schweiger R, Shenhav L, Wingert T, Hofer I, Gabel E, Eskin E, Halperin E. BayesCCE: a Bayesian framework for estimating cell-type composition from dna methylation without the need for methylation reference. Genome Biol. 2018;19(1):141.
24. Teschendorff AE, Breeze CE, Zheng SC, Beck S. A comparison of reference-based algorithms for correcting cell-type heterogeneity in epigenome-wide association studies. BMC Bioinformatics. 2017;18(1):105. 25. Zheng SC, Beck S, Jaffe AE, Koestler DC, Hansen KD, Houseman AE,
26. Reinius LE, Acevedo N, Joerink M, Pershagen G, Dahlén S-E, Greco D, Söderhäll C, Scheynius A, Kere J. Differential DNA methylation in purified human blood cells: implications for cell lineage and studies on disease susceptibility. PloS ONE. 2012;7(7):41361.
27. Vallania F, Tam A, Lofgren S, Schaffert S, Azad TD, Bongen E, Haynes W, Alsup M, Alonso M, Davis M, et al. Leveraging heterogeneity across multiple datasets increases cell-mixture deconvolution accuracy and reduces biological and technical biases. Nat Commun. 2018;9(1):4735. 28. Moss J, Magenheim J, Neiman D, Zemmour H, Loyfer N, Korach A,
Samet Y, Maoz M, Druid H, Arner P, et al. Comprehensive human cell-type methylation atlas reveals origins of circulating cell-free DNA in health and disease. Nat Commun. 2018;9(1):5068.
29. Yousefi P, Huen K, Quach H, Motwani G, Hubbard A, Eskenazi B, Holland N. Estimation of blood cellular heterogeneity in newborns and children for epigenome-wide association studies. Environ Mol Mutagen. 2015;56(9):751–8.
30. Rahmani E, Zaitlen N, Baran Y, Eng C, Hu D, Galanter J, Oh S, Burchard EG, Eskin E, Zou J, et al. Correcting for cell-type heterogeneity in dna methylation: a comprehensive evaluation. Nat Methods. 2017;14(3):218. 31. Titus AJ, Way GP, Johnson KC, Christensen BC. Deconvolution of dna
methylation identifies differentially methylated gene regions on 1p36 across breast cancer subtypes. Sci Rep. 2017;7(1):11594.
32. Feng H, Jin P, Wu H. Disease prediction by cell-free DNA methylation. Brief Bioinform. 2018;20(2):585–97.
33. Sun K, Jiang P, Chan KA, Wong J, Cheng YK, Liang RH, Chan W-k, Ma ES, Chan SL, Cheng SH, et al. Plasma DNA tissue mapping by genome-wide methylation sequencing for noninvasive prenatal, cancer, and transplantation assessments. Proc Natl Acad Sci. 2015;112(40):5503–12. 34. Li B, Severson E, Pignon J-C, Zhao H, Li T, Novak J, Jiang P, Shen H,
Aster JC, Rodig S, et al. Comprehensive analyses of tumor immunity: implications for cancer immunotherapy. Genome Biol. 2016;17(1):174. 35. Teschendorff AE, Relton CL. Statistical and integrative system-level
analysis of dna methylation data. Nat Rev Genet. 2018;19(3):129. 36. Rahmani E, Zaitlen N, Baran Y, Eng C, Hu D, Galanter J, Oh S, Burchard
EG, Eskin E, Zou J, et al. Sparse pca corrects for cell type heterogeneity in epigenome-wide association studies. Nat Methods. 2016;13(5):443. 37. Van’t Veer LJ, Dai H, Van De Vijver MJ, He YD, Hart AA, Mao M, Peterse
HL, Van Der Kooy K, Marton MJ, Witteveen AT, et al. Gene expression profiling predicts clinical outcome of breast cancer. Nature. 2002;415(6871):530.
38. Wang X, Laird PW, Hinoue T, Groshen S, Siegmund KD. Non-specific filtering of beta-distributed data. BMC Bioinformatics. 2014;15(1):199. 39. Zhuang J, Widschwendter M, Teschendorff AE. A comparison of feature
selection and classification methods in DNA methylation studies using the Illumina Infinium platform. BMC Bioinformatics. 2012;13(1):59. 40. Liebner DA, Huang K, Parvin JD. MMAD: microarray microdissection with
analysis of differences is a computational tool for deconvoluting cell type-specific contributions from tissue samples. Bioinformatics. 2013;30(5):682–9.
41. Everson TM, Punshon T, Jackson BP, Hao K, Lambertini L, Chen J, Karagas MR, Marsit CJ. Cadmium-associated differential methylation throughout the placental genome: epigenome-wide association study of two us birth cohorts. Environ Health Perspect. 2018;126(1):017010. 42. Kaushal A, Zhang H, Karmaus WJ, Ray M, Torres MA, Smith AK, Wang
S-L. Comparison of different cell type correction methods for genome-scale epigenetics studies. BMC Bioinformatics. 2017;18(1):216. 43. Gaujoux R, Seoighe C. Semi-supervised nonnegative matrix factorization
for gene expression deconvolution: a case study. Infect Genet Evol. 2012;12(5):913–21.
44. Gasparoni G, Bultmann S, Lutsik P, Kraus TF, Sordon S, Vlcek J, Dietinger V, Steinmaurer M, Haider M, Mulholland CB, et al. DNA methylation analysis on purified neurons and glia dissects age and Alzheimer’s disease-specific changes in the human cortex. Epigenetics Chromatin. 2018;11(1):41.
45. Li Z, Wu Z, Jin P, Wu H. Dissecting differential signals in high-throughput data from complex tissues. Bioinformatics. 2019.https://doi.org/10.1093/ bioinformatics/btz196.
46. Wang X, Park J, Susztak K, Zhang NR, Li M. Bulk tissue cell type deconvolution with multi-subject single-cell expression reference. Nat Commun. 2019;10(1):380.
47. Rahmani E, Yedidim R, Shenhav L, Schweiger R, Weissbrod O, Zaitlen N, Halperin E. Glint: a user-friendly toolset for the analysis of high-throughput DNA-methylation array data. Bioinformatics. 2017;33(12):1870–2. 48. Lutsik P, Slawski M, Gasparoni G, Vedeneev N, Hein M, Walter J.
Medecom: discovery and quantification of latent components of heterogeneous methylomes. Genome Biol. 2017;18(1):55.
49. Riboli E, Hunt K, Slimani N, Ferrari P, Norat T, Fahey M, Charrondiere U, Hemon B, Casagrande C, Vignat J, et al. European prospective investigation into cancer and nutrition (epic): study populations and data collection. Public Health Nutr. 2002;5(6b):1113–24.
50. Hannum G, Guinney J, Zhao L, Zhang L, Hughes G, Sadda S, Klotzle B, Bibikova M, Fan J-B, Gao Y, et al. Genome-wide methylation profiles reveal quantitative views of human aging rates. Mol Cell. 2013;49(2):359–67. 51. Liu Y, Aryee MJ, Padyukov L, Fallin MD, Hesselberg E, Runarsson A,
Reinius L, Acevedo N, Taub M, Ronninger M, et al. Epigenome-wide association data implicate dna methylation as an intermediary of genetic risk in rheumatoid arthritis. Nat Biotechnol. 2013;31(2):142.
52. Hidaka T, Suzuki K, Matsuki Y, Takamizawa-Matsumoto M, Okada M, Ishizuka T, Kawakami M, Ohsuzu F. Changes in cd4+ t lymphocyte subsets in circulating blood and synovial fluid following filtration leukocytapheresis therapy in patients with rheumatoid arthritis. Ther Apher. 1999;3(2):178–85.
53. Kikuchi J, Hashizume M, Kaneko Y, Yoshimoto K, Nishina N, Takeuchi T. Peripheral blood cd4+ cd25+ cd127 low regulatory t cells are significantly increased by tocilizumab treatment in patients with rheumatoid arthritis: increase in regulatory t cells correlates with clinical response. Arthritis Res Ther. 2015;17(1):10.
54. Affleck G, Tennen H, Keefe FJ, Lefebvre JC, Kashikar-Zuck S, Wright K, Starr K, Caldwell DS. Everyday life with osteoarthritis or rheumatoid arthritis: independent effects of disease and gender on daily pain, mood, and coping. PAIN®. 1999;83(3):601–9.
55. Kvien TK. Epidemiology and burden of illness of rheumatoid arthritis. Pharmacoeconomics. 2004;22(1):1–12.
56. Ahlmén M, Svensson B, Albertsson K, Forslind K, Hafström I. Influence of gender on assessments of disease activity and function in early rheumatoid arthritis in relation to radiographic joint damage. Ann Rheum Dis. 2010;69(01):230–3.
57. Network CGAR, et al. Comprehensive genomic characterization defines human glioblastoma genes and core pathways. Nature. 2008;455(7216): 1061.
58. De Jager PL, Srivastava G, Lunnon K, Burgess J, Schalkwyk LC, Yu L, Eaton ML, Keenan BT, Ernst J, McCabe C, et al. Alzheimer’s disease: early alterations in brain dna methylation at ank1, bin1, rhbdf2 and other loci. Nat Neurosci. 2014;17(9):1156.
59. Montaño CM, Irizarry RA, Kaufmann WE, Talbot K, Gur RE, Feinberg AP, Taub MA. Measuring cell-type specific differential methylation in human brain tissue. Genome Biol. 2013;14(8):94.
60. Linsley PS, Speake C, Whalen E, Chaussabel D. Copy number loss of the interferon gene cluster in melanomas is linked to reduced t cell infiltrate and poor patient prognosis. PloS ONE. 2014;9(10):109760.
61. Wu H, Wang C, Wu Z. Proper: comprehensive power evaluation for differential expression using RNA-seq. Bioinformatics. 2014;31(2):233–41. 62. Leek JT, Storey JD. Capturing heterogeneity in gene expression studies
by surrogate variable analysis. PLoS Genet. 2007;3(9):161. 63. Gagnon-Bartsch JA, Speed TP. Using control genes to correct for
unwanted variation in microarray data. Biostatistics. 2012;13(3):539–52. 64. Risso D, Ngai J, Speed TP, Dudoit S. Normalization of rna-seq data using
factor analysis of control genes or samples. Nat Biotechnol. 2014;32(9):896. 65. Teschendorff AE, Zhuang J, Widschwendter M. Independent surrogate
variable analysis to deconvolve confounding factors in large-scale microarray profiling studies. Bioinformatics. 2011;27(11):1496–505. 66. Tusher VG, Tibshirani R, Chu G. Significance analysis of microarrays
applied to the ionizing radiation response. Proc Natl Acad Sci. 2001;98(9): 5116–21.
67. Gleser LJ. Estimation in a multivariate “errors in variables” regression model: large sample results. Ann Stat. 1981;9(1):24–44.
68. Abel AB. Classical measurement error with several regressors. Tech Rep. 2017. Tech Rep) Working Paper.
70. Bengtsson H. R.matlab: Read and Write MAT Files and Call MATLAB from Within R.https://github.com/HenrikBengtsson/R.matlab. R package. 2018;3(6.1):9000.
71. Hofer IS, Gabel E, Pfeffer M, Mahbouba M, Mahajan A. A systematic approach to creation of a perioperative data warehouse. Anesth Analg. 2016;122(6):1880–4.
Publisher’s Note