Technology (IJRASET)
Analysis of Liquefaction Prone Area in India and
Its Remediation
Arpit Kochar1, Ankit Agrawal2, Abhishek Raj Sachan3
1,3
Civil Engineering Department, VIT University
Abstract— “Liquefaction” A major cause of structural damage during earthquake. As one the most hazardous event is discussed, certain analysis for soil are to be performed to understand the behavior of soil and its stability towards such actions on different sites and determining the liquefaction susceptibility. On the basis of different parameters and liquefaction susceptibility on which soil strength is considered certain Ground Improvement Techniques (GIT) are used for Chandigarh, Kolkata, Orissa, Lucknow, Gandhinagar, Vijaywada, Delhi, Vishakhapatnam, Pushkar, Bhuj and Kutch accordingly. In this paper the designing of counter measures for remediation of liquefaction with precautionary measures is being done. The objective is to take one of the Ground Improvement Techniques accordingly to overcome the chances of liquefaction for the each particular type of soil. The important constraints that are to be self-addressed is Economical, sustainable and to be socially acceptable.
Keywords—Liquefaction, Susceptibility, Ground Improvement Technique, Remediation.
I. INTRODUCTION
The state of 'soil liquefaction' happens once the effective stress of soil is reduced to primarily zero that corresponds to an entire loss of shear strength of the soil. This could be initiated either by monotonic loading or cyclic loading. In a very saturated loose state of soil which can generate vital pore water pressure on application of load are most likely to liquefy. This happens in loose soil that has the tendency to compress once sheared, generating large excess pore water pressure as load is transferred from the soil skeleton to adjacent pore water throughout undrained loading. As pore water pressure rises a significant loss of strength of the soil happens since the effective stress is reduced. This mainly occurs generally in non-plastic silt soils or sandy soils. However in rare cases it may occur in clay and gravels. The main goal of most soil improvement techniques used for reducing liquefaction hazards is to avoid large increases in pore water pressure during earthquake shaking. This can be achieved by densification of the soil or improvement of its drainage capacity.
A. Remediation
Several compaction techniques are developed to resist liquefaction in loose saturated granular soils. In this paper Dynamic compaction (DC) and Vibro-stone column (SC) techniques are used. Soil deposits densified by DC and SC are better in resisting liquefaction, and have performed well throughout earthquakes. In these improvement techniques, the recurrent ground vibrations induced by the DC and moving probe cause an increase in pore water pressures and resultant soil consolidation, leading to a densely packing. These techniques will also increase the lateral confining stresses within the soil. Hence, the soil resistance capacity to liquefaction will increase. Therefore, it's potential to style ground enhancements needed to resist liquefaction on the idea of earthquake energy and energy delivered by DC and other probes. Further potential to see the improvement in density of the soil attributable to recurrent applications of dynamic compaction and vibro-probe insertions.
II. METHODOLOGYANDDESIGNAPPROACH
Collect bore log investigations reports of the liquefaction prone areas with high earthquake prone zone. Calculation of liquefaction susceptibility at each depth of the soil bore log is carried out with the help of N-values, fines content and other necessary data. The seismic zone of that particular location using (IS 1893-1 (2002)) is determined. Using the zone, determine the value of ground peak acceleration (amax). All results are based on the earthquake magnitude of 7.5. Further correction can be done for different earthquake
magnitude. Determine the depth of ground water table and other data like unit weight etc. Determine the Initial stresses that includes pore water pressure, effective stress and total stress. Calculate the stress reduction factor (rd). Also calculate the value of Cyclic
Technology (IJRASET)
CRR/CSR. If FOS greater than 1, no liquefaction susceptible and if FOS less than 1, liquefaction susceptible. The sites are analyzed according to their liquefaction susceptibility up to certain depths. According to those certain depths suitable remedial measure is used for that site. For shallow depth, dynamic compaction using Lukas (1986, 1995) method and for deep depth, stone column using Heinz J. Priebes method is being used.
III. ANALYSISOFLIQUEFACTIONPRONEAREAS
A. Calculation Of CSR And CRR Values
1) CSR: Seismic demand on a soil layer based on a peak ground surface acceleration and associated moment magnitude By referring seed and idris 1971.
CSR = 0.65 x (amax /g) x (σ /σ’) x rd
where,
amax = peak horizontal acceleration at the ground surface generated by the earthquake (From (IS 1893-1 (2002))
g = acceleration due to gravity σ = total vertical overburden stress σ’ = effective vertical overburden stress
rd = stress reduction coefficient (flexibility of the soil)
=1- 0.015 Z (From (IS 1893-1 (2002))
2) CRR: Cyclic resistance ratio (mainly depends on corrected SPT-N value and percentage fines
1 60
7.5 2
1 60 1 60
( )
1 50 1
34 ( ) 135 [10.( ) 45] 200
N CRR
N N
Where,
(N1)60 = Corrected N value (collected from bore log reports)
Factor of safety (FOR)-
FOS = CRR / CSR If , FOS > 1 = No liquefaction
FOS < 1 = Liquefaction
B. Example Calculations
1) Calculation For CSR:
CSR = 0.65 x (amax /g) x (σ / σ’) x rd
rd = 1- 0.015 Z (for z=1.5)
= 0.9775
amax /g = 0.24 (for Delhi IS 1893-1 (2002)
σ = γz
= 18.6 x 1.5
= 27.9 kPa (γ = 18.6 from bore log report Delhi) u = 0, σ = σ’ = 27.9 kPa
CSR = 0.15
Technology (IJRASET)
CRR = 0.07 (after overburden correction)Factor of Safety = CRR/CSR = 0.45
[image:4.612.164.449.137.453.2]Similarly, Calculations are carried for Gandhinagar, Pushkar, Kutch, Bhuj and Lucknow and following analysis has been made. TABLE 1: LIQUEFACTION SUSCEPTIBILITY FOR DIFFERENT SITES
SITE ZONE REMARKS
CHANDIGARH IV
NOT LIQUEFACTION SUSCEPTIBLE
KOLKATA III
NOT LIQUEFACTION SUSCEPTIBLE
ORISSA II
NOT LIQUEFACTION SUSCEPTIBLE
LUCKNOW III
LIQUEFACTION SUSCEPTIBLE
GANDHINAGAR III
NOT LIQUEFACTION SUSCEPTIBLE
VIJAYWADA III
NOT LIQUEFACTION SUSCEPTIBLE
DELHI IV
LIQUEFACTION SUSCEPTIBLE
VISHAKAPATNAM II
NOT LIQUEFACTION SUSCEPTIBLE
PUSHKAR II
NOT LIQUEFACTION SUSCEPTIBLE
BHUJ V
LIQUEFACTION SUSCEPTIBLE
KUTCH V
LIQUEFACTION SUSCEPTIBLE
IV. DESIGNOFCOUNTERMEASURESFORREMEDIATIONOFLIQUEFACTION
A. Stone Column
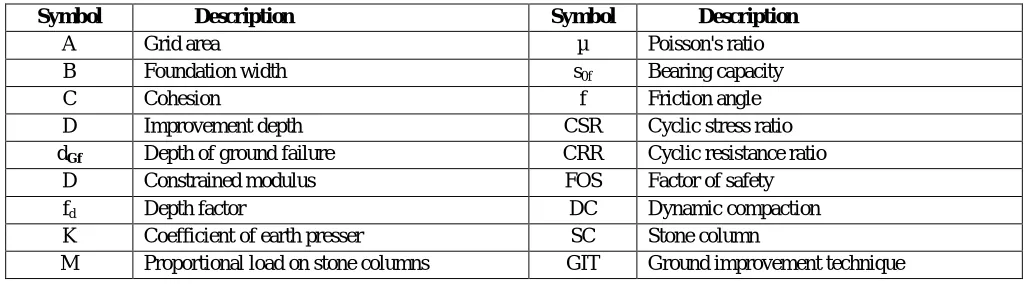
[image:4.612.49.565.586.728.2]The stone columns act as reinforcements increasing the stiffness of the improved ground and reducing the magnitude of shear stress caused in the improved soil because of an earthquake. The placing of the probe also causes an increase in lateral stresses in highly permeable soil in the ground. The induced pore pressures also drain through the stone columns during an earthquake. Above processes reduce the liquefaction potential of the ground. Previous studies indicates that sandy soils improved using vibratory stone columns have performed well during earthquakes.
TABLE 2: ABBRIVIATION’S
Symbol Description Symbol Description
A Grid area µ Poisson's ratio
B Foundation width s0f Bearing capacity
C Cohesion f Friction angle
D Improvement depth CSR Cyclic stress ratio
dGf Depth of ground failure CRR Cyclic resistance ratio
D Constrained modulus FOS Factor of safety
fd Depth factor DC Dynamic compaction
K Coefficient of earth presser SC Stone column
Technology (IJRASET)
N Improvement factor rd Stress reduction coefficient
P Area load resp. foundation pressure g Acceleration due to gravity
S Settlement σ Total vertical overburden stress
A Reduction factor in earthquake design σ’ Effective vertical overburden stress
G Unit weight (N1)60 Corrected N value
ɳ Safety against ground failure CN Correction factor
B. Design Of Stone Columns Using Heinz J. Priebe Method
Determination of the Basic Improvement Factor n0:
(1
).(1
/ )
(
,
/ )
1 2
/
s C
s C
s C
A
A
f
A
A
A
A
µs = 0.33
Column Diameter = 0.75m Ac = 0.785x0.75x0.75 = 0.44 m2
Footing = 1.5m X 1.5m A = 1.5x1.5 = 2.25 m2
F (µs, AC/A) = 1.01
, 0
,
1/ 2
(
/ )
1
.
1
. (
/ )
s C c
ac s C
f
A
A
A
n
A
K
f
A
A
2 0tan (45
/ 2)
ac c
K
C = 400
Kac = 0.22
Now calculate final improvement factor n1:
n1 = fd × n0
0 0 1 / 1 . d
c s c c c c
f
K W W W
K P
1
/
/
c c c c sP
P
A
A
A
A
p
p
1 / 2
(
,
/ )
. (
,
/ )
c s c
s ac s c
P
f
A
A
P
K
f
A
A
( .
)
c cW
d
( .
)
s s
W
d
1 sin
oC c
K
Δd = 1.5 m WC = 20*1.5 = 30 kN/m2
WS = 18.5*1.5 = 27.75 kN/m2
= 6.89 P = γS.d = 27.75 kN/m2
PC = 88.86
Technology (IJRASET)
fd = 2.13n1 = 4.58
2
.
.
sd
s
p
D n
s∞ = 0.76 m
0f
( .
c N v
s c.
cq N v
.
d.
d s. .
b N v b b
b. ). /
b
cS = 20 kN/m2 (constant from paper on liquefaction hazard assessment by KS Rao)
σof = 141.75 kN/m2
Factor of Safety = σ0f / (γS d)
= 5.11 Since factor of safety is greater than one, hence safe against liquefaction
C. Designed Specification Of Stone Column
Column Diameter : 0.75m
Equivalent Diameter : 1.05 X Spacing [7] Footing : 1.5m X 1.5m
Pattern : Triangular Arrangement Spacing b/w column : 2-3m Treatment depth : Delhi – 12m
C. Dyanamic Compaction
Dynamic compaction is one amongst the foremost easy and economically enticing densification techniques used for liquefaction hazard mitigation of saturated loose cohesion less soils with very little or no fines content within the field. Ground improvement and soil densification is achieved by repeated process of high impact energy at the site. The energy is applied by over and over raising and dropping a pounder with a mass varying from 5-35 tons from heights varying from 10-40 m on a pre-designed impact grid at 4-15 m of spacing. Due to ground vibrations, the soil around the impact zone densifies and also this induces an increase in pore water pressure in saturated loose soils which results in denser arrangement of particles. This works well for clean sand sites and undeveloped areas. Since the energy is applied at the ground surface, the improvement depths are limited because of energy radiation and attenuation with depth.
Calculations for Dynamic Compaction using Lukas (1986, 1995)
1) Calculation : Depth of influence: dmax = n*(WH)^0.5
= 0.35*(25*15) ^0.5 = 6.77 m Where,
dmax – depth of influence,
W- The dropped weight in tons H- The height of drop in m
Technology (IJRASET)
Energy imparted:Eavg = (N1*W*H*P)/ (S2*dmax)
= (10*25*15*3)/ (25*10.5) = 42.85 KJ/m3 Where,
N1 -Number of impacts per location (typically 7 to 15 impacts),
P - Number of passes, and
S - Grid impact spacing typically,
2) Designed Specification Of Dynamic Compaction:
Weight of hammer – 25 tones Height of drop – 15 m
No. of impacts per location – 10 No. of passes – 3
Diameter of pounder – 2.5m
[image:7.612.180.432.402.657.2]Grid impact spacing – 1.5 to 2.5 times pounder diameter Depth of influence – 6.77 m
TABLE 3: ANALYSIS OF LIQUEFACTION SUSCEPTIBILITY AT DELHI SITE.
S.n o
Factors Dynamic compaction Stone column 1 Depth of
influence
3-7m Above 12m
2 Site Not valid for populated or fully developed areas
ANY
4 Workmans hip
Labor Highly
Skilled 5 Failures The soils that are
below the water table have to be treated carefully
Bulging (general/loc al/punching )
6 Environme ntal
Causes pollution by making noise, gusts of air, vibration and permanent deformation of the soil.
Eco-Friendly
Technology (IJRASET)
TABLE 4: COMPARISON OF DYNAMIC COMPACTION AND STONE COLUMN
D. Summary
The project is based on the liquefaction and its counter measures using Ground Improvement Techniques (GIT) where the basic need of end users is care and safety of lives and property. The client needs is to get the information about the safety of their lives and property by correspondingly taking certain measures to prevent such hazardous actions using proper guidelines for that region to build their homes and other livelihood. Most parts of India are prone to earthquakes. Potential for initiation of liquefaction is assessed, for different sites in India, by Cyclic Stress approach. On the basis of different parameters on which soil strength is considered, ground Improvement techniques are used as counter measure to liquefaction.
The sites were analyzed for liquefaction using the SPT (Standard Penetration Test). For the different sites undertaken the best suitable and efficient counter measure has being designed. Counter measures are provided based on the various factors i.e. soil characteristics, depth of active zone, earthquake zone, magnitude of earthquake etc. The remedial are Stone column for deep active zone and dynamic compaction for shallow depth. Those measures were selected on the basis of three realistic constraints that are Social, Economic and Sustainable.
V. CONCLUSIONS
The analysis is carried out on four liquefaction susceptible sites and the suitable remediation is designed for each site. The two sites with less deep active zone around 6m are remediated through dynamic compaction with specifications as above mentioned. The other two sites active zone extending up to around 18m is remediated through vibro stone columns with specifications. Sites are being improved in its bearing capacity and the settlement is also reduced by remediation's.
REFERENCES
[1] Ashoka Buildcon limited (2010), “Soil investigation for sambhalpur-bargarh section of nh-6 0.00-88.00” (Orissa).
[2] Arun Soil Labs Pvt. Ltd, “Seismic site characterization of Lucknow urban centre with studies of site response and liquefaction hazard for ministry of earth sciences, government of India”.
[3] Andrews, D.C.A. (1998). “Liquefaction of silty soils: susceptibility, deformation, and remediation” PhD Dissertation, Dept. of Civil Eng., USC, CA.
[4] Casagrande,A (1976). "Liquefaction and cyclic deformation of sands: A critical review". Harvard Soil Mechanics Series No. 88.
[5] Chakrabortty P, Pandey A.D., Mukerjee S., Bhargava A,(2004) “Liquefaction Assessment for Microzonation of Kolkata City”.
amax/
g
sat
(kN/m3)
w
(kN/m3)
v (kPa) u0 (kPa) 'v (kPa) Z (m) rd
CS Req CN
Corrected N-value
Fineness Content
(%) CRR FS
0.24 18.60 9.80 27.90 0.00 27.90 1.50 0.9
8 0.15 1.85 9.00 10.00 0.07 0.45
0.24 18.60 9.80 55.80 0.00 55.80 3.00 0.9
6 0.15 1.31 14.00 10.00 0.10 0.66
0.24 19.40 9.80 87.30 0.00 87.30 4.50 0.9
3 0.15 1.05 19.00 5.00 0.13 0.91
0.24 19.40 9.80
116.4
0 0.00 116.40 6.00 0.9
1 0.14 0.91 21.00 2.00 0.15 1.05
0.24 19.70 9.80
147.7
5 0.00 147.75 7.50 0.8
9 0.14 0.81 18.00 3.00 0.13 0.90
0.24 19.70 9.80
177.3
0 0.00 177.30 9.00 0.8
7 0.13 0.74 21.00 2.00 0.15 1.10
0.24 19.90 9.80
208.9
5 0.00 208.95 10.5
0 0.8
4 0.13 0.68 22.00 2.00 0.16 1.20
0.24 19.90 9.80
238.8
0 0.00 238.80 12.0
0 0.8
Technology (IJRASET)
[6] Glaser, S D.; Chung, Riley M., August, (1995) "Estimation of Liquefaction Potential by In Situ Methods", p. 431, Earthquake Spectra, Vol. 11, No. 3.
[7] Heinz J. Priebe (1995), “The Design of vibro replacement” presented by GeTec.
[8] Idriss I. M., 1999, “An update to the Seed-Idriss simplified procedure for evaluating liquefaction potential in Proceedings”, TRB Workshop on New
Approaches to Liquefaction, Publication No. FHWA-RD-99-165, Federal Highway Administration, January.
[9] IS 1893 (part 1):2002- Criteria for earthquake resisting design of structures.
[10] IS 1498:2007- Classification and identification of soils for general engineering purposes
[11] JACOBS Engineering India Pvt. Ltd, Ahmedabad. “Geotechnical investigation report for proposed building of Gujrat Institute of disaster Management at
village Koba, Gandhinagar”.
[12] Jain S K, Department of Civil Engineering, Indian Institute of Technology Kanpur, Paper of “Practice of examples on calculation on Code IS 1893 (Part I)”.
[13] J.J. Associates (Visakhapatnam)AETP(P) Ltd., Proposed DHT Project at Visakha Refinery (2010)
[14] Kandpal G.C., John B and Joshi K.C., (2009) “Geotechnical Studies in Relation to Seismic Microzonation of Union Territory of Chandigarh”.
[15] Kramer, S L.; Seed, Bolton H. (1988) "Initiation of Soil Liquefaction under Static Loading Conditions", Journal of Geotechnical Engineering, Vol. 114, No. 4.
[16] K S Rao, Dr. Neelima Satyam, (2014) “Liquefaction hazard Assessment Using SPT and VS for Two Cities in India.”, Report No: IIIT/TR/2014/-1, Centre for
earthquake engiaeering, International Institute of Information Technology, Hyderabad.
[17] Lukas, R.G. (1986), “Dynamic compaction for highway construction, design and construction guidelines,” Report# FHWA/RD-86/133, Federal Highway
Administration, Washington D.C.
[18] Lukas, R.G. (1995), “Dynamic compaction,” Report No. FHWA/SA/95/037, Federal Highway Administration, Washington, DC.
[19] Luehring, R., B. Dewey, L. Mejia, M. Stevens, and J. Baez. (2000). “Liquefaction mitigation of a silty dam foundation using vibro-stone columns and drainage
wicks - a test section case history at salmon lake dam” No.00-0748, Unpublished report.
[20] Seed, H. B., Idriss, I. M., Arango, I. (1983), "Evaluation of Liquefaction Potential Using Field Performance Data", Journal of
Geotechnical Engineering, ASCE, Vol. 109, No. 3, pp. 458-482.
[21] Youd, T. L, I. M. Idris, R D. Andrus, Co-Chair; Arango, Ignacio; Castro, Gonzalo; Christian, John T.; Dobry, Richardo; Finn, W. D. Liam et al. (2001).
"Liquefaction Resistance of Soils: Summary Report from the 1996 NCEER and 1998 NCEER∕NSF Workshops on Evaluation of Liquefaction Resistance of