Assessment of the Cavidi ExaVir Load
Assay for Monitoring Plasma Viral Load
in HIV-2-Infected Patients
Pedro Borrego,a,b,cMaria Fátima Gonçalves,dPerpétua Gomes,c,dLavínia Araújo,a Inês Moranguinho,aInês Brito Figueiredo,a,cIsabel Barahona,cJosé Rocha,e Claudino Mendonça,eMaria Cesarina Cruz,fJorge Barreto,gNuno Taveiraa,c Research Institute for Medicines (iMed.ULisboa), Faculdade de Farmácia, Universidade de Lisboa, Lisbon, Portugala; Centro de Administração e Políticas Públicas, Instituto Superior de Ciências Sociais e Políticas, Universidade de Lisboa, Lisbon, Portugalb; Centro de Investigação Interdisciplinar Egas Moniz, Instituto Superior de Ciências da Saúde Egas Moniz, Monte de Caparica, Portugalc; Laboratório de Biologia Molecular, LMCBM, SPC, Centro Hospitalar Lisboa Ocidental—HEM, Lisbon, Portugald; Laboratório ELISA, Hospital Agostinho Neto, Praia, Cabo Verdee; Laboratório de Análises Clínicas, Delegacia de Saúde, S. Vicente, Cabo Verdef; Programa de Luta contra as Doenças de Transmissão Sexual, incluindo VIH/Sida, Ministério da Saúde e da Segurança Social, Praia, Cabo Verdeg
ABSTRACT HIV plasma viral load is an established marker of disease progression and of response to antiretroviral therapy, but currently there is no commercial assay validated for the quantification of viral load in HIV-2-infected individuals. We sought to make the first clinical evaluation of Cavidi ExaVir Load (version 3) in HIV-2-infected patients. Samples were collected from a total of 102 individuals living in Cape Verde, and the HIV-2 viral load was quantified by both ExaVir Load and a refer-ence in-house real-time quantitative PCR (qPCR) used in Portugal in 91 samples. The
associations between viral load and clinical prognostic variables (CD4⫹T cell counts
and antiretroviral therapy status) were similar for measurements obtained using Exa-Vir Load and qPCR. There was no difference between the two methods in the capac-ity to discriminate between nonquantifiable and quantifiable HIV-2 in the plasma. In
samples with an HIV-2 viral load quantifiable by both methods (n ⫽ 27), the
mea-surements were highly correlated (Pearson r ⫽ 0.908), but the ExaVir Load values
were systematically higher relative to those determined by qPCR (median difference,
0.942 log10copies/ml). A regression model was derived that enables the conversion
of ExaVir Load results to those that would have been obtained by the reference qPCR. In conclusion, ExaVir Load version 3 is a reliable commercial assay to measure viral load in HIV-2-infected patients and therefore a valuable alternative to the in-house assays in current use.
KEYWORDS Cape Verde, Cavidi ExaVir load, HIV-2, resource-limited settings, viral load assay
T
he number of viral particles (viral load) in the plasma of an individual infected bythe human immunodeficiency virus (HIV) is an established marker of the efficacy of antiretroviral therapy and an indicator of disease progression (1–3). In HIV type 2 (HIV-2)-infected individuals, this evaluation is hindered by the inexistence of a “gold-standard” method for the quantification of HIV-2 viral load in the plasma. Unlike with HIV-1, for which there are commercial tests to quantify plasma viral load, specific quantification of plasma viral load in HIV-2-infected patients is only obtained through in-house assays developed for research use (4–10). This circumstance likely results from the low prevalence of HIV-2 infection worldwide. Of the 36.7 million (range, 34.0 to 39.8 million) people globally living with HIV at the end 2015 (11), only 1 to 2 million were infected with HIV-2 (12). HIV-2 is endemic in certain West African countries such as
Received8 February 2017Returned for modification13 March 2017Accepted10 May 2017
Accepted manuscript posted online17 May 2017
CitationBorrego P, Gonçalves MF, Gomes P, Araújo L, Moranguinho I, Figueiredo IB, Barahona I, Rocha J, Mendonça C, Cruz MC, Barreto J, Taveira N. 2017. Assessment of the Cavidi ExaVir load assay for monitoring plasma viral load in HIV-2-infected patients. J Clin Microbiol 55:2367–2379.https://doi.org/10 .1128/JCM.00235-17.
EditorAngela M. Caliendo, Rhode Island Hospital
Copyright© 2017 American Society for Microbiology.All Rights Reserved. Address correspondence to Nuno Taveira, ntaveira@ff.ulisboa.pt.
crossm
on May 16, 2020 by guest
http://jcm.asm.org/
Guinea-Bissau, Senegal, and Cape Verde (13–15) and in a few other countries with long-term relations with these countries, such as Portugal and France (16, 17). More-over, HIV-2 infection is associated with reduced or absent viral load (18, 19), with a viral load set point that is lower than in HIV-1, which challenges HIV-2 detection and quantification.
To assess the quality of in-house HIV-2 viral load assays and promote the standard-ization of the measurements, a multinational group of reference laboratories joined in
a working network (the ACHIeV2eCollaboration) and tested a panel of samples with
known viral copy number (4, 5). Most of the methods that were evaluated were based on real-time quantitative PCR (qPCR) of a segment of HIV-2 RNA genome. The exception was the commercial ExaVir Load assay (Cavidi, Sweden) that measures the activity of HIV reverse transcriptase (RT) in the plasma (20–22). In contrast to qPCR assays that quantify either HIV-1- or HIV-2-specific RNA, ExaVir Load measures the RT activity of HIV-1 and HIV-2. Thus, this method is, in principle, independent of the type, group, and subtype of HIV (5, 20, 23–25). The ExaVir Load assay has been used extensively to monitor the viral load in HIV-1-infected patients with the same efficiency between subtypes and recombinant forms (20, 23, 25–29) and with more consistent performance than qPCR methods in non-B subtypes (30). This characteristic, and its low cost, simplicity to operate, and commercial availability make it an attractive option for monitoring the HIV viral load in countries with limited resources. Indeed, ExaVir Load assay versions 1 (26, 31), 2 (24, 28, 29, 32, 33), and 3 (23, 29, 34), with sequentially improved sensitivity and shorter turnaround times (34, 35), have been used in many resource-limiting settings, in Asia and in Africa, to monitor the viral load in HIV-1-infected pediatric and adult patients undergoing antiretroviral treatment. Overall, measurements with the ExaVir Load assay showed good agreement with “gold-standard” HIV-1 viral load assays, such as Abbott M2000sp/M2000rt RealTime HIV-1 (23, 30), Roche Amplicor HIV-1 Monitor (24, 25, 27, 28, 33, 36), Roche Cobas Amplicor (29, 30, 32, 34, 37), Versant Bayer HIV-1 bDNA (22, 33), and bioMérieux NucliSense HIV-1 QT (26).
The aim of the present study was to make the first clinical evaluation of the ExaVir Load assay (version 3) in HIV-2-infected patients. The performance of the ExaVir Load assay was compared to that of the reference in-house qPCR used in Portugal (5, 38–40), which quantifies HIV-2 RNA copy number in the plasma by targeting a conserved region within the long terminal repeat (LTR) of the HIV-2 genome (41). Our patients were from Cape Verde Islands, which is a West African country located off the shore of Senegal, where HIV-1 and HIV-2 cocirculate (13, 14, 42). Estimates of the number of
people living with HIV in Cape Verde at the end of 2015 were 3.83 ⫻ 103 (95%
uncertainty intervals, 2.92⫻103to 5.18⫻103) (43). In 2015, HIV-2 represented 12% of
new HIV infections (39 HIV-2 cases in 327 new HIV infections) with HIV-1/HIV-2 infections representing 4.6% (15 cases) (42).
RESULTS
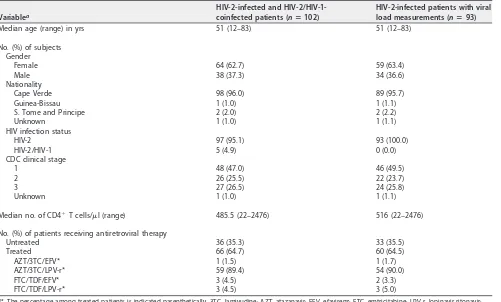
Demographic and clinical characteristics of HIV-2-infected patients.Of the 102 individuals included in this study, 97 were exclusively infected with HIV-2, and 5 were coinfected with HIV-2 and HIV-1 as determined by serology. Within the set of 97 individuals exclusively infected by HIV-2, viral load measurements were obtained in a subset of 93 individuals. Demographic and clinical characterization of the total 102 individuals (HIV-2 and HIV-1/HIV-2) and of the subset of 93 individuals (infected exclusively with HIV-2 and with viral load measurements) is reported in Table 1. In this subset of 93 individuals, the median age was 51 years, and the majority were female (63.4%). Cape Verde nationality was recorded for all but four individuals. The median
CD4⫹T cell count was 516 cells/l (range, 22 to 2,476 cells/l). Most individuals were
classified as Centers for Disease Control (CDC) clinical stage 1 (49.5%) and were treated with antiretroviral drugs (64.5%). Antiretroviral therapy regimens included RT inhibitors in all treated patients.
on May 16, 2020 by guest
http://jcm.asm.org/
Plasma viral load in HIV-1/HIV-2-coinfected patients.The viral load was deter-mined in five HIV-1/HIV-2-coinfected patients using both methods. All but one patient were on antiretroviral treatment. In the two patients (HAN14 and HAN29) with viral load quantifiable by both ExaVir Load and qPCR, the measurement with ExaVir Load was much higher than with qPCR (Table 2). Although this in-house qPCR is nonreactive with HIV-1 RNA (41), ExaVir Load cannot distinguish between HIV-1 and HIV-2 RT activity. Thus, HIV-1 viral load may contribute to the exceeding viral load measured by ExaVir Load in these two patients and in patient SV8. To eliminate any possible bias of an underlying HIV-1 infection, the results obtained for these five individuals with HIV-2/HIV-1 coinfection were excluded from subsequent statistical analysis.
[image:3.585.43.544.91.393.2]Plasma viral load in HIV-2-infected patients. The measurements of HIV-2 viral load in the subset of 93 HIV-2-infected individuals are described in Table 3. ExaVir Load
TABLE 1Demographic and clinical characteristics of HIV-2-infected and HIV-2/HIV-1-coinfected individuals included in this study at the time of sample collection
Variablea
HIV-2-infected and HIV-2/HIV-1-coinfected patients (nⴝ102)
HIV-2-infected patients with viral load measurements (nⴝ93)
Median age (range) in yrs 51 (12–83) 51 (12–83)
No. (%) of subjects Gender
Female 64 (62.7) 59 (63.4)
Male 38 (37.3) 34 (36.6)
Nationality
Cape Verde 98 (96.0) 89 (95.7)
Guinea-Bissau 1 (1.0) 1 (1.1)
S. Tome and Principe 2 (2.0) 2 (2.2)
Unknown 1 (1.0) 1 (1.1)
HIV infection status
HIV-2 97 (95.1) 93 (100.0)
HIV-2/HIV-1 5 (4.9) 0 (0.0)
CDC clinical stage
1 48 (47.0) 46 (49.5)
2 26 (25.5) 22 (23.7)
3 27 (26.5) 24 (25.8)
Unknown 1 (1.0) 1 (1.1)
Median no. of CD4⫹T cells/l (range) 485.5 (22–2476) 516 (22–2476) No. (%) of patients receiving antiretroviral therapy
Untreated 36 (35.3) 33 (35.5)
Treated 66 (64.7) 60 (64.5)
AZT/3TC/EFV* 1 (1.5) 1 (1.7)
AZT/3TC/LPV-r* 59 (89.4) 54 (90.0)
FTC/TDF/EFV* 3 (4.5) 2 (3.3)
FTC/TDF/LPV-r* 3 (4.5) 3 (5.0)
a*, The percentage among treated patients is indicated parenthetically. 3TC, lamivudine; AZT, atazanavir; EFV, efavirenz; FTC, emtricitabine; LPV-r, lopinavir-ritonavir;
TDF, tenofovir disoproxil fumarate.
TABLE 2HIV-2 viral load measurements and clinical information for five HIV-1/HIV-2-coinfected individuals at the time of sample collection
Subject Gender Yr of diagnosis No. of CD4ⴙT cells/l
Current antiretroviral therapya
Viral load (copies/ml)
ExaVir Load
In-house qPCR
HAN63 Female 1995 476 AZT/3TC/LPV-r ⬍200 ⬍40
SV1 Male 2013 237 FTC/TDF/EFV ⬍200 ⬍40
SV8 Female 2004 61 AZT/3TC/LPV-r 359 ⬍40
HAN14 Male 2009 276 AZT/3TC/LPV-r 43,352 7,388
HAN29 Female 2009 110 Untreated 615,604 1,407
a3TC, lamivudine; AZT, atazanavir; EFV, efavirenz; FTC, emtricitabine; LPV-r, lopinavir-ritonavir; TDF, tenofovir disoproxil fumarate.
on May 16, 2020 by guest
http://jcm.asm.org/
[image:3.585.42.545.642.731.2]was used to measure viral load in all 93 individuals, and the in-house qPCR was used in 91 individuals. Quantifiable measurements, defined as values of HIV-2 viral load
of ⬎200 copies/ml for ExaVir Load or ⬎40 copies/ml for the in-house qPCR, were
obtained in 37 (39.8%) samples with ExaVir Load and in 31 (34.1%) samples with qPCR. HIV-2 viral load measurements were distributed within a wide range of values, 213 to 288,433 copies/ml with ExaVir Load and 40 to 52,233 copies/ml with qPCR. For ExaVir Load and qPCR, the proportion of positive (quantifiable) results was higher in patients treated with antiretroviral drugs (64.9% [24/37] for ExaVir Load; 61.3% [19/31] for qPCR) relative to untreated patients (35.1% [13/37] for ExaVir Load; 38.7% [12/31] for qPCR). Nonetheless, the number of quantifiable and nonquantifiable samples was
indepen-dent of the patients being under treatment or not (P⫽1.000 for Exavir Load andP⫽
0.638 for qPCR).
To evaluate the association between viral load and clinical condition, viral load was
analyzed as a function of CD4⫹T cell counts and antiretroviral therapy status. In the
subset of treated individuals, the CD4⫹T cell counts were compared between
individ-uals failing therapy (HIV-2 viral load of⬎200 copies/ml) (3) and individuals with virus
suppression (HIV-2 viral load of⬍200 copies/ml), as measured by ExaVir Load or by
qPCR. For both methods, the CD4⫹T cell counts were significantly lower in patients
failing therapy than in patients with viral suppression (for ExaVir Load, 197.0 versus
548.0 median CD4⫹T cell counts,P⬍0.0001,n⫽62; for in-house qPCR, 161.5 versus
510.0 median CD4⫹T cell counts,P⬍0.0001,n⫽62). In the subset of individuals with
quantifiable results, the CD4⫹T cell counts were negatively correlated with HIV-2 viral
load (log10 copies/ml), as quantified by ExaVir Load (Spearman r ⫽ ⫺0.590, 95%
confidence interval [CI]⫽ ⫺0.803 to⫺0.286],P⫽0.0001,n⫽37) and qPCR (Spearman
r ⫽ ⫺0.601, 95% CI⫽ ⫺0.790 to ⫺0.322], P⫽ 0.0004, n⫽ 31) (see Fig. S1 in the
supplemental material). In this subset of patients, the viral loads were not significantly
different between treated and untreated individuals (ExaVir Load: median log10
cop-ies/ml⫽4.020 versus 3.600,P⫽0.500; qPCR: median log10copies/ml⫽3.182 versus
2.658,P⫽0.163).
Comparison of viral load assays for clinical evaluation of HIV-2 infection.
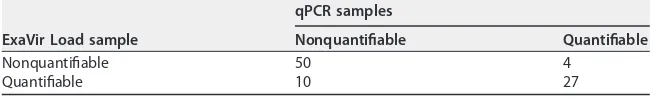
Quantification of viral load was done with both ExaVir Load and qPCR in 91 samples. The discrimination between a quantifiable and a nonquantifiable result was concordant in 77 (85%) samples and discordant in 14 (15%) samples (Table 4). Of the 14 samples with discordant results, there were 4 samples nonquantifiable by ExaVir Load that had
the following numbers of copies per milliliter (log10) as determined by the qPCR assay:
40 (1.6), 54 (1.7), 217 (2.3), and 419 (2.6). Conversely, there were 10 samples
nonquan-tifiable by the qPCR assay that had the following numbers of copies per milliliter (log10)
as determined by the ExaVir Load assay: 213 (2.3 log10), 214 (2.3), 216 (2.3), 217 (2.3),
270 (2.4), 272 (2.4), 279 (2.4), 301 (2.5), 928 (3.0), and 1,781 (3.3). The clinical information for these 14 individuals is presented in Table S1 in the supplemental material.
Comparing the two methods, we obtained a weighted Cohen’s kappa of 0.673 (95%
[image:4.585.42.371.93.215.2]CI ⫽ 0.517 to 0.828) for the capacity to discriminate between nonquantifiable and
TABLE 3Quantification of viral load by ExaVir Load and qPCR in HIV-2-infected individuals
Method and viral load Finding
ExaVir Load (n⫽93)
Nonquantifiable (⬍200 copies/ml), no. (%) 56 (60.2) Quantifiable (ⱖ200 copies/ml), no. (%) 37 (39.8)
Median HIV-2 copies/ml (range) 5,522 (213–288,433) (n⫽37) Median HIV-2 log10copies/ml (range) 3.7 (2.3–5.5) (n⫽37)
qPCR (n⫽91)
Nonquantifiable (⬍40 copies/ml), no. (%) 60 (65.9) Quantifiable (ⱖ40 copies/ml), no. (%) 31 (34.1)
Median HIV-2 copies/ml (range) 999 (40–52,233) (n⫽31) Median HIV-2 log10copies/ml (range) 3.0 (1.6–4.7) (n⫽31)
on May 16, 2020 by guest
http://jcm.asm.org/
quantifiable HIV-2 viral load, which is suggestive of a good level of agreement despite the different lower limits of quantification of the two methods. The proportion of agreement on negative (nonquantifiable) results was 87.7%, while the proportion of agreement on positive (quantifiable) results was 79.4%. As reported above, the mea-surements of ExaVir Load were more frequently above the limits of quantification (10 samples) than they were below the limits of quantification (4 samples) relative to the
qPCR assay. Nonetheless, this disagreement is not statistically significant (P⫽0.178),
and therefore there is no real difference between the two methods (47) in the capacity to discriminate between nonquantifiable and quantifiable HIV-2 in the plasma. Notably, the same conclusion is derived when this comparison is made in the subgroup of
patients under antiretroviral treatment (n⫽ 62,P⫽ 0.180) and in the subgroup of
untreated patients (n⫽35,P⫽1.000).
The degree of disagreement (deviation) between measurements was also evaluated for the subset of 27 samples with positive viral load results by both methods. The Bland-Altman plot in Fig. 1A shows that the ExaVir Load and qPCR assay produce different values, being higher in the ExaVir Load assay than in qPCR. This difference is
statistically significant (median value of 0.942 log10copies/ml, 95% CI⫽0.800 to 1.085,
P⬍0.0001). Figure 1A indicates a systematic deviation between the measured values
of the two methods because the limits of agreement, set to comprise 95% of measured
differences (45), are ⬎0. To evaluate whether this deviation is proportional to the
measured level of viral load (in log10copies/ml), a regression line was fitted to the data
of the Bland-Altman plot (Fig. 1B). The slope of the regression line is not significantly
different from 0 (P⫽0.198), despite the slight tendency upward, indicating there is no
proportional deviation between the two methods at the log10 scale (47, 52). The
antiretroviral therapy status of the patient had no significant effect on the deviation observed in the Bland-Altman plot (see Fig. S2 in the supplemental material). For Bland-Altman plots produced separately for each subgroup based on the antiretroviral therapy status, the systematic deviation between measurements (higher values in ExaVir Load than in qPCR) observed in the untreated patients was similar to the systematic deviation detected in the subgroup of treated patients (untreated [median
value of 0.925 log10copies/ml,n⫽10] versus treated [0.964 log10copies/ml,n⫽17],
P⫽ 0.822) (see Fig. S3A and B in the supplemental material). In each subgroup, no
proportional deviation between the two methods was observed at the log10scale (see
Fig. S3C and D in the supplemental material).
The two methods were also compared by modeling the functional relationship between the measurements of ExaVir Load and qPCR with Deming regression (Fig. 2) (50, 53). A linear relationship between these measurements is supported by a Pearson
correlation coefficient of 0.908, with a narrow 95% CI (0.806 to 0.958) (Fig. 2). They
intercept of the regression line in Fig. 2 is located at⫺1.159 log10copies/ml with a 95%
CI between⫺2.646 and⫺0.479 log10copies/ml. The intercept is therefore significantly
different from 0 (P⫽ 0.009), which means that there is a constant (fixed) deviation
between the measurements of both methods. On the other hand, the slope of the
regression line is not statistically different from 1 (estimate 1.045, 95% CI⫽0.891 to
1.362,P⬍0.0001), which means that there is no proportional deviation at the log10
[image:5.585.40.372.93.144.2]scale (47, 52). Despite the wide confidence interval of the y-intercept value, these
TABLE 4Comparison between ExaVir Load and qPCR for the capacity to quantify HIV-2 viral load in plasmaa
ExaVir Load sample
qPCR samples
Nonquantifiable Quantifiable
Nonquantifiable 50 4
Quantifiable 10 27
aThe lower limit of quantification for ExaVir Load is 200 copies/ml. The lower limit of quantification for qPCR
is 40 copies/ml. Quantification of the viral load was accomplished using both ExaVir Load and qPCR in 91 samples.
on May 16, 2020 by guest
http://jcm.asm.org/
results confirm that the deviation observed in the Bland-Altman plots results from a fixed systematic deviation, i.e., for HIV-2 infection the measurements of ExaVir Load are higher than the ones of the qPCR assay by a constant amount that does not depend
on the magnitude of the log10viral load being quantified. A model enabling calibration
of ExaVir Load viral load results with qPCR results was specified as⫺1.159 plus 1.045
FIG 1Bland-Altman plot for the differences between measurements of HIV-2 viral load obtained by ExaVir Load and by qPCR. (A) The difference (ExaVir Load values minus qPCR values) is plotted against the average for each sample. The solid line represents the median, and the gray ribbon represents the corresponding 95% CI. The dotted lines represent the limits of agreement (percentile 2.5 to percentile 97.5), containing 95% of the values on they axis. (B) The differences were regressed on averages using quantile regression. The solid line represents the regression line, and the gray ribbon represents the corresponding 95% confidence band. The regression model is annotated in the plot, as are the Wald chi-square statistic (with 1 degree of freedom) and the estimates of the regression coefficients, with the correspondingPvalues.
on May 16, 2020 by guest
http://jcm.asm.org/
[image:6.585.41.405.74.586.2]ExaVir Load log10copies/ml. Using this model, it is possible to estimate qPCR viral load
results (in HIV-2 log10copies/ml) using ExaVir Load measurements adjusted with the
corresponding deviation.
Deming regression was also performed separately for treated and untreated pa-tients (see Fig. S4 in the supplemental material). The results confirm the fixed system-atic deviation observed in the Bland-Altman plot of each subgroup (see Fig. S4A in the supplemental material), but there were no significant differences between these mod-els (see Fig. S4A and B in the supplemental material). Thus, in our data, subgroup analysis does not support the use of separate calibration models for treated or untreated patients.
From the model we can also estimate the systematic deviation between the two methods (Fig. 3). At the clinical decision levels of 200 (2.3 log10), 500 (2.7 log10), and 1,000 (3.0 log10) copies/ml, the estimates of the deviation were, respectively, 1.055,
1.037, and 1.023 log10 copies/ml (absolute values), although with wider confidence
intervals near the lower limit of quantification of ExaVir Load (2.3 log10copies/ml).
DISCUSSION
We performed the first evaluation of the clinical performance of Cavidi ExaVir Load assay in HIV-2-infected patients. As a reference comparative assay, we used an in-house qPCR based assay that is in current use at reference institutions in Portugal and other
European countries (4, 5, 10, 38–41, 54). The associations between viral load and CD4⫹
T cell counts or antiretroviral therapy status were similar for measurements obtained with ExaVir Load and qPCR. Moreover, there was no difference between the two methods in the capacity to discriminate between nonquantifiable and quantifiable HIV-2 in the plasma. Collectively, the parallelism observed in both methods for the association between viral load and clinical prognostic variables support the use of ExaVir Load version 3 for viral load quantification in the management of HIV-2 infection. When viral loads were directly compared between the two methods, we found that measurements with ExaVir Load were systematically higher relative to qPCR (median
difference of 0.942 log10copies/ml). Similar results were obtained by Damond et al.,
FIG 2Comparison of the quantification of HIV-2 viral load by ExaVir Load and qPCR. The solid line represents the Deming regression line, and the gray ribbon represents the corresponding 95% confidence band. The dashed line represents the theoretical line of identity as if the measurements of ExaVir Load and qPCR were equal. The regression model is annotated in the plot, as are the estimates of the regression coefficients, with the correspondingPvalues.
on May 16, 2020 by guest
http://jcm.asm.org/
[image:7.585.41.403.70.311.2]who compared the performance of ExaVir Load version 2 and different in-house viral load assays with standardized RNA concentrations from one HIV-2 group A isolate (4). In that study, ExaVir Load version 2 overestimated the HIV-2 viral load in aliquots with
concentrations of 2.3 and 3.0 log10 copies/ml. In contrast, ExaVir Load version 2
systematically underestimated HIV-1 viral load by a magnitude of 0.2 log10copies/ml
compared to the Roche Monitor HIV-1 assay using cross-sectional and longitudinal plasma samples collected from patients enrolled in clinical trials (36). A systematic
underestimation of 0.3 log10copies/ml was also reported for ExaVir Load version 3 in
aliquots of a World Health Organization international standard of HIV-1 subtype B (30). Greengrass et al. compared ExaVir Load version 3 with Roche Cobas HIV-1 Monitor test
and found a disagreement of⬎0.5 log10copies/ml in 27% of samples collected from
HIV-1-infected individuals (32); this percentage was 18% when Gupta et al. compared ExaVir Load version 3 to Abbot m2000rt (23).
Since it is important for clinicians to understand HIV-2 viral load results irrespective of the assay that was used, we developed a model that enables the quick conversion of the results obtained with ExaVir Load to those that would have been obtained by the reference qPCR. In principle, a similar model could be developed for all other in-house HIV-2 viral load assays. From our model, it is also possible to estimate the systematic
deviation between the two methods. At the level of 200 (2.3 log10) copies/ml, which is
a clinical decision point for failing therapy in HIV-1 (3), we estimated 1.055 log10
copies/ml higher measurements in ExaVir Load. The wide confidence intervals obtained
FIG 3Estimates for the deviation between measurements, using the model proposed for the calibration of ExaVir Load version 3 for HIV-2 viral load quantification. Theyaxis represents the calibration values (deviation) to be used for the adjustment of each ExaVir measurement. The solid line represents the point estimates of the deviation, and the gray ribbon represents the corresponding 95% confidence band. The horizontal dashed line represents the zero line of nonsystematic deviation. The vertical solid lines highlight the confidence bounds at the clinical decision levels described in the table below: 200 (2.3 log10), 500 (2.7 log10), and 1,000 (3.0 log10) copies/ml.
on May 16, 2020 by guest
http://jcm.asm.org/
[image:8.585.44.406.70.404.2]for estimations near the lower limit of quantification is consistent with higher variability in the quantification of lower viral loads by both methods, as in previous reports for both HIV-2 (4) and HIV-1 (55, 56).
An early report from Greengrass et al. suggested that exposure to drugs targeting RT could affect HIV-1 load quantification by RT activity, since mutations associated with
resistance to efavirenz could reduce RT activity by 0.2 log10(22). However, later reports
showed no association between the presence of RT inhibitors or resistance mutations with differences between RT activity and HIV-1 RNA in the plasma (23, 29, 32, 57, 58). Although our study was not designed to investigate the effect of RT inhibitors on the performance of ExaVir Load in HIV-2 infection, our results agree with these reports since no significant differences were found between viral load measurements with ExaVir Load or qPCR in treated and untreated patients.
The decrease in HIV plasma viral load to below the lower limits of quantification of viral load assays is a fundamental endpoint to evaluate the successful response of a patient to an antiretroviral regimen (2, 3). In our study, the discrimination between a quantifiable and a nonquantifiable result was discordant in 14 samples, of which 10 were quantifiable with low viral loads by ExaVir Load but nonquantifiable by the qPCR assay, despite the latter having a lower limit of quantification. Detectable RT activity without viral RNA quantification has been reported previously with ExaVir Load versions 1 (20, 26), 2 (24, 28, 33), and 3 (30) in HIV-1 infection, with particular incidence in a study by Steegen et al., who found that 61.7% of samples were falsely positive with version 2 of the kit (24). Although these results may indicate a lower specificity of the RT assay compared to RNA-based viral load assays (24, 33), a competing explanation would be an increased sensitivity of the RT assay to detect viruses with high genetic diversity (24, 30) because RNA detection is dependent on the genomic sequence of the virus. Improved sensitivity of qPCR viral load assays has been obtained for HIV-1 (59) and HIV-2 (7), by targeting simultaneously two genomic regions instead of only one. Indeed, genetic variability challenges the development of qPCR viral load assays for HIV-2 as well (5, 7, 8) and may have contributed to the differences reported previously between HIV-2 viral load assays, including in-house qPCR assays and ExaVir Load version 2 (4). Although we did not sequence the genomic region targeted by the in-house qPCR assay in each sample, we cannot exclude the influence of the genetic diversity in the detection of HIV-2 by this method, especially considering that it only targets a single region of the HIV-2 genome and the samples were obtained from a country with an old and highly diverse HIV-2 epidemic (13, 16, 17). Our results stress the need for further investigation on the specificity of ExaVir Load to detect HIV-2 infection in West Africa.
In a recent systematic review of HIV load technologies, Sollis et al. emphasize that the implications of inaccurate viral load quantification go beyond the clinical domain, having also public health (e.g., the transmission of drug-resistant strains) and economic consequences (e.g., the cost and limited availability of second line regimens or salvage therapy) (56). This is particularly important in countries where trained health care professionals, infrastructures, and financial resources are more limited. In such settings, commercial nonnucleic acid-based methods, such as the Cavidi ExaVir Load assay, can be a good alternative considering the low cost, simple and standardized procedure, and limited physical requirements (60). Moreover, in African countries such as Cape Verde (13, 14, 61), Guinea-Bissau (62), Gambia (63), and Senegal (64, 65), where HIV-1 and HIV-2 cocirculate, but also in Portugal (38–40) and France (66, 67), the character-istics of the ExaVir Load assay make it useful to measure viral load in patients infected with HIV-1 and/or HIV-2, provided that the serologic diagnosis of HIV-1 or HIV-2 infection is well established in advance.
The strengths of this study include (i) the evaluation, for the first time, of the performance of ExaVir Load version 3 in HIV-2 clinical samples, (ii) the inclusion of patients from a country in the epicenter of the HIV-2 epidemic, and (iii) the use of an independent method as a comparator, performed at a laboratory integrated in an international network of reference laboratories for the quantification of HIV-2 viral load.
on May 16, 2020 by guest
http://jcm.asm.org/
The study limitations include (i) no data on repeatability and reproducibility because only one measurement was performed per sample in each laboratory, (ii) the absence of longitudinal samples to measure the impact of ExaVir Load quantifications on disease progression of HIV-2-infected patients, and (iii) the fact that the method used as comparator, albeit regarded as a reference, is not a commercially approved “gold-standard” for HIV-2 viral load quantification.
In conclusion, Cavidi ExaVir Load version 3 is a reliable assay for measuring viral load in HIV-2-infected patients, and its results can be readily converted to those obtained by qPCR assays using a simple model. These features make ExaVir an excellent alternative to the in-house assays in current use to measure HIV-2 viral load.
MATERIALS AND METHODS
Samples. Blood samples were collected from 102 HIV-2-infected individuals from the islands of Santiago and São Vicente in Cape Verde. Ninety-three individuals were monitored at Hospital Agostinho Neto, located in Praia, Island of Santiago, and nine individuals were monitored at Hospital Batista de Sousa, located in Mindelo, Island of São Vicente. Samples were collected between 2012 and 2014. Written informed consent was obtained from all patients and the study protocols were approved by the National Ethics Commission (Comité Nacional de Ética em Pesquisa para a Saúde [CNEPS]), Cape Verde. Plasma was separated from whole blood and conserved frozen at⫺80°C for transportation and further analysis. For each patient, the status of HIV-2 and HIV-1 infection was confirmed at the local hospitals by commercial HIV antibody assays, namely, SD Bioline HIV-1/2 3.0 (Standard Diagnostics, Yongin, Gyeonggi, Republic of Korea) and Geenius HIV1/2 Confirmatory Assay (Bio-Rad Laboratories, Hercules, CA), accord-ing to the manufacturer’s instructions. All double infections were further confirmed with the rapid test Alere Determine HIV-1/2 Ag/Ab Combo (Alere, Waltham, MA).
HIV-2 viral load quantification.For each blood sample, the HIV-2 viral load was quantified by ExaVir Load assay version 3 (Uppsala, Sweden) and in-house qPCR. ExaVir Load assay was performed according to the manufacturer’s instructions. The in-house qPCR amplifies a conserved region of HIV-2 LTR and uses TaqMan probes to quantify the HIV-2 RNA copy number of cell-free virus in the plasma, as described by Ferns and Garson in 2006 (41). In each method, the measurements are expressed in copies/ml. The volume of plasma used in the ExaVir Load assay and in the qPCR assay is 1 ml. The limit of detection of the ExaVir Load assay is 200 copies/ml and of the qPCR assay is 40 copies/ml.
Statistical analysis.We performed univariate and bivariate statistical analysis using R (https://cran .r-project.org), with a significance level of 5%. The associations between viral load measurements and clinical prognostic variables (CD4⫹T cell counts and antiretroviral therapy status) were evaluated with (i) estimates of the nonparametric Spearman correlation coefficient and (ii) parametric t-Student and nonparametric Mann-Whitney hypothesis tests to compare values between independent groups. The parametric Pearson correlation coefficient was estimated to evaluate the linear association between the measurements (in log10copies/ml) of both methods. The nonparametric Pearson’s chi-square test was used to test the independence of HIV-2 viral load quantification with antiretroviral treatment status. The nonparametric Mann-Whitney hypothesis test was used to compare the differences between measure-ments (ExaVir Load values minus qPCR values) for the subgroups based on antiretroviral treatment status. The two methods were compared to the measurements expressed on a categorical scale, represent-ing the capacity to discriminate between nonquantifiable and quantifiable HIV-2 viral loads (for mea-surements, respectively, below or above the lower limit of quantification of the corresponding method), and on a numerical scale, representing the quantification of the number of copies of HIV-2 in the plasma (log10copies/ml). For the categorical scale, the agreement between the two methods was analyzed using Cohen’s kappa coefficient with quadratic weights (44, 45) and the Cicchetti and Feinstein proportions of positive and negative agreement (46). The disagreement between the two methods in the categorical scale was evaluated by the nonparametric exact single binomial test (47). For the numerical scale, the disagreement was analyzed by combining two techniques (47), the method of differences and regression analysis. For the first technique, the method of differences, the differences between measurements of each pair of observations (yaxis) were plotted against the averages of those measurements (xaxis) in Bland-Altman plots for the detection of bias (deviation) (45, 48). The horizontal lines of the Bland-Altman plots represent empirical quantiles (45), estimated by the Harrell-Davis quantile estimator (49). HIV-2 viral load quantifications were directly compared between the two methods with the nonparametric Wil-coxon sign-ranked hypothesis test. In addition, robust linear regression was fitted to the data with univariate quantile regression for the detection of proportional deviation (48). Multivariate quantile regression was used to evaluate the effect of antiretroviral therapy on the deviations detected by the Bland-Altman plot. The second technique, regression analysis, was performed according to the EP09-A3 recommendations of the Clinical and Laboratory Standards Institute (CLSI) (50), by regressing the values from the in-house qPCR on the values from ExaVir Load using Deming regression. Comparison between Deming regression lines was performed with the Wald statistic for the intercept and for the shift and with the likelihood ratio test for the slope (51). The deviation between methods was also estimated according to the CLSI EP09-A3 recommendations (50).
on May 16, 2020 by guest
http://jcm.asm.org/
SUPPLEMENTAL MATERIAL
Supplemental material for this article may be found athttps://doi.org/10.1128/JCM
.00235-17.
SUPPLEMENTAL FILE 1,PDF file, 0.1 MB.
SUPPLEMENTAL FILE 2,PDF file, 0.5 MB.
SUPPLEMENTAL FILE 3,PDF file, 0.5 MB.
SUPPLEMENTAL FILE 4,PDF file, 1.1 MB.
SUPPLEMENTAL FILE 5,PDF file, 0.2 MB.
ACKNOWLEDGMENTS
This study was funded by the Luso-American Foundation for Development (FLAD) through a Luso-American Collaborative Response Award on HIV/AIDS and by the Fundação para a Ciência e Tecnologia, Portugal, through grant PTDC/BIM-MEC/6631/ 2014.
REFERENCES
1. HIV Surrogate Marker Collaborative Group. 2000. Human immunodefi-ciency virus type 1 RNA level and CD4 count as prognostic markers and surrogate end points: a meta-analysis. AIDS Res Hum Retroviruses 16: 1123–1133.https://doi.org/10.1089/088922200414965.
2. Murray JS, Elashoff MR, Iacono-Connors LC, Cvetkovich TA, Struble KA. 1999. The use of plasma HIV RNA as a study endpoint in efficacy trials of antiretroviral drugs. AIDS 13:797– 804.https://doi.org/10.1097/00002030 -199905070-00008.
3. DHHS-OARAC. 2016. Panel on antiretroviral guidelines for adults and adolescents: guidelines for the use of antiretroviral agents in HIV-1-infected adults and adolescents. DHHS-OARAC, Bethesda, MD.http:// www.aidsinfo.nih.gov/guidelines.
4. Damond F, Benard A, Ruelle J, Alabi A, Kupfer B, Gomes P, Rodes B, Albert J, Boni J, Garson J, Ferns B, Matheron S, Chene G, Brun-Vezinet F. 2008. Quality control assessment of human immunodeficiency virus type 2 (HIV-2) viral load quantification assays: results from an international collaboration on HIV-2 infection in 2006. J Clin Microbiol 46:2088 –2091.
https://doi.org/10.1128/JCM.00126-08.
5. Damond F, Benard A, Balotta C, Boni J, Cotten M, Duque V, Ferns B, Garson J, Gomes P, Gonçalves F, Gottlieb G, Kupfer B, Ruelle J, Rodes B, Soriano V, Wainberg M, Taieb A, Matheron S, Chene G, Brun-Vezinet F. 2011. An international collaboration to standardize HIV-2 viral load assays: results from the 2009 ACHI EV 2E quality control study. J Clin Microbiol 49:3491–3497.https://doi.org/10.1128/JCM.02389-10. 6. Chang M, Gottlieb GS, Dragavon JA, Cherne SL, Kenney DL, Hawes SE,
Smith RA, Kiviat NB, Sow PS, Coombs RW. 2012. Validation for clinical use of a novel HIV-2 plasma RNA viral load assay using the Abbott m2000 platform. J Clin Virol 55:128 –133.https://doi.org/10.1016/j.jcv.2012.06 .024.
7. Avettand-Fenoel V, Damond F, Gueudin M, Matheron S, Mélard A, Collin G, Descamps D, Chaix M-L, Rouzioux C, Plantier J-C; ANRS-CO5 HIV-2 and ANRS-AC11 Quantification Working Group. 2014. New sensitive one-step real-time duplex PCR method for group A and B HIV-2 RNA load. J Clin Microbiol 52:3017–3022.https://doi.org/10.1128/JCM.00724-14. 8. Delarue S, Didier E, Damond F, Ponscarme D, Brengle-Pesce K,
Resche-Rigon M, Vray M, Gueudin M, Simon F. 2013. Highly sensitive plasma RNA quantification by real-time PCR in HIV-2 group A and group B infection. J Clin Virol 58:461– 467.https://doi.org/10.1016/j.jcv.2013.08 .003.
9. Styer LM, Miller TT, Parker MM. 2013. Validation and clinical use of a sensitive HIV-2 viral load assay that uses a whole virus internal control. J Clin Virol 58:e127– e133.https://doi.org/10.1016/j.jcv.2013.09.007. 10. Ekouévi DK, Avettand-Fènoël V, Tchounga BK, Coffie PA, Sawadogo A,
Minta D, Minga A, Eholie SP, Plantier J-C, Damond F, Dabis F, Rouzioux C, Campbell-Yesufu O, Gandhi R, Kanki P, Travers K, Hsieh SM, et al. 2015. Plasma HIV-2 RNA according to CD4 count strata among HIV-2-infected adults in the IeDEA West Africa collaboration. PLoS One 10:e0129886.
https://doi.org/10.1371/journal.pone.0129886.
11. UNAIDS. 2016. Global AIDS update. UNAIDS, Washington, DC. 12. Campbell-Yesufu OT, Gandhi RT. 2011. Update on human
immunodefi-ciency virus (HIV)-2 infection. Clin Infect Dis 52:780 –787.https://doi.org/ 10.1093/cid/ciq248.
13. Oliveira V, Bártolo I, Borrego P, Rocha C, Valadas E, Barreto J, Almeida E, Antunes F, Taveira N. 2012. Genetic diversity and drug resistance profiles in HIV type 1- and HIV type 2-infected patients from Cape Verde Islands. AIDS Res Hum Retroviruses 28:510 –522.https://doi.org/10.1089/aid .2012.0058.
14. De Pina-Araujo II, Guimarães ML, Bello G, Vicente AC, Morgado MG. 2014. Profile of the HIV epidemic in Cape Verde: molecular epidemiology and drug resistance mutations among HIV-1- and HIV-2-infected patients from distinct islands of the archipelago. PLoS One 9:e96201.https://doi .org/10.1371/journal.pone.0096201.
15. Visseaux B, Damond F, Matheron S, Descamps D, Charpentier C. 2016. HIV-2 molecular epidemiology. Infect Genet Evol 46:233–240.https://doi .org/10.1016/j.meegid.2016.08.010.
16. Faria NR, Hodges-Mameletzis I, Silva JC, Rodés B, Erasmus S, Paolucci S, Ruelle J, Pieniazek D, Taveira N, Treviño A, Gonçalves MF, Jallow S, Xu L, Camacho RJ, Soriano V, Goubau P, de Sousa JD, Vandamme A-M, Suchard MA, Lemey P. 2012. Phylogeographical footprint of colonial history in the global dispersal of human immunodeficiency virus type 2 group A. J Gen Virol 93:889 – 899.https://doi.org/10.1099/vir.0.038638-0. 17. Lemey P, Pybus OG, Wang B, Saksena NK, Salemi M, Vandamme A-M. 2003. Tracing the origin and history of the HIV-2 epidemic. Proc Natl Acad Sci U S A 100:6588 – 6592. https://doi.org/10.1073/pnas .0936469100.
18. Berry N, Ariyoshi K, Jaffar S, Sabally S, Corrah T, Tedder R, Whittle H. 1998. Low peripheral blood viral HIV-2 RNA in individuals with high CD4 percentage differentiates HIV-2 from HIV-1 infection. J Hum Virol 1:457– 468.
19. Popper SJ, Sarr AD, Guèye-Ndiaye A, Mboup S, Essex ME, Kanki PJ. 2000. Low plasma human immunodeficiency virus type 2 viral load is inde-pendent of proviral load: low virus production in vivo. J Virol 74: 1554 –1557.https://doi.org/10.1128/JVI.74.3.1554-1557.2000.
20. Braun J, Plantier J-C, Hellot M-F, Tuaillon E, Gueudin M, Damond F, Malmsten A, Corrigan GE, Simon F. 2003. A new quantitative HIV load assay based on plasma virion reverse transcriptase activity for the different types, groups and subtypes. AIDS 17:331–336.https://doi.org/ 10.1097/00002030-200302140-00006.
21. Seyoum E, Wolday D, Mekonen T, Girma M, Meselle T, Källander C, Gronowitz S, Britton S. 2005. Alternative approach to blood screening using the ExaVir reverse transcriptase activity assay. Curr HIV Res 3:371–376.https://doi.org/10.2174/157016205774370438.
22. Greengrass VL, Turnbull SP, Hocking J, Dunne AL, Tachedjian G, Corrigan GE, Crowe SM. 2005. Evaluation of a low cost reverse transcriptase assay for plasma HIV-1 viral load monitoring. Curr HIV Res 3:183–190.https:// doi.org/10.2174/1570162053506955.
23. Gupta S, Palchaudhuri R, Neogi U, Srinivasa H, Ashorn P, De Costa A, Källander C, Shet A. 2016. Can HIV reverse transcriptase activity assay be a low-cost alternative for viral load monitoring in resource-limited set-tings? BMJ Open 6:e008795. https://doi.org/10.1136/bmjopen-2015 -008795.
on May 16, 2020 by guest
http://jcm.asm.org/
24. Steegen K, Luchters S, De Cabooter N, Reynaerts J, Mandaliya K, Plum J, Jaoko W, Verhofstede C, Temmerman M. 2007. Evaluation of two com-mercially available alternatives for HIV-1 viral load testing in resource-limited settings. J Virol Methods 146:178 –187.https://doi.org/10.1016/j .jviromet.2007.06.019.
25. Jennings C, Fiscus SA, Crowe SM, Danilovic AD, Morack RJ, Scianna S, Cachafeiro A, Brambilla DJ, Schupbach J, Stevens W, Respess R, Varnier OE, Corrigan GE, Gronowitz JS, Ussery MA, Bremer JW. 2005. Comparison of two human immunodeficiency virus (HIV) RNA surrogate assays to the standard HIV RNA assay. J Clin Microbiol 43:5950 –5956.https://doi.org/ 10.1128/JCM.43.12.5950-5956.2005.
26. Seyoum E, Wolday D, Girma M, Malmsten A, Meselle T, Gronowitz JS, Britton S. 2006. Reverse transcriptase activity for quantitation of HIV-1 subtype C in plasma: relation to RNA copy number and CD4 T-cell count. J Med Virol 78:161–168.https://doi.org/10.1002/jmv.20523.
27. Stevens G, Rekhviashvili N, Scott LE, Gonin R, Stevens W. 2005. Evalua-tion of two commercially available, inexpensive alternative assays used for assessing viral load in a cohort of human immunodeficiency virus type 1 subtype C-infected patients from South Africa. J Clin Microbiol 43:857– 861.https://doi.org/10.1128/JCM.43.2.857-861.2005.
28. Sivapalasingam S, Essajee S, Nyambi PN, Itri V, Hanna B, Holzman R, Valentine F. 2005. Human immunodeficiency virus (HIV) reverse trans-criptase activity correlates with HIV RNA load: implications for resource-limited settings. J Clin Microbiol 43:3793–3796.https://doi.org/10.1128/ JCM.43.8.3793-3796.2005.
29. Huang D, Zhuang Y, Zhai S, Song Y, Liu Q, Zhao S, Wang S, Li X, Kang W, Greengrass V, Plate M, Crowe SM, Sun Y. 2010. HIV reverse transcriptase activity assay: a feasible surrogate for HIV viral load measurement in China. Diagn Microbiol Infect Dis 68:208 –213.https://doi.org/10.1016/j .diagmicrobio.2010.06.007.
30. Labbett W, Garcia-Diaz A, Fox Z, Clewley GS, Fernandez T, Johnson M, Geretti AM. 2009. Comparative evaluation of the ExaVir Load version 3 reverse transcriptase assay for measurement of human immunodefi-ciency virus type 1 plasma load. J Clin Microbiol 47:3266 –3270.https:// doi.org/10.1128/JCM.00715-09.
31. Lombart JP, Vray M, Kafando A, Lemée V, Ouédraogo-Traoré R, Corrigan GE, Plantier J-C, Simon F, Braun J. 2005. Plasma virion reverse transcrip-tase activity and heat dissociation-boosted p24 assay for HIV load in Burkina Faso, West Africa. AIDS 19:1273–1277.https://doi.org/10.1097/ 01.aids.0000180098.58017.48.
32. Greengrass VL, Plate MM, Steele PM, Denholm JT, Cherry CL, Morris LM, Hearps A, Crowe SM. 2009. Evaluation of the Cavidi ExaVir Load assay (version 3) for plasma human immunodeficiency virus type 1 load monitoring. J Clin Microbiol 47:3011–3013.https://doi.org/10.1128/JCM .00805-09.
33. Sivapalasingam S, Wangechi B, Marshed F, Laverty M, Essajee S, Holzman RS, Valentine F. 2009. Monitoring virologic responses to antiretroviral therapy in HIV-infected adults in Kenya: evaluation of a low-cost viral load assay. PLoS One 4:e6828. https://doi.org/10.1371/journal.pone .0006828.
34. Greengrass V, Lohman B, Morris L, Plate M, Steele PM, Walson JL, Crowe SM. 2009. Assessment of the low-cost Cavidi ExaVir Load assay for monitoring HIV viral load in pediatric and adult patients. J Acquir Immune Defic Syndr 52:387–390. https://doi.org/10.1097/QAI .0b013e3181b05f62.
35. Malmsten A, Shao X-W, Sjödahl S, Fredriksson E-L, Pettersson I, Leitner T, Källander CFR, Sandström E, Gronowitz JS. 2005. Improved HIV-1 viral load determination based on reverse transcriptase activity recovered from human plasma. J Med Virol 76:291–296.https://doi.org/10.1002/ jmv.20360.
36. Stewart P, Cachafeiro A, Napravnik S, Eron JJ, Frank I, van der Horst C, Bosch RJ, Bettendorf D, Bohlin P, Fiscus SA. 2010. Performance charac-teristics of the Cavidi ExaVir viral load assay and the ultrasensitive P24 assay relative to the Roche Monitor HIV-1 RNA assay. J Clin Virol 49: 198 –204.https://doi.org/10.1016/j.jcv.2010.07.022.
37. Cuong DD, Agneskog E, Chuc NTK, Santacatterina M, Sönnerborg A, Larsson M. 2012. Monitoring the efficacy of antiretroviral therapy by a simple reverse transcriptase assay in HIV-infected adults in rural Viet-nam. Future Virol 7:923–931.https://doi.org/10.2217/fvl.12.83. 38. Duarte F, Miranda AC, Peres S, Diogo I, Gonçalves F, Carvalho AP, Costa
I, Cabanas J, Moneti V, Vaz Alves J, de Abreu RC, Neves I, Aldir I, Mansinho K, Gomes P. 2016. Transmitted drug resistance in drug-naïve HIV-2-infected patients. AIDS 30:1687–1688. https://doi.org/10.1097/ QAD.0000000000001107.
39. Cavaco-Silva J, Aleixo MJ, Van Laethem K, Faria D, Valadas E, Goncalves MDF, Gomes P, Vandamme A-M, Cunha C, Camacho RJ, Portuguese HIV-2 Resistance Study Group. 2013. Mutations selected in HIV-2-infected patients failing a regimen including atazanavir. J Antimicrob Chemother 68:190 –192.https://doi.org/10.1093/jac/dks363.
40. Cavaco-Silva J, Abecasis A, Miranda AC, Poças J, Narciso J, Águas MJ, Maltez F, Almeida I, Germano I, Diniz A, de Gonçalves MF, Gomes P, Cunha C, Camacho RJ, Portuguese HIV-2 Resistance Study Group. 2014. HIV-2 integrase polymorphisms and longitudinal genotypic analysis of HIV-2 infected patients failing a raltegravir-containing regimen. PLoS One 9:e92747.https://doi.org/10.1371/journal.pone.0092747.
41. Ferns RB, Garson JA. 2006. Development and evaluation of a real-time RT-PCR assay for quantification of cell-free human immunodeficiency virus type 2 using a Brome Mosaic Virus internal control. J Virol Methods 135:102–108.https://doi.org/10.1016/j.jviromet.2006.02.005.
42. DNS-SPCDP. 2015. Programa de luta contra as doenças de transmissão sexual, incluindo VIH-SIDA: relatório anual de actividades, República de Cabo Verde. Ministério da Saúde, Direção Nacional da Saúde, Serviço para a Prevenção e Controlo de Doenças Prioritárias, Praia, Cabo Verde. 43. Wang H, Wolock TM, Carter A, Nguyen G, Kyu HH, Gakidou E, Hay SI, Mills EJ, Trickey A, Msemburi W, Coates MM, Mooney MD, Fraser MS, Sligar A, Salomon J, Larson HJ, Friedman J, Abajobir AA, Abate KH, Abbas KM, et al. 2016. Estimates of global, regional, and national incidence, preva-lence, and mortality of HIV, 1980-2015: the Global Burden of Disease Study 2015. Lancet HIV 3:e361– e387.https://doi.org/10.1016/S2352-3018 (16)30087-X.
44. Fleiss JL, Cohen J, Everitt BS. 1969. Large sample standard errors of kappa and weighted kappa. Psychol Bull 72:323–327.https://doi.org/10 .1037/h0028106.
45. Kwiecien R, Kopp-Schneider A, Blettner M. 2011. Concordance analysis: part 16 of a series on evaluation of scientific publications. Dtsch Arztebl Int 108:515–521.
46. Cicchetti DV, Feinstein AR. 1990. High agreement but low kappa. II. Resolving the paradoxes. J Clin Epidemiol 43:551–558.https://doi.org/ 10.1016/0895-4356(90)90159-M.
47. Ludbrook J. 2002. Statistical techniques for comparing measurers and methods of measurement: a critical review. Clin Exp Pharmacol Physiol 29:527–536.https://doi.org/10.1046/j.1440-1681.2002.03686.x. 48. Bland JM, Altman DG. 1999. Measuring agreement in method
compar-ison studies. Stat Methods Med Res 8:135–160.https://doi.org/10.1191/ 096228099673819272.
49. Harrel FE, Davis CE. 1982. A new distribution-free quantile estimator. Biometrika 69:635– 640.https://doi.org/10.1093/biomet/69.3.635. 50. Clinical and Laboratory Standards Institute. 2013. Measurement
proce-dure comparison and bias estimation using patient samples. Approved guideline, 3rd ed. CLSI document EP09-A3. Clinical and Laboratory Standards Institute, Wayne, PA.
51. Warton DI, Wright IJ, Falster DS, Westoby M. 2006. Bivariate line-fitting methods for allometry. Biol Rev 81:259.https://doi.org/10.1086/506238. 52. Ludbrook J. 1997. Comparing methods of measurements. Clin Exp Phar-macol Physiol 24:193–203. https://doi.org/10.1111/j.1440-1681.1997 .tb01807.x.
53. Passing H, Bablok. 1983. A new biometrical procedure for testing the equality of measurements from two different analytical methods. I. Application of linear regression procedures for method comparison studies in clinical chemistry. J Clin Chem Clin Biochem 21:709 –720. 54. Ciccaglione AR, Miceli M, Pisani G, Bruni R, Iudicone P, Costantino A,
Equestre M, Tritarelli E, Marcantonio C, Tataseo P, Marazzi MC, Ceffa S, Paturzo G, Doro Altan AM, San Lio MM, Mancinelli S, Ciccozzi M, Lo Presti A, Rezza G, Palombi L. 2010. Improving HIV-2 detection by a combina-tion of serological and nucleic acid amplificacombina-tion test assays. J Clin Microbiol 48:2902–2908.https://doi.org/10.1128/JCM.00121-10. 55. Muyldermans G, Debaisieux L, Fransen K, Marissens D, Miller K, Vaira D,
Vandamme AM, Vandenbroucke AT, Verhofstede C, Schuurman R, Zissis G, Lauwers S. 2000. Blinded, multicenter quality control study for the quantification of human immunodeficiency virus type 1 RNA in plasma by the Belgian AIDS reference laboratories. Clin Microbiol Infect 6:213–217.https://doi.org/10.1046/j.1469-0691.2000.00048.x.
56. Sollis KA, Smit PW, Fiscus S, Ford N, Vitoria M, Essajee S, Barnett D, Cheng B, Crowe SM, Denny T, Landay A, Stevens W, Habiyambere V, Perrins J, Peeling RW, Bisson G, Gross R, Strom J, Rollins C, Bellamy S, Mee P, et al. 2014. Systematic review of the performance of HIV viral load technolo-gies on plasma samples. PLoS One 9:e85869.https://doi.org/10.1371/ journal.pone.0085869.
on May 16, 2020 by guest
http://jcm.asm.org/
57. van Rooijen LB, Greengrass V, Morris LM, Plate MM, Gouillou M, Tached-jian G, Sluis-Cremer N, Hearps AC, Crowe SM. 2009. Effect of reverse transcriptase inhibitors and mutations on the low-cost Cavidi reverse transcriptase viral load assay. J Acquir Immune Defic Syndr 52:527–529.
https://doi.org/10.1097/QAI.0b013e3181b9e726.
58. Napravnik S, Cachafeiro A, Stewart P, Eron JJ, Fiscus SA, Guay LA, Al E. 2010. HIV-1 viral load and phenotypic antiretroviral drug resistance assays based on reverse transcriptase activity in comparison to amplifi-cation based HIV-1 RNA and genotypic assays. J Clin Virol 47:18 –22.
https://doi.org/10.1016/j.jcv.2009.10.001.
59. Damond F, Avettand-Fenoel V, Collin G, Roquebert B, Plantier JC, Ganon A, Sizmann D, Babiel R, Glaubitz J, Chaix ML, Brun-Vezinet F, Descamps D, Rouzioux C. 2010. Evaluation of an upgraded version of the Roche Cobas AmpliPrep/Cobas TaqMan HIV-1 test for HIV-1 load quantification. J Clin Microbiol 48:1413–1416.https://doi.org/10.1128/JCM.01409-09.
60. Fiscus SA, Cheng B, Crowe SM, Demeter L, Jennings C, Miller V, Respess R, Stevens W, the Forum for Collaborative HIV Research Alternative Viral Load Assay Working Group. 2006. HIV-1 viral load assays for resource-limited settings. PLoS Med 3:e417.https://doi.org/10.1371/journal.pmed .0030417.
61. CCS. 2015. Rapport de Progrès de la riposte VIH/SIDA. CCS, Praia, Cabo Verde.
62. Sørensen A, Jespersen S, Katzenstein TL, Medina C, Té DDS, Correira FG, Hviid CJ, Laursen AL, Wejse C. 2016. Clinical presentation and opportu-nistic infections in HIV-1, HIV-2 and HIV-1/2 dual seropositive patients in
Guinea-Bissau. Infect Dis (Auckl) 48:604 – 611.https://doi.org/10.1080/ 23744235.2016.1180708.
63. Peitzmeier S, Mason K, Ceesay N, Diouf D, Drame F, Loum J, Baral S. 2014. A cross-sectional evaluation of the prevalence and associations of HIV among female sex workers in the Gambia. Int J STD AIDS 25:244 –252.
https://doi.org/10.1177/0956462413498858.
64. Heitzinger K, Sow PS, Dia Badiane NM, Gottlieb GS, N=Doye I, Toure M, Kiviat NB, Hawes SE, University of Washington-Dakar HIV and Cervical Cancer Study Group. 2012. Trends of HIV-1, HIV-2 and dual infection in women attending outpatient clinics in Senegal, 1990 –2009. Int J STD AIDS 23:710 –716.https://doi.org/10.1258/ijsa.2012.011219.
65. Ekouevi DK, Balestre E, Coffie PA, Minta D, Messou E, Sawadogo A, Minga A, Sow PS, Bissagnene E, Eholie SP, Gottlieb GS, Dabis F, Zannou DM, Ahouada C, Akakpo J, Ahomadegbé C, et al. 2013. Characteristics of HIV-2 and HIV-1/HIV-2 dually seropositive adults in West Africa present-ing for care and antiretroviral therapy: the IeDEA-West Africa HIV-2 Cohort Study. PLoS One 8:e66135.https://doi.org/10.1371/journal.pone .0066135.
66. Gautheret-Dejean A, Bocobza J, Brunet S, Damond F, Plantier J-C, Barin F. 2015. Performance of rapid tests for discrimination between HIV-1 and/or HIV-2 infections. J Med Virol 87:2061–2066.https://doi.org/10 .1002/jmv.24282.
67. Cotte L, Bénet T, Vanhems P, Brochier C, Perpoint T, Ferry T, Chidiac C. 2014. The effect of adherence to guidelines for initial antiretroviral therapy on 1-year outcomes: a French cohort study. BMC Infect Dis 14:596.https://doi.org/10.1186/s12879-014-0596-y.