Technology (IJRASET)
Cramer’s V Test Discretization Based Spatial
Decision Tree Learning for Land Cover
Classification
Miss. S. Joy Princy1, Mrs. S. Subadra2
1
Research Scholar, 2Associate Professor
Department of Computer Science, Sri Jayendra Saraswathi Arts and Science College
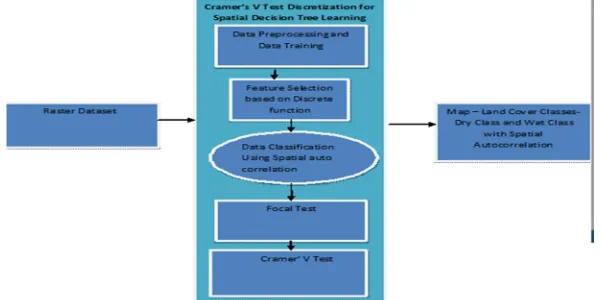
Abstract- Given learning samples from a raster data set for spatial data mining, spatial decision tree learning models is used to estimate the decision tree classifier that minimizes classification errors as well as salt-and-pepper noise. The problem has important societal applications such as land cover classification for natural resource management. However, the problem is challenging due to the fact that learning samples show spatial autocorrelation in class labels, instead of being independently identically distributed. Related work relies on local tests (i.e., testing feature information of a location) and cannot adequately model the spatial autocorrelation effect, resulting in salt-and-pepper noise. In similarity, we proposed a Cramer’s V Test Discretization for feature selection in the land covers in which the images with noise can be reduced with morphological filter and extract the more feature descriptor for land cover classification with spatial auto correlation property for discrete features. Preliminary results showed that Cramer’s V Test reduces classification errors and salt-and-pepper noise. This paper extends our recent work by introducing a new test approach with adaptive neighbourhoods that avoids over-smoothing in wedge-shaped areas. Cramer's V-based discretization (CVD) algorithm is proposed to optimally partition the continuous features into discrete ones. Two association-based feature selection indexes has integrated for spatial autocorrelation, the CVD-based association index (CVDAI) and the class-attribution interdependence maximization (CAIM)-based association index (CAIMAI), derived from the CV-test value, are then proposed to select the optimal feature subset. Experiment results on real world data sets show that proposed technique improves classification accuracy, and that our computational refinement significantly reduces training time.
Keywords: Spatial Data Mining, Decision Tree Learning, Raster Dataset, Spatial Auto correlation
I. INTRODUCTION
Technology (IJRASET)
maximization (CAIM)-based association index (CAIMAI), derived from the CV-test value, are then proposed to select the optimal feature subset. The rest of paper is organized as follows; section 2 explains the background knowledge regarding the related work. Section 3 explains and formulates the proposed System. The experimental results are discussed in section 4; we conclude the work with future work of the paper at section 5.
II. RELATED WORKS
A. Spatial Data Classification Using Decision Tree Learning –Local Test
The Spatial data Classification is carried out with help of spatial raster dataset in order to achieve the better classification accuracy in prediction with less salt and pepper noise. The spatial data of desertification land use is mainly through the interpretation of satellite images to get. Data based Supervised Classification and unsupervised classification is the traditional interpretation Methods but their classification precisions are low. And the result of Classification are low .Now, a image interpretation method, decision tree classification can be employed to classify the spatial data for map land cover classification into wetland and dry land. These classifiers follow the classic assumption that learning samples are independently and identically distributed. This assumption does not hold for spatial data and leads to salt-and-pepper noise in predictions.
B. Spatial Entropy Based Decision Tree classifiers
Entropy methods use spatial autocorrelation level as well as information gain to select candidate tree node tests , if there exists some feature that favors spatial autocorrelation will Produce largest information gain in the one tree node they still rely on local testing of information by tree nodes to handle the over smoothing area and wedge shaped Area .
C. Spatial Raster Framework
Spatial raster framework F is a tessellation of a 2-D plane into a regular grid. On a spatial raster framework, there may exist a set of explanatory feature maps, as well as a class label map.
III. PROPOSED SYSTEM
A. Data Training Using Spatial Learning
Data training based spatial learning includes two sub-routines (Node-Split and Focal Function). it is a divide and conquer method with a greedy strategy (i.e., maximize information gain). If the training samples are less than the minimum tree node size, or all the class labels are identical, a leaf labeled with the majority class will be returned. The data enumerate through every candidate feature f, every neighborhood size s, and every candidate threshold. d to select the best setting for a model tree node. Candidate thresholds d are generated from distinct values of feature f in the training samples. Node- Split subroutine to split training samples.
B. Data Refining
[image:3.612.156.457.549.699.2]This approach is based on the observation that when the candidate threshold value increases, only a small number of samples have their local and focal test results updated. In other words, once computation is completed for one candidate threshold, the test results of most samples will remain the same and can be reused for consecutive thresholds.
Technology (IJRASET)
C. Group Combination Using Focal TestFTSDT algorithm minimizes the access and evaluation of potential subsets of spatial data. The data points in FTSDT are hierarchically represented by data blocks, e.g., using R-tree. The algorithm process query by treating the blocks as points to find an intermediate solution in higher hierarchical level in order reduce the classification error and salt and Pepper noise. To refine the solution, the search space in lower hierarchical level is minimized by following the guided search direction.
D. Subset Refinement Using Cramer’ V Test Based On Feature Descritization And Spatial Auto Correlation
Subset Hierarchical Algorithm is a local search heuristic with support of the spatial database techniques. In higher hierarchical level, each block is treated as a point by region to replace every element in the subset using map Land function, and the resultant subset with the current best value is refined by visiting the class label with the spatial auto correlation in the class block. The solution of spatial auto correlation is usually close to the global optimum and guaranteed to be within a factor of at most close to the global optimum.
E. Discretization with the Cramer’s V-Test
Discretization generally falls into two distinct categories: unsupervised methods, such as EQW and k-means, which do not use any information in the class variable, and supervised ones based on entropy/minimum descriptive length [32], which partition continuous attributes into discrete variables involved with the class labels. Given the range of values of a continuous feature, a conceptually simple discretization approach is to place the splits in such a way that they maximize the purity of the intervals. In practice, however, such an approach requires a potentially arbitrary decision about the purity of an interval and the minimum size of an interval. Statistic-based approaches, which are often used to overcome these concerns, generally start with each attribute value as a separate interval and create larger intervals by merging the adjacent intervals that are similar, according to a statistical test
F. Algorithm – Cramer V Test Based Descritization
Cramer -Train (T, C, Smax, N0)
where
• T: training samples where T[i][f] is f th feature value of the discerete function in i th sample • C: class labels where C[i] is class label of i th sample
• Smax: maximum neighborhood size • N0: minimum decision tree node size
Feature selection ()
• Root of an Decision model if |T| < N0 or C is unique class then L=CreateLeaf (class(C) );
for each candidate neighborhood size s ∈ {0...Smax}
do for each candidate feature
f ∈ {1...F} do Sort feature f values T[i][f] (i ∈ {1...N}) in ascending order for each i ∈ {1...(N − 1)} do if T[i][f] < T[i + 1][f]
Technology (IJRASET)
δ = (T[i][f] + T[i + 1][f])/2
{T1, T2}=Node-Split(T, f, δ, s);
Split C into {C1, C2} according to {T1, T2} I G=Information Gain(C,C1,C2)
if IG > IG0 then IG0 = IG; s0 = s; f0 = f;
δ0 = δ;
G. Spatial Correlation Check
I=CreateInternalNode(f0, δ0, s0);
{T1, T2}=Node-Split(T, f0, δ0, s0); Split C into C1 and C2 based on {T1, T2} I.
Left node=Class-test(T1, C1, Smax, N0) I.
Right Node=Class-Test(T2, C2, Smax, N0)
Return I
If (data == Auto correlated)
The correctness of the proposed computationally refined algorithm is estimated . We also provide a cost model of computational complexity. The proof of correctness is nontrivial, because when the candidate threshold changes, multiple sample locations as well as their neighbors may need to update their Cramer V test Value
IV. EXPERIMENTAL RESULTS
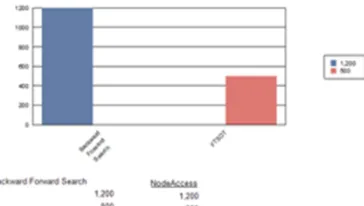
In this section, we describe the experimental part of the work, To evaluate classification performance, we compared the Cramers V test with Focal Test
A. Data Set Description
We used high resolution (3 m by 3 m) remote sensing imagery collected from the city of Chanhassen, MN, by the National Agricultural Imagery Program and Markhurd Inc. There were 12 continuous explanatory features including multi-temporal (for the years 2003, 2005, and 2008) spectral information (R, G, B, NIR) and Normalized Difference Vegetation Index (NDVI). Class labels (wet land and dry land) were created by a field crew and photo interpreters between 2004 and 2005. To evaluate classification performance, we selected two scenes from the city. On each scene, we used systematic clustered sampling to select a number of wetland and dryland
Technology (IJRASET)
Figure 4.1. Prediction Results of Classes based on the Color Values.
B. Performance based on minimum Tree node Size
As can be seen, as the minimum tree node size increases, the time cost of both algorithms decreases. The reason is that fewer tree nodes are constructed and thus less computation is needed. But our refined algorithm has persistently lower cost than our baseline algorithm.
C. Performance Measures based Maximum node Size
When the maximum neighborhood size is very small (i.e., 1), the time cost of both algorithms is close, due to the low time cost when Smax is very small. However, as the maximum neighborhood size increases, the time cost of the baseline algorithm grows dramatically faster than the refined algorithm.
Figure 4.3. Performance Evaluation of the Cramer’s Test aaginst the Focal test .
Both theoretical analysis and experimental evaluation show that our refined algorithm is more scalable than our baseline algorithm. We also design a new focal test approach with adaptive neighbourhoods to avoid over-smoothing in wedge-shaped areas.
V. CONCLUSION
In this work, we Designed and implemented a spatial decision tree classifier based on cramer v Test .This explores the spatial decision tree learning problem for raster image classification. The problem is challenging due to the spatial autocorrelation effect and computational cost. The Cramer V Test uses the spatial decision tree model and its learning algorithm for further estimate the feature and mapping of revalent feature to the particular class labels. We further conduct computational optimization and design a refined algorithm that selectively updates CV values, as it shows better spatial correlation than focal test.
REFERENCES
[1] J. R. Quinlan, C4.5: Programs for Machine Learning, San Mateo, CA, USA: Morgan Kaufmann, 1993.
Technology (IJRASET)
Int. Conf. Adv. Geographic Inf. Syst., 2012, pp. 390–393.[3] M. A. Friedl and C. E. Brodley, “Decision tree classification of land cover from remotely sensed data,” Remote Sens. Environ., vol. 61, no. 3, pp. 399–409, 1997.
[4] J. M. Corcoran, J. F. Knight, and A. L. Gallant, “Influence of multisource and multi-temporal remotely sensed and ancillary data on the accuracy of random forest classification of wetlands in northern minnesota,” Remote Sens., vol. 5, no. 7, pp. 3212–3238, 2013.
[5] J. F. Knight, B. P. Tolcser, J. M. Corcoran, and L. P. Rampi, “The effects of data selection and thematic detail on the accuracy of high spatial resolution wetland classifications,” Photogrammetric Eng. Remote Sens., vol. 79, no. 7, pp. 613–623, 2013.
[6] B. Walsh. (Jan., 2010). How wetlands worsen climate change. [Online]. Available: http://www.time.com/time/health/article/ 0,8599,1953751,00.html
[7] A. Deschamps, D. Greenlee, T. Pultz, and R. Saper, “Geospatial data integration for applications in flood prediction and management in the red river basin,” in Proc. IEEE Int. Geoscience Remote Sens. Symp., 2002, pp. 3338–3340.
[8] R. Hearne, “Evolving water management institutions in the red river basin,” Environ. Manage., vol. 40, no. 6, pp. 842–852, 2007.
[9] C. Van Westen, “Remote sensing for natural disaster management,” Int. Archives Photogrammetry Remote Sens., vol. 33, no. B7/4; PART 7, pp. 1609–1617, 2000.