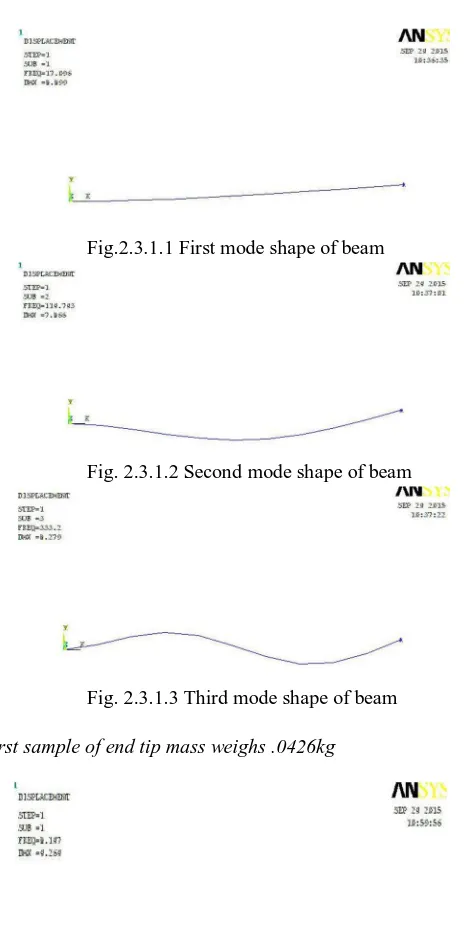
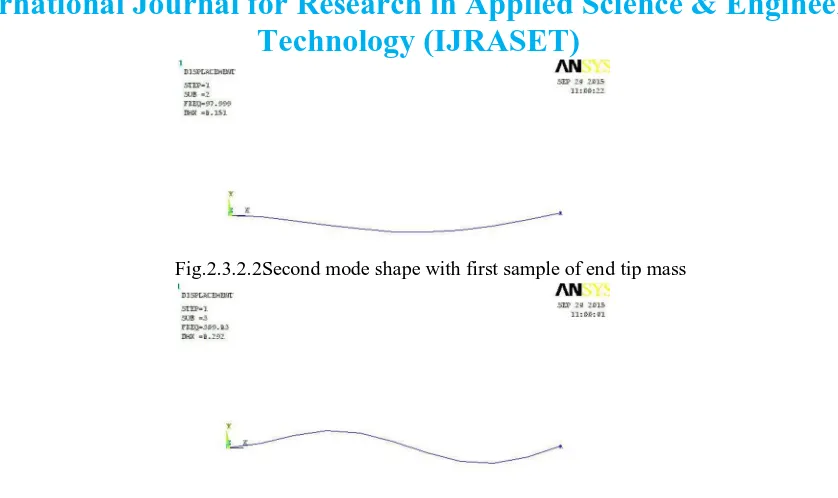
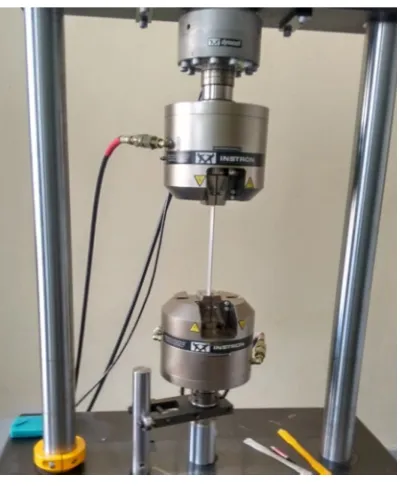
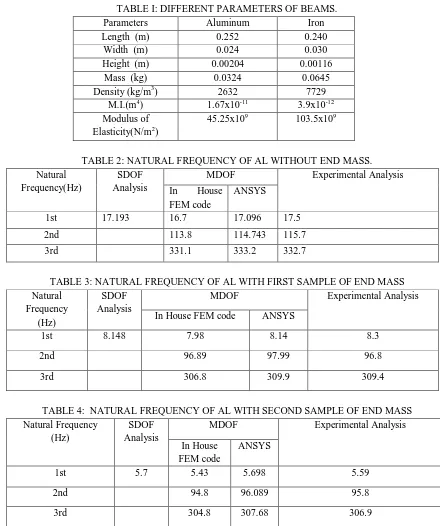
Vibration Analysis of Cantilever Beam: An Experimental Study
Full text
Figure
Related documents
Regulation of NQO1 by the NRF2-KEAP1/ARE pathway The efficiency of many phytochemical inducers to up- regulate NQO1 is mediated through the Nrf2-Keap1/ARE system
However, it is essential to determine first whether the factorial structure of the three measures used in this study namely, the Positive Thinking Skills Scale (PTSS),
Individuals with RLS were more likely to have certain functional status limitations at baseline (Table 4, adjusted for correlates reported in Table 3; specifically age,
This study aims to examine the issues using panel data from multiple provinces in 2006 and 2009, which provide information not only about the numbers of CTs and MRIs but also
The set of navigational paths retrieved from the activities of 10 students shows a prefer- ence towards the Reception modules; there is a high level of activity registered on
Such an exercise as the above provides an expanded approach to the study of labour and welfare policy regimes – assuming that groups of policies and practices remain together in
To this end this project achieved a bi-directional flow of information between Patient and Key Personnel Team Members [ 2 ], continually evaluated the engagement process by
The process of measurement of hearing capabilities of one’s ear for the sake of diagnosis a hearing loss is known as an audiometer, it is used to measure the ability of a
