comment
reviews
reports
deposited research
interactions
information
refereed research
Research
Assessment of the relationship between signal intensities and
transcript concentration for Affymetrix GeneChip
®
arrays
Eugene Chudin*
†
, Randal Walker
†‡
, Alan Kosaka
†‡
, Sue X Wu
†‡
,
Douglas Rabert
‡
, Thomas K Chang
‡
and Dirk E Kreder
§
Addresses: *Illumina, San Diego, CA 92129, USA. ‡Roche Bioscience, Palo Alto, CA 94304, USA. §Abgenix Inc., Fremont, CA 94555, USA.
†These authors contributed equally to this work
Correspondence: Eugene Chudin. E-mail: echudin@illumina.com
Abstract
Background: Affymetrix microarrays have become increasingly popular in gene-expression studies; however, limitations of the technology have not been well established for commercially available arrays. The hybridization signal has been shown to be proportional to actual transcript concentration for specialized arrays containing hundreds of distinct probe pairs per gene. Additionally, the technology has been described as capable of distinguishing concentration levels within a factor of 2, and of detecting transcript frequencies as low as 1 in 2,000,000. Using commercially available arrays, we assessed these representations directly through a series of ‘spike-in’ hybridizations involving four prokaryotic transcripts in the absence and presence of fixed eukaryotic background. The contribution of probe-target interactions to the mismatch signal was quantified under various analyte concentrations.
Results: A linear relationship between transcript abundance and signal was consistently observed between 1 pM and 10 pM transcripts. The signal ceased to be linear above the 10 pM level and commenced saturating around the 100 pM level. The 0.1 pM transcripts were virtually undetectable in the presence of eukaryotic background. Our measurements show that preponderance of the signal for mismatch probes derives from interactions with the target transcripts.
Conclusions: Landmark studies outlining an observed linear relationship between signal and transcript concentration were carried out under highly specialized conditions and may not extend to commercially available arrays under routine operating conditions. Additionally, alternative metrics that are not based on the difference in the signal of members of a probe pair may further improve the quantitative utility of the Affymetrix GeneChip®array.
Published: 14 December 2001
GenomeBiology2001, 3(1):research0005.1–0005.10
The electronic version of this article is the complete one and can be found online at http://genomebiology.com/2001/3/1/research/0005 © 2001 Chudin et al., licensee BioMed Central Ltd
(Print ISSN 1465-6906; Online ISSN 1465-6914)
Received: 11 September 2001 Revised: 23 October 2001 Accepted: 24 October 2001
Background
Even though the DNA microarray is still an emerging tech-nology, its usefulness as a profiling tool is well established. Affymetrix GeneChip®arrays enable the concurrent
assess-ment of expression levels for thousands of genes in a single experiment. At the molecular level, however, the microarray experiment is a challenging biophysical problem that is
The photolithographically synthesized oligonucleotide microarrays that underlie the Affymetrix GeneChip®array
use pairs (typically 16 or 20) of perfect-match (PM) and mis-match (MM) features. Each feature is a rectangular region containing oligonucleotides complementary to a correspond-ing region of a gene. Because of the inherent difficulties of oligonucleotide synthesis, the proportion of full-length (25mer) probes within a feature is rather low [1]. The PM probes are distinguishable from the MM probes only by the nucleotide in the 13th position. The expressed design intent behind the MM feature is to quantify the background noise (for example, scanner noise) and nonspecific interactions (for example, cross-hybridization) embedded within the PM signal. To arrive at a pristine measure of the signal attribut-able to probe-target interaction, it has been suggested [2-4] that the intensity for the MM feature should be subtracted from that of the PM feature for each probe pair and subse-quently averaged (excluding outliers) to produce the average difference intensity (ADI). This heuristic is currently utilized to characterize the expression level for a given gene.
While the importance of differentiating actual expression from noise cannot be overemphasized, no published experi-ment establishes the assumption that the MM signal closely resembles the nonspecific component of the PM signal. It has been suggested [1] that a significant portion of the MM signal may derive from probe-target rather than background interactions; however, the relative contributions of specific and nonspecific components have not been established. In the present study, an assay was specifically designed to isolate the fundamental components of the PM and MM signals. The stratification of nonspecific interactions unique to or common to the PM and MM signals was not addressed.
Our results show that for transcript concentrations above 100 pM, the nonspecific component of PM signal is a negligi-ble part of the MM signal. In fact, the greater part of the MM signal reflects interaction with the corresponding target transcript. This prevents the ADI (PM - MM) from being sensitive to changes in transcript concentration above the 100 pM level (approximately 1 in 1,500 transcript fre-quency). Comparison of absolute values of probe intensities across the different experimental conditions of the study suggest that thermodynamic equilibrium may be dominated by stable nonspecific interactions essentially decreasing target availability (that is, cross-target bridges) in the pres-ence of complex cRNA. Whereas our results show that quan-titative detection of target transcripts is possible with commercially available arrays, they also demonstrate the potential of alternative metrics for further improving the power of the analysis.
Results
Biotinylated target cRNA from four prokaryotic genes -lys, dap, phe and thr from Bacillus subtilis - was collectively
hybridized to Test2 arrays with and without 0.05 g/l of complex cRNA background generated from human brain total RNA. This background concentration roughly corre-sponds to 150 nM (0.05 g/l / (330 g/(mol x nucleotide) x 1,000 nucleotides)). The target transcript frequency can then be simply computed by dividing transcript concentration by total RNA concentration. B. subtilis genes were selected on the basis of their designation as standardization controls. In accordance with the probe array design, genes encoded on the Test2 array contain three probe sets corresponding to the 5?, middle and 3? regions. Thus, a total of 12 distinct con-trolled target-transcript measurements were obtained per hybridization. Precision in target-transcript concentration was increased through a series of tenfold dilutions from a presynthesized in vitrotranscribed mixture. Each combina-tion of dilucombina-tion and background was replicated four times (array availability) to account for and assess variability.
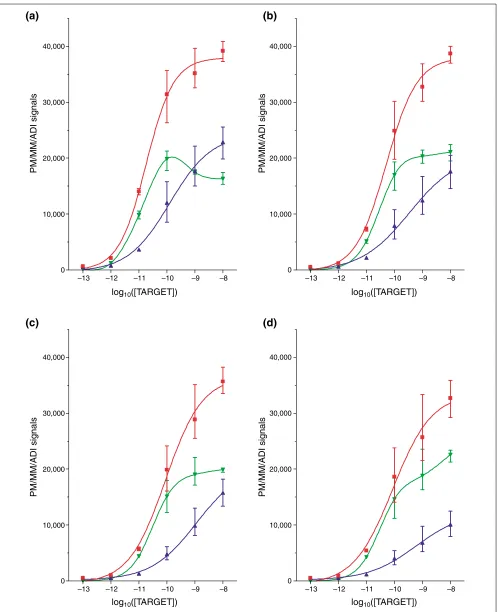
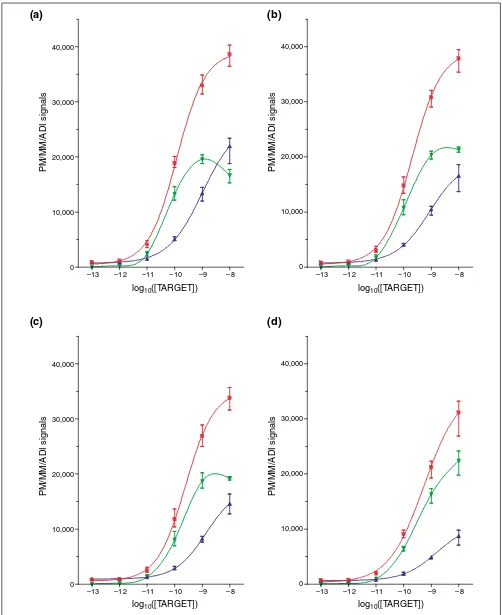
Figures 1 and 2 show that the plot of intensity versus target concentration has the typical sigmoidal shape encountered in chemical kinetics. The error bars reflect the range of observed values, which increases for measurements obtained subse-quent to the lag phase and is greatest for the 100 pM level. Table 1 supplements these graphs by distinguishing values at low transcript concentrations. Table 2 depicts averaged, pair-wise ADI ratios across consecutive dilution levels (four repli-cates per dilution; 16 pairs in total) after normalization. Given the sensitivity of the ratio to small absolute values, the variance of the ADI ratios in the 1-0.1 pM range was compa-rable to that of the mean, and was highly influenced by the outlier-removal algorithm. It is worth noting that normaliza-tion did not have a significant effect owing to the extremely uniform conditions of this study.
comment
reviews
reports
deposited research
interactions
information
[image:3.609.57.555.84.696.2]refereed research
Figure 1
PM, MM, and ADI signals without cRNA background. PM, red; MM, blue; ADI, green. (a)PheX_3; (b)ThrX_5; (c)DapX_M; (d)LysX_5.
–13 –12 –11 –10 –9 –8 –13 –12 –11 –10 –9 –8
–13 –12 –11 –10 –9 –8
PM/MM/ADI signals
PM/MM/ADI signals
PM/MM/ADI signals
PM/MM/ADI signals
–13 –12 –11 –10 –9 –8
log10([TARGET])
log10([TARGET])
log10([TARGET])
log10([TARGET])
(a)
(b)
(c)
(d)
0 10,000 20,000 30,000 40,000
0 10,000 20,000 30,000 40,000 0
10,000 20,000 30,000 40,000
Figure 2
PM, MM, and ADI signals with cRNA background. PM, red; MM, blue; ADI, green. (a)PheX_3; (b)ThrX_5; (c)DapX_M; (d)LysX_5.
PM/MM/ADI signals
PM/MM/ADI signals
PM/MM/ADI signals
PM/MM/ADI signals
log10([TARGET]) log10([TARGET])
log10([TARGET]) log10([TARGET])
(a)
(b)
(c)
(d)
–13 –12 –11 –10 –9 –8 –13 –12 –11 –10 –9 –8
–13 –12 –11 –10 –9 –8 –13 –12 –11 –10 –9 –8 0
10,000 20,000 30,000 40,000
0 10,000 20,000 30,000 40,000
10,000 20,000 30,000 40,000
0
10,000 20,000 30,000 40,000
that less than 20% of the MM signal at the 100 pM level reflects nonspecific binding. The major component of the MM signal (66-80%) therefore constitutes interaction with the intended PM target transcript. Absolute values for the same transcript concentration differ significantly, despite averaging over 20 probe pairs, which shows the influence of selected probe sequences (Table 1).
Addition of a complex cRNA background elicited a profound effect on observed intensities, especially at the lower range of concentration. The absolute values of PM and MM increased for the 0.1 pM level whereas they decreased for the 10 pM and 100 pM levels (Table 1). Surprisingly, the decrease in absolute values for 100 pM resulted in the improved sensitivity of the 100-10 pM average ADI ratio (factor of 6 versus factor of 3). In addition, the signal-to-noise ratio (when defined as ADI/MM) decreased dramati-cally in the 0.1-10 pM range whereas the standard error of the 10-1 pM ADI ratios increased (Table 1). For the 0.1 pM target concentration, all 12 target transcripts were detectable in the absence of brain cRNA background. However, the
presence of complex cRNA essentially rendered them unde-tectable. It is evident that the complex cRNA background had a nonlinear effect on the ADI, with up to a fourfold dif-ference in the average ADIs observed for the same quantity of transcript (Figure 3).
To study the effect of hybridization duration, the 0.1, 1 and 10 pM hybridizations were repeated in the presence of fixed eukaryotic background with the hybridization time doubled from 16 to 32 hours. A marginal increase in the average ADI was observed (by around 10%) although such increase was within the observed 16-hour range. Additionally, the increase in signal for the 10 pM level remained consistently less than half of that obtained in the absence of complex cRNA. The increased hybridization time did result in partial detection of prokaryotic controls at 0.1 pM (5 out of 12 transcripts).
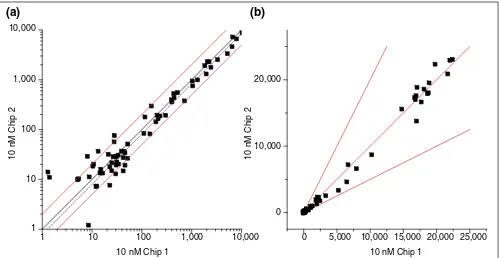
Finally, to examine reproducibility, a scatter plot of the log of gene ADIs for two distinct hybridizations (10 pM tran-script concentration in the presence of fixed eukaryotic background) was produced (Figure 4a). About 10% of the
comment
reviews
reports
deposited research
interactions
information
[image:5.609.56.552.118.473.2]refereed research
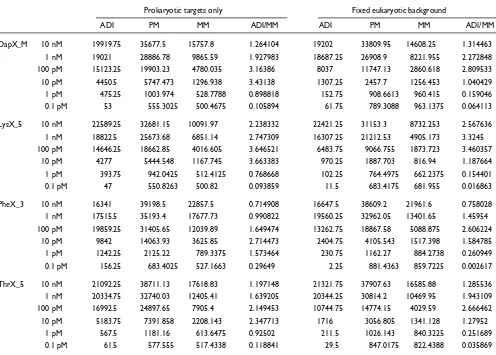
Table 1
ADI, PM, MM and signal-to-noise ratio (data not normalized)
Prokaryotic targets only Fixed eukaryotic background
ADI PM MM ADI/MM ADI PM MM ADI/MM
DapX_M 10 nM 19919.75 35677.5 15757.8 1.264104 19202 33809.95 14608.25 1.314463
1 nM 19021 28886.78 9865.59 1.927983 18687.25 26908.9 8221.955 2.272848
100 pM 15123.25 19903.23 4780.035 3.16386 8037 11747.13 2860.618 2.809533
10 pM 4450.5 5747.473 1296.938 3.43138 1307.25 2457.7 1256.453 1.040429
1 pM 475.25 1003.974 528.7788 0.898818 152.75 908.6613 960.415 0.159046
0.1 pM 53 555.3025 500.4675 0.105894 61.75 789.3088 963.1375 0.064113
LysX_5 10 nM 22589.25 32681.15 10091.97 2.238332 22421.25 31153.3 8732.253 2.567636
1 nM 18822.5 25673.68 6851.14 2.747309 16307.25 21212.53 4905.173 3.3245
100 pM 14646.25 18662.85 4016.605 3.646521 6483.75 9066.755 1873.723 3.460357
10 pM 4277 5444.548 1167.745 3.663383 970.25 1887.703 816.94 1.187664
1 pM 393.75 942.0425 512.4125 0.768668 102.25 764.4975 662.2375 0.154401
0.1 pM 47 550.8263 500.82 0.093859 11.5 683.4175 681.955 0.016863
PheX_3 10 nM 16341 39198.5 22857.5 0.714908 16647.5 38609.2 21961.6 0.758028
1 nM 17515.5 35193.4 17677.73 0.990822 19560.25 32962.05 13401.65 1.45954
100 pM 19859.25 31405.65 12039.89 1.649474 13262.75 18867.58 5088.875 2.606224
10 pM 9842 14063.93 3625.85 2.714473 2404.75 4105.543 1517.398 1.584785
1 pM 1242.25 2125.22 789.3375 1.573464 230.75 1162.27 884.2738 0.260949
0.1 pM 156.25 683.4025 527.1663 0.29649 2.25 881.4363 859.7225 0.002617
ThrX_5 10 nM 21092.25 38711.13 17618.83 1.197148 21321.75 37907.63 16585.88 1.285536 1 nM 20334.75 32740.03 12405.41 1.639205 20344.25 30814.2 10469.95 1.943109
100 pM 16992.5 24897.65 7905.4 2.149453 10744.75 14774.15 4029.59 2.666462
10 pM 5183.75 7391.858 2208.143 2.347713 1716 3056.805 1341.128 1.27952
1 pM 567.5 1181.16 613.6475 0.92502 211.5 1026.143 840.3225 0.251689
points corresponding to positive ADIs fell outside the region corresponding to a factor of 2 deviations from the mean.
Discussion
This study was designed to validate objectively the sensitiv-ity of the Affymetrix GeneChip® array. Whereas excellent
earlier studies show a quantitative relationship between the ADI and transcript abundance [2,3], the experimental design of this study differs significantly from those described in earlier publications in order to assess the system’s capa-bilities under conditions closer to real-life experiments. These differences include: increased precision in spiked transcript concentration through dilution from the same IVT product; utilization of Test2 chips reflecting current probe sets and production chemistry; no post-hybridization strep-tavidin amplification; multiple measurements per condition; comparison of transcript intensities obtained with absent or present complex cRNA background; and the use of commer-cially available Test2 arrays rather than custom-made arrays containing hundreds of probe pairs per gene.
Of practical consideration is the ability of the system to provide a robust, directional measure of transcript levels. In order for the system to reliably characterize gene expression, correspondence between the quantity of transcript and the numerical measure selected as its proxy (intensity) must be demonstrated. It has been shown previously that the ADI is proportional to cRNA level and predictive of absolute RNA concentration within a factor of 2 [2-4]. Typically, the latter is demonstrated by plotting the log of gene ADIs between two identical tissue samples with 98% [3] of the points falling within a region bounded by the lines y = 2x and y= 0.5x (factor of 2 region). Although never rigorously derived, this region can be viewed as an empirical analogy of
the confidence region. It is clear that although this assertion may hold for an average gene, it will be more likely to fail for rare genes with small ADIs (Figure 4a). Comparison of Figure 4a and b shows how the log scale gives a somewhat misleading impression of the uniformity of the ‘factor of 2’ region across the dynamic range. In addition, it is important to remember that sequence diversity and amount of cRNA will nonlinearly affect probe-target binding kinetics and, by extension, intensities. Even averaged ADIs for an identical quantity of transcript differed dramatically (up to a factor of 4), solely because of the presence of eukaryotic cRNA background. This effect is difficult to account for through linear normalization schemes currently used. It is important to note that the experimental conditions underlying the initial ‘factor of 2’ claim are quite specific and relate to cRNA derived from the same yeast source.
As evidenced by the range bars in Figures 1 and 2, the vari-ability of actual transcript intensities appears to increase with concentration. It has been suggested that variability can be reduced by selecting pixels adaptively [5]. However, it is not clear how to account algorithmically for large pixel-to-pixel variability from the biophysical or statistical stand-point, given that each pixel is supposed to contain an identical distribution of millions of oligonucleotides. A con-tributing factor to spatial variability appears to be micro-scopic defects on the surface of the wafer [6]. Investigation of the nature of pixel-to-pixel variability may potentially improve the predictive utility of obtained data.
The observed linear range of the ADI is narrower than that previously reported [2], and potentially inflated from what might typically be encountered given the reduction in proce-dural variability achieved through the comparatively uniform conditions of the experiments presented here. It is worth noting, however, that the linear range initially reported [2] was obtained using a custom array containing probe sets with more than 500 PM/MM probe pairs per gene. Consequently, it is not surprising that even with tech-nological advances in chip manufacturing over the past four years, we are still unable to reproduce fully the linear range of the ADI using commercial chips with 20 or fewer PM/MM probe pairs per probe set.
[image:6.609.54.298.86.272.2]The premise that subtraction of the MM from PM essentially serves to extract constructively the nonspecific components (cross-hybridization, noise, and so on) of the signal common to both should be reconsidered in the light of the results obtained in this study. It appears to perform inadequately for low and high transcript concentrations alike, although the basis for the failure differs. At high concentrations (above 100 pM level), the rate of increase of the MM signal can eclipse that of the PM signal (Figures 1d, 2d, Table 1 for PheX_3) resulting in an eventual decline in the ADI (Figures 1d, 2d for PheX_3). For example, the average ADI of the ThrX_3 probe set at 1 nM was approximately 47%
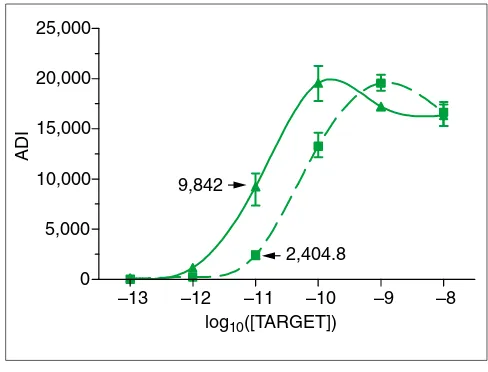
Figure 3
Sigmoidal fits to ADIs for PheX_3. Upper curve was obtained without cRNA background.
–13 –12 –11 –10 –9 –8 0
5,000 10,000 15,000 20,000 25,000
9,842
ADI
2,404.8
higher than at 10 nM (Table 1). Probe-target binding can be characterized by sigmoidal dose-response curves with differ-ent parameters. While both PM and MM seem to have com-parable maximum slopes, due to lower target affinity, the linear response phase of the MM signal is shifted from that of the PM signal (it occurs at higher concentrations). Conse-quently, the ADI decreases for high target concentrations where the slope of the PM sigmoidal has tapered. Reports that the ADI saturates simply as a result of saturation of both the MM and PM signals [2] do not seem to be supported by our results. It should be noted that part of the observed satu-ration effect is attributable to limited scanner sensitivity, which might reflect a limitation of our installation. Scanner-related saturation is functionally Scanner-related to absolute inten-sity, which, in turn, is dependent on underlying probe kinetics. Examination of individual probe signals suggests that scanner effects are likely to be more pronounced at higher target concentrations (1-10 nM), as many of the probes have reached the maximum detectable intensity (around 46,000). However, saturation in the 10-100 pM range is most likely to be dominated by the kinetic proper-ties of the PM and MM probes.
At the lower end of transcript concentration, it seems that eukaryotic background affects the PM and MM probes non-symmetrically, generally resulting in a decrease in the ADI. Notably, the DapX_M probe set in Table 1 has a positive ADI for 0.1 pM level even though the MM signal is greater than
the PM signal before outlier removal. Additionally, the same outlier-removal algorithm rendered the small 0.1 pM ADI for the PheX_3 nonexistent, suggesting that simple heuris-tics can fail in a low signal-to-noise environment. Outlier classification is perhaps best addressed using a functional (kinetic), as opposed to a purely inferential, profile con-structed from a large repository of experimental data. Given the large number of experiments used to derive the ADI, such an approach would seem eminently feasible. In lieu of an ideal functional profile, the use of alternative heuristics may be promising. For example, PM + MM - background (PM + MM also mentioned in [5]), while being less sensitive in the 1-10 pM range, was more sensitive for higher ranges and more robust for 0.1-1 pM.
Given that a significant number of genes of biological inter-est have transcript frequencies at or below 1 pM [7], the commercial usefulness of the system is constrained by the minimum abundance level that is reliably detectable. A current limit of 1 in 2 x 10⁶ transcripts, that is, around
0.075 pM or 1 in 7 cells) has been reported [4]. Indeed, the Affymetrix GeneChip®array was able to detect this very low
transcript level in the absence of eukaryotic background. However, after addition of cRNA background, transcripts at the 0.1 pM concentration became essentially undetectable for all 12 independent transcripts, whereas 1 pM transcripts remained robustly detected. Our results are consistent with a recent study [8] showing a range of detection between 1 in
comment
reviews
reports
deposited research
interactions
information
[image:7.609.55.554.86.344.2]refereed research
Figure 4
Correlation between hybridization results obtained for the same RNA sample. (a)Log space plot; (b)linear space plot. Uniform ‘factor of 2’ region (see text) in the log space plot does not have an intuitive physical counterpart in linear space. It underestimates variability at the low end of ADIs.
1 10 100 1,000 10,000 0 5,000 10,000 15,000 20,000 25,000
1 10 100 1,000 10,000
10 nM Chip 1 10 nM Chip 1
0 10,000 20,000
10 nM Chip 2 10 nM Chip 2
300,000 and 1 in 50,000 (0.5-1.5 pM). It is possible to argue that post-hybridization amplification would improve detec-tion, but obviously at the expense of potentially saturating expression levels of more abundant genes. Perhaps scanning images before and after amplification could maximize detection without suffering saturation penalties. Longer hybridization cycles seem to be a viable alternative, as these enabled partial detection of transcripts (about 5 out of 12) at the 0.1 pM level without significantly affecting high-end intensities. Given the current inability to localize transcripts with similar abundances on different arrays, care should be taken to ensure a sufficient overall number of replicates to obtain a small standard error for 0.1 pM level measure-ments. Also, new methods of mRNA amplification [9] that
[image:8.609.61.559.115.536.2]robustly increase the hybridization concentration of rare transcripts might improve detectability but could simultane-ously distort the underlying RNA expression profile. The addition of eukaryotic background had a profound effect on the properties of thermodynamic equilibrium of probe-target binding. The decrease in 10 pM and 100 pM intensi-ties suggests the presence of complex, stable interactions (that is, cross-target binding) which persist subsequent to the 32-hour hybridization. A similar hypothesis was previ-ously proposed [4] where probe-probe interactions were implicated. We believe that cross-target interactions are more important in our case as the saturation level was not affected by cRNA background. The marginal increase in the signal after 32 hours of hybridization, though, suggests that
Table 2
ADI fold changes
10-1 nM 1 nM-100 pM 100-10 pM 10-1pM 1-0.1pM
Fold SE Fold SE Fold SE Fold SE Fold SE
Prokaryotic targets only
LysX-5_at 1.55 0.18 1.65 0.17 3.84 0.68 9.53 1.99 10.22 3.16
LysX-M_at 1.14 0.22 1.45 0.22 4.06 0.73 8.73 2.31 10.18 2.83
LysX-3_at 1.38 0.23 1.25 0.13 2.74 0.43 7.97 1.83 9.82 2.14
PheX-5_at 1.44 0.24 1.43 0.15 2.74 0.24 6.90 0.94 10.23 1.96
PheX-M_at 1.29 0.27 1.38 0.18 2.46 0.24 7.66 0.88 9.69 1.65
PheX-3_at 1.22 0.34 1.15 0.21 2.24 0.33 7.18 1.21 9.03 1.57
DapX-5_at 1.53 0.19 1.76 0.25 4.30 0.87 8.65 1.99 8.97 1.89
DapX-M_at 1.35 0.24 1.62 0.17 3.84 0.66 8.50 2.14 10.22 2.33
DapX-3_at 1.14 0.20 1.76 0.23 4.19 0.75 8.85 1.93 10.18 2.60
ThrX-5_at 1.36 0.39 1.56 0.28 3.72 0.66 8.38 1.82 10.52 2.34
ThrX-M_at 1.33 0.23 1.56 0.20 4.06 0.75 9.04 2.05 9.96 2.92
ThrX-3_at 0.99 0.40 1.12 0.29 2.94 0.60 8.25 2.31 10.10 2.83
Fixed eukaryotic background
LysX-5_at 1.45 0.22 2.76 0.44 6.48 1.25 9.58 1.91 8.21 2.20
LysX-M_at 0.94 0.16 2.19 0.43 7.15 1.72 6.99 1.97 3.39 0.82
LysX-3_at 1.10 0.14 1.53 0.22 5.37 0.96 6.71 1.20 4.83 0.79
PheX-5_at 1.10 0.11 1.93 0.25 4.55 0.32 9.28 1.26 29.65 6.72
PheX-M_at 1.05 0.17 1.49 0.21 4.63 0.65 9.75 1.20 34.84 20.84
PheX-3_at 0.98 0.15 1.59 0.27 6.12 0.88 9.75 1.46 22.89 4.01
DapX-5_at 1.25 0.15 2.88 0.49 5.87 1.28 9.59 2.59 6.25 2.55
DapX-M_at 1.08 0.15 2.57 0.45 6.01 1.33 8.00 1.41 2.28 0.18
DapX-3_at 1.12 0.11 2.63 0.46 9.26 1.32 8.25 1.99 175.29 16.17
ThrX-5_at 1.11 0.17 2.09 0.37 6.14 1.34 7.90 1.57 7.37 1.26
ThrX-M_at 1.12 0.14 2.19 0.37 6.35 1.40 9.98 1.86 24.77 24.52
ThrX-3_at 0.63 0.10 1.75 0.33 5.31 0.73 9.62 2.01 11.32 1.11
thermodynamic equilibrium was not quite reached in 16 hours. The increase in signal for 0.1 pM is obviously due to increased background noise. The net result of cRNA back-ground is that it has a nonlinear effect on the ADIs (Figure 3), which is impossible to compensate for using linear methods.
Conclusions
Our findings suggest that while high-density microarrays are a convenient way of monitoring thousands of genes simulta-neously, increased care is needed in the design of experi-ments and scrutiny of the predictive utility of the numerical measure used to represent gene expression. An increase in the number of replicates is preferable to reliance upon mag-nitudes of fold changes, as the latter is not always linearly related to target concentration and is extremely variable for low transcript concentrations. In light of the fact that the MM signal predominantly characterizes interactions with the target transcript, a different heuristic used to weight the MM signal accordingly for each probe pair might further improve the quality of Affymetrix GeneChip® array data.
Perhaps such an approach underlies the announced sup-planting of historical algorithms in the impending GeneChip 5.0 release. Finally, longer hybridization times can improve partial detection of transcripts expressed at very low levels.
Materials and methods
Preparation of labeled targets for hybridization The Test2 array (Affymetrix, Santa Clara, CA) contains probes corresponding to commonly expressed genes from the human, mouse, rat and yeast genomes, along with several prokaryotic control genes. For each of these genes, probes derived from the 5?, middle and 3?portions of the genes are arrayed. The prokaryotic controls used in this study contain engineered poly(A)+tails and are available through the
Amer-ican Type Culture Collection [10] (dapB, ATCC 87486; lysA, ATCC 87482; pheB, ATCC 87483; and thrC, ATCC 87484). Methods for preparing cRNA and subsequent steps leading to hybridization and scanning of the Test2 arrays were provided by the manufacturer. Briefly, amplified and purified prokary-otic control vectors were linearized at the 5?end using XhoI and purified by gel electrophoresis. Poly(A)+cDNA was
tran-scribed in vitro by incorporation of biotinylated CTP and UTP (Enzo Diagnostics, Farmingdale, NY) using a BioArray High Yield RNA Transcript Labeling kit according to the manufacturer’s instructions. The labeled cRNA was purified using RNeasy spin columns (Qiagen, Chatsworth, CA), fol-lowed by DNase I treatment and a second round of RNeasy spin-column purification. The integrity of all labeled and purified transcript was checked by denaturing gel elec-trophoresis. Each of the four transcripts, dap, lys, phe and thr, were pooled, and fragmented in fragmentation buffer (40 mM Tris-acetate pH 8.1, 100 mM potassium acetate, 30 mM magnesium acetate), and brought up in hybridization
mix according to the manufacturer’s protocols (1 M NaCl, 10 mM Tris-acetate pH 8.1, 0.01% Triton-X 100, 1002g/ml herring sperm DNA, and 50 pM biotinylated control oligo 948) such that each of the combined transcripts would yield a final concentration of 10 nM. All subsequent serial dilutions were carried out using components of the hybridization buffer to yield final concentrations of 1 nM, 100 pM, 10 pM, 1 pM and 0.1 pM.
For all experiments simulating a complex background of eukaryotic transcripts, 202g total human brain RNA (Clon-tech, Palo Alto, CA) was used and processed according to Affymetrix protocols. Subsequent to in vitrotranscription, 42g labeled cRNA was included into a final volume of 802l hybridization mix per array, also containing the labeled prokaryotic transcripts.
Array hybridization and scanning
Before hybridization, the cRNA samples were heated to 94°C for 5 min, equilibrated to 40°C for 5 min, and clarified by centrifugation at 14,000gfor 5 min. Aliquots of the pooled samples and tenfold dilutions of the pool in hybridization buffer were hybridized to Test2 arrays at 45°C for 16 h in a rotisserie oven set at 60 rpm. Subsequently, the arrays were washed with non-stringent wash buffer (0.9 M NaCl, 60 mM NaH2PO4, 6 mM EDTA, 0.01% Tween-20) at 25°C followed by stringent wash buffer (100 mM methyl ethyl sulfonate (MES), 100 mM NaCl, 0.01% Tween-20) at 50°C in a fluidics station (Affymetrix). The probe arrays were then stained by adding 802l staining solution (100 mM MES, 1 M NaCl, 0.05% Tween-20 with 2 mg/ml acetylated BSA (Sigma, St Louis, MO) and 102g/ml streptavidin R-phycoerythrin (Mol-ecular Probes, Portland, OR) for 30 min at 25°C. After stain-ing, the arrays were rinsed with non-stringent wash buffer at 25°C and scanned using a GeneArray confocal scanner (Agilent, Palo Alto, CA).
To evaluate the influence of hybridization duration on inten-sity values, the 0.1 pM, 1 pM and 10 pM prokaryotic target concentrations were repeated in experiments where the hybridization time was extended to 32 h with all other condi-tions left unchanged.
Data analysis
Data analysis was performed using the Affymetrix GeneChip array 4.0 software. Four chips representing one target concen-tration level (that is, 10 pM) were paired with four chips from the following target concentration level (that is, 1 pM) result-ing in 16 total pairs. For each pair, the data was multiplied by a normalization factor (calculated with a mask excluding prokaryotic target transcripts) to make the average signal for both arrays equivalent. Fold changes were subsequently aver-aged across different pairs, excluding fold changes involving negative ADIs. All normalization factors were within 10% of 1. Statistical curve fitting was carried out using GraphPad Prism 2.01. Sigmoidal dose-response curves were fitted to PM and
MM data, allowing all four parameters to be variable. The ADI was fitted with a 100 segment cubic spline.
Acknowledgements
We thank Michael Liebman for his support of this project and Paul Cannon, Al Baecker and Debra Cockayne for their helpful suggestions.
References
1. Forman JE, Walton ID, Stern D, Rava RP, Trulson MO: Thermody-namics of duplex formation and mismatch discrimination on photolithographically synthesized oligonucleotide arrays.
ACS Symp Ser 1998,682:206-228.
2. Lockhart DJ, Dong H, Byrne MC, Follettie MT, Gallo MV, Chee MS, Mittmann M, Wang C, Kobayashi M, Horton H, Brown EL: Expres-sion monitoring by hybridization to high-density oligonu-cleotide arrays.Nat Biotechnol 1996, 14:1675-1680.
3. Wodicka L, Dong H, Mittmann M, Ho MH, Lockhart DJ: Genome-wide expression monitoring in Saccharomyces cerevisiae.Nat Biotechnol 1997, 15:1359-1367.
4. Lipshutz RJ, Fodor SPA, Gingeras TR, Lockhart DJ: High density synthetic oligonucleotide arrays.Nat Genet1999, 21:20-24. 5. Schadt EE, Cheng L, Cheng S, Wong WH:Analyzing high-density
oligonucleotide gene expression array data. J Cell Biochem
1999, 80:192-202.
6. Mazzola LT, Frank CW, Fordor SPA, Mosher C, Lartius R, Hender-son E:Discrimination of DNA hybridization using chemical force microscopy.Biophys J1999, 76:2922-2933.
7. Mahadevappa M, Warrington JA: A high-density probe array sample preparation method using 10- to 100-fold fewer cells.Nat Biotechnol1999, 17:1134-1136.
8. Hill AA, Hunter CP, Tsung BT, Tucker-Kellogg G, Brown EL:
Genomic analysis of gene expression in C. elegans. Science
2000, 290:809-812.
9. Baugh LR, Hill AA, Brown EL, Huter CP: Quantitative analysis of mRNA amplification byin vitrotranscription.Nucleic Acids Res
2001, 29:1-2.