S O F T W A R E
Open Access
De novo
assembly of bacterial transcriptomes
from RNA-seq data
Brian Tjaden
Abstract
Transcriptome assays are increasingly being performed by high-throughput RNA sequencing (RNA-seq). For organisms whose genomes have not been sequenced and annotated, transcriptomes must be assembled de novofrom the RNA-seq data. Here, we present novel algorithms, specific to bacterial gene structures and transcriptomes, for analysis of bacterial RNA-seq data andde novotranscriptome assembly. The algorithms are implemented in an open source software system called Rockhopper 2. We find that Rockhopper 2 outperforms otherde novotranscriptome assemblers and offers accurate and efficient analysis of bacterial RNA-seq data. Rockhopper 2 is available at http://cs.wellesley.edu/~btjaden/Rockhopper.
Introduction
High-throughput RNA sequencing (RNA-seq) is being used increasingly for transcriptome assays [1]. One of the challenges for studies employing RNA-seq experiments is efficient and reliable extraction of transcriptomic insights from the wealth of seq data. Often, following RNA-seq experiments, the large resulting data sets are subjected to various stages of computational analysis, such as quality control, normalization, transcriptome assembly, quantifi-cation of transcript abundance, and testing for differential gene expression under various conditions [2]. Analysis of the data can be a bottleneck in RNA-seq studies owing to the size of the data, the complexity of the ana-lysis, and a lack of user-friendly software tools.
In particular, assembling transcripts is often a core stage of RNA-seq data analysis, yet efficient and accurate transcriptome assembly remains a challenging problem owing to a variety of factors, including artifacts from li-brary construction, errors in sequencing, variable intra-read and inter-intra-read error rates, repeat sequences, and transcript expression ranges that span several orders of magnitude [3]. Most approaches for assembling tran-scripts from short read sequences relate to one of two families: reference-based assembly and de novo assembly [4]. Reference-based assembly involves aligning sequen-cing reads to a sequenced reference genome. Reference-based assembly is generally preferable when a high-quality
genome sequence is available since reference-based ap-proaches are fast and relatively precise.De novo assem-bly involves assembling transcripts from sequencing reads by combining overlapping reads. De novo assem-bly is necessary when a high-quality reference genome is unavailable, such as for many non-model organisms, when analyzing complex microbial communities, in meta-transcriptome studies, and when investigating uncultur-able microorganisms.
A number of mature computational tools exist for both reference-based transcriptome assembly [5-7] and
de novotranscriptome assembly [8-11]. However, most of the aforementioned tools were designed primarily for eukaryotic transcriptomes. Bacterial transcriptome assem-bly faces different challenges than eukaryotic transcriptome assembly. For example, bacterial genomes are generally denser than eukaryotic genomes and neighboring bacterial transcripts frequently overlap, making it challenging to distinguish the boundaries of neighboring bacterial tran-scripts. Polycistronic messages further complicate bacter-ial transcriptome assembly, particularly when different promoters of an operon are employed under different conditions. Also, models for noncoding RNAs in eukary-otes are generally inappropriate for the small regulatory RNAs common in bacteria.
In an attempt to address the paucity of computational methods for assembling bacterial transcriptomes from RNA-seq data, we previously developed Rockhopper [12], a system that supports reference-based assembly of bacterial transcriptomes. In the current study, we have
Correspondence:[email protected]
Computer Science Department, Wellesley College, Wellesley, MA 02481, USA
developed novel algorithms forde novoassembly of bac-terial transcriptomes, which we have implemented in the system Rockhopper 2. We show that our algorithms for
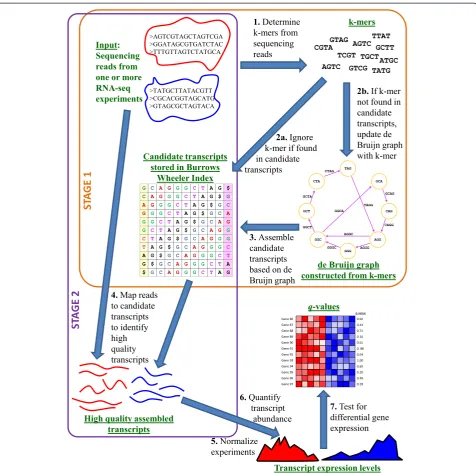
de novoassembly of bacterial transcriptomes outperform other leading approaches, in terms of both sensitivity and specificity. Further, our algorithms offer dramatic improvements in efficiency, so that our de novo assem-bly is comparable to reference-based assemassem-bly in terms of execution time. While manyde novoassemblers require high-performance computing platforms, Rockhopper 2 has been designed with limited resource requirements so that it performs effectively on common laptop machines. In addition tode novotranscriptome assembly, Rockhopper 2 is a comprehensive system that supports the various stages of RNA-seq data analysis, including normalizing data from different experiments, quantifying transcript abundance, and testing for differential transcript expres-sion. Details of the Rockhopper 2 workflow are illustrated in Figure 1. Finally, we developed Rockhopper 2 with user-friendliness in mind, so that it would be accessible to a broad range of scientists that use bacterial RNA-seq ex-periments in their investigations. Rockhopper 2 is open-source software implemented in Java, released under the GNU GPL license, and is available for all major platforms at [13,14].
Materials and methods Assembly algorithm
As input, Rockhopper 2 requires one or more files of se-quencing reads. Sese-quencing read files may be in fastq, qseq, fasta, sam, or bam format [15]. Files in fastq, qseq, or fasta format optionally may be gzipped. Rockhopper 2 works with single-end reads as well as paired-end reads, and reads may be strand-specific or strand-ambiguous.
De novotranscriptome assembly in Rockhopper 2 pro-ceeds in two stages (Figure 1). In the first stage, candi-date transcripts are assembled fromk-mers found in the sequencing reads (k= 25 by default). After the first stage, every k-mer in an assembled candidate transcript will correspond to at least one k-mer from a sequencing read. However, candidate transcripts may not be sup-ported by full-length reads. Thus, in a second stage, se-quencing reads are mapped to candidate transcripts in order to filter candidate transcripts into a set of high quality final transcripts that are well supported by full-length sequencing reads. Algorithmic details of each stage are provided below.
In the first stage of de novo transcriptome assembly, Rockhopper 2 maintains two data structures, a de Bruijn graph [16,17] and a Burrows-Wheeler index [18,19]. While de Bruijn graphs are common among de novo
assemblers [4,17], Burrows-Wheeler indices are not. Instead, Burrows-Wheeler indices are common in reference-based assemblers [2]. But it is precisely the
integration of the two structures, working in concert, that enables Rockhopper 2’s speed and minimal mem-ory usage, distinguishing it from otherde novo assem-blers. Both data structures are initially empty and are populated as sequencing reads are processed in the first stage. The de Bruijn graph is implemented with a hash table, wherek-mer graph edges are stored as keys in the table and k-mer edge occurrences are stored as values in the table. Graph nodes are stored implicitly. The Burrows-Wheeler index keeps track of assembled candidate transcripts. For each sequencing read, its set of k-mers is determined. If a k-mer already occurs in the Burrows-Wheeler index, that is, is already part of an assembled candidate transcript, then the k-mer is not considered further. If the k-mer is not part of an assembled candidate transcript, then the de Bruijn graph is updated with thek-mer.
As k-mers are added to the de Bruijn graph, it grows in size. As more memory is consumed and the amount of available memory approaches zero, Rockhopper 2 re-duces the size of the de Bruijn graph by assembling can-didate transcripts. Paths through the graph are traversed, beginning with the most frequently occurring edges. For each edge with frequency at leastα, a path is started and greedily extended if a neighboring edge can be found with frequency at leastβ(default valuesα= 50 andβ= 5 were determined empirically). When an edge is traversed, it is removed from the graph. A path corresponds to an assembled candidate transcript. When a path is extended as far as possible, the corresponding assembled candidate transcript is added to the Burrows-Wheeler index.
A de Bruijn graph has 4kpotential edges, which requires more memory to store than is available on most personal computers. As RNA-seq experiments continue to generate increasing amounts of sequencing data, this limit will be approached in de Bruijn graph-based assemblers, unless sequencing error rates drop dramatically. Thus, most as-semblers require high-performance computing hardware with enhanced memory resources. Rockhopper 2 takes a different approach and limits the size of de Bruijn graphs. Rockhopper 2’s approach has two main advantages: it en-ables the system to run on common personal computers and it quickly channels resources away from low fre-quencyk-mers that are likely to correspond to sequencing errors or other artifacts.
with the transcript. We keep track of how many full-length reads align to each candidate transcript and at what loci. Sufficiently long regions of candidate tran-scripts are retained as high quality finalized trantran-scripts if at leastεreads align throughout the length of the re-gion (ε= 20 by default).
[image:3.595.60.537.87.560.2]Followingde novoassembly of high quality transcripts, Rockhopper 2 proceeds with several post-assembly phases of analysis. To enable comparison between different samples and experiments, Rockhopper 2 normalizes each RNA-seq data set using upper quartile normalization [20]. Transcript abundance levels are estimated using a
measure similar to RPKM (reads per kilobase per million), which sums the number of reads for a transcript and divides by the transcript’s length and a normalization factor [7]. While the total number of reads in the sam-ple is often used to determine the RPKM normalization factor, Rockhopper 2 uses the more robust normalizer of upper quartile transcript expression [20]. Finally, Rockhopper 2 tests for differential transcript expression in pairs of conditions using the algorithm of DESeq [21]. In summary, Rockhopper 2 estimates the variance of a transcript’s expression, uses local regression to obtain a smooth estimate of the variance, and then per-forms a statistical test to determine whether a transcript shows differential expression in data from two or more conditions. The negative binomial distribution is used as the statistical model in order to compute a P-value indicating the probability of observing the transcript’s expression levels in the different conditions by chance. To correct for multiple tests across the set of transcripts,
P-values are corrected andq-values are reported that con-trol the false discovery rate using the Benjamini-Hochberg procedure [22].
High-throughput sequencing data
Escherichia colistrain MG1655 was used in three biological replicate DNA-seq experiments (Cari Vanderpool, personal communication). Library construction and sequencing on an Illumina HiSeq 2500 were performed at the WM Keck Center for Comparative and Functional Genomics at the University of Illinois at Urbana-Champaign. The DNA li-braries were prepared with the KAPA Library Preparation
Kits (KAPA Biosystems (Wilmington, MA, USA)). The li-braries were quantified by quantitative PCR , pooled in equimolar concentration, and sequenced on one lane for 101 cycles from one end of the fragments using a TruSeq SBS version 3 sequencing kit (Illumina (San Diego, CA, USA)). The fastq files were generated with Casava 1.8.2 (Illumina).
RNA-seq data from E. coli, Streptococcus pyogenes,
Mycobacterium tuberculosis,Bacillus subtilis, Staphylococ-cus aureus, Pyrococcus abyssi, Acinetobacter oleivorans,
Propionibacterium acnes, Methanobrevibacter smithii,
Clostridium acetobutylicum, and Deinococcus gobiensis
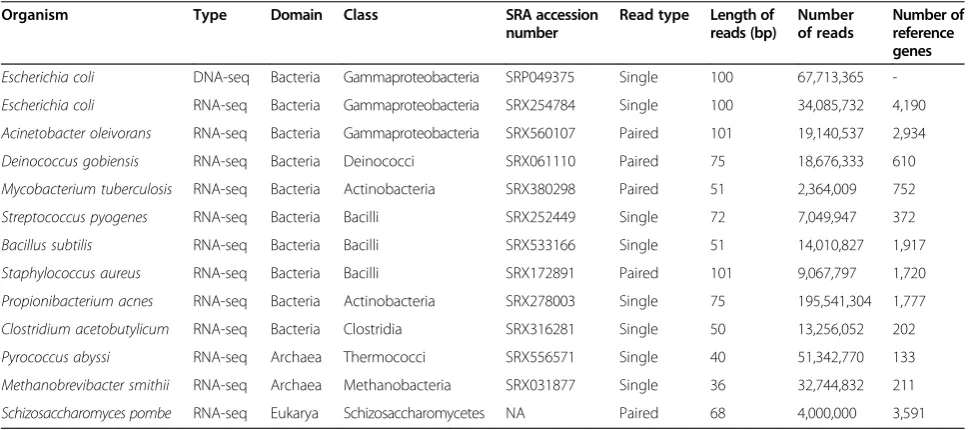
were downloaded from the Sequence Read Archive (SRA) [23]. Details on each RNA-seq data set, including accession number in the SRA, length of the reads, whether the reads are single-end or paired-end, and the number of reads, is provided in Table 1. The Schizosac-charomyces pombe RNA-seq data [24] were downloaded from the Trinity tutorial [25].
Performance evaluation
[image:4.595.56.541.502.717.2]In order to evaluate Rockhopper 2’s performance, we compared it with two leadingde novotranscriptome as-semblers: Trinity version trinityrnaseq_r20140413p1 [8,25] and SOAPdenovo2 version 2.04 [10,26]. Default parameters were used for Trinity (Trinity–seqType fq -JM 10G -CPU 8) and SOAPdenovo2 (SOAPdenovo-63mer all -p 8 -d 49). All three assemblers were executed on the same hardware with the number of processors set to 8. The three software systems were used to assemble tran-scriptomes using sequencing data from 12 microorganisms
Table 1 Sequencing data sets
Organism Type Domain Class SRA accession
number
Read type Length of
reads (bp)
Number of reads
Number of reference genes
Escherichia coli DNA-seq Bacteria Gammaproteobacteria SRP049375 Single 100 67,713,365
-Escherichia coli RNA-seq Bacteria Gammaproteobacteria SRX254784 Single 100 34,085,732 4,190
Acinetobacter oleivorans RNA-seq Bacteria Gammaproteobacteria SRX560107 Paired 101 19,140,537 2,934
Deinococcus gobiensis RNA-seq Bacteria Deinococci SRX061110 Paired 75 18,676,333 610
Mycobacterium tuberculosis RNA-seq Bacteria Actinobacteria SRX380298 Paired 51 2,364,009 752
Streptococcus pyogenes RNA-seq Bacteria Bacilli SRX252449 Single 72 7,049,947 372
Bacillus subtilis RNA-seq Bacteria Bacilli SRX533166 Single 51 14,010,827 1,917
Staphylococcus aureus RNA-seq Bacteria Bacilli SRX172891 Paired 101 9,067,797 1,720
Propionibacterium acnes RNA-seq Bacteria Actinobacteria SRX278003 Single 75 195,541,304 1,777
Clostridium acetobutylicum RNA-seq Bacteria Clostridia SRX316281 Single 50 13,256,052 202
Pyrococcus abyssi RNA-seq Archaea Thermococci SRX556571 Single 40 51,342,770 133
Methanobrevibacter smithii RNA-seq Archaea Methanobacteria SRX031877 Single 36 32,744,832 211
Schizosaccharomyces pombe RNA-seq Eukarya Schizosaccharomycetes NA Paired 68 4,000,000 3,591
with sequenced and annotated genomes, though the genomes and their annotations were not used by any of the software systems during assembly. The genome se-quences and annotations were used only to evaluate thede novoassembled transcriptomes.
A variety of measures was used to evaluate the perform-ance of the different assemblers [4,27]. In some cases, the correspondence between assembled transcripts and anno-tated genes is assessed. Since not all genes are likely to be expressed in a given experiment, the de novo assembled transcripts are compared not against all annotated genes but against a subset of annotated genes, which we call ref-erence genes. A refref-erence gene is defined as a gene where every k-mer in the gene sequence (k= 25) occurs in at least one sequencing read. Reference genes can possibly be reconstructed by thede novoassemblers whereas non-reference genes cannot. The set of non-reference genes is analogous to the Oracle Set used to evaluate the Trinity system [8].
Specificity is a measure that represents the percentage of assembled transcripts that align to the genome. Specifi-city can be expressed as (1.0 - False positive rate), where a false positive is an assembled transcript that does not align to the genome. Specificity is calculated as:
X t∈TI
at G
j j
t
j j ≥δ
T
j j
whereT is the set of assembled transcripts and Gis a genome. at
G is the alignment of the sequence of t to
the sequence ofG, and at
G is the length of the
align-ment. I is an indicator function with parameter δ set to 1.0.
Sensitivity represents the percentage of sequence from reference genes covered by assembled transcripts. Sensitivity in this context is sometimes referred to as the coverage or completeness of an assembler. Sensitivity is given by:
X g∈R g
T X
g∈Rj jg
where R is the set of reference genes. Following align-ment of assembled transcripts in T to the set of refer-ence genes R, |gT| is the number of nucleotides in the sequence of reference gene gthat are covered via align-ment by one or more transcripts from T. In the special case of assessing the quality of assemblies from DNA-seq data rather than RNA-DNA-seq data, sensitivity represents the percentage of sequence from the entire genome,
rather than from reference genes, covered by assembled transcripts:
GT =j jG
Contiguity represents the percentage of reference genes that are at leastδ= 80% covered by a single longest assem-bled transcript [4]. Contiguity is defined as:
X g∈RI
gT0 g
j j ≥δ
R
j j
wheregT0is the number of nucleotides in the sequence of
reference gene g that are covered via alignment by the transcript fromTthat has the longest alignment tog. Iis an indicator function with parameterδset to 0.8.
RMBT (reads mapping back to transcripts) represents the percentage of sequencing reads that align to an as-sembled transcript. RMBT is given by:
X s∈SI
as T
j j
s
j j ≥δ
S
j j
where S is the set of sequencing reads, asT is the align-ment of the reads to the set of assembled transcriptsT, and asT is the length of the alignment.Iis an indicator function with parameterδset to 1.0.
Accuracy represents the percentage of correctly as-sembled bases; that is, for those transcripts that align to the genome, the accuracy is the percentage of perfect matches in the alignments (as opposed to mismatches or gaps). Accuracy is calculated as:
X
t∈TPM a t G X
t∈T a t G
where PM atG is the number of perfect matches in the alignment of the sequence t to the sequence of G, and atG is the length of the alignment. Efficiency represents the execution time of an assembler, as measured in mi-nutes. Resourcefulness represents the amount of memory (RAM) required during an assembly.
Results
and the genome sequences and annotations. To provide points of comparison, two leadingde novotranscriptome assemblers, Trinity [8,25] and SOAPdenovo2 [10,26], were executed on the same data, and their results are compared with those of Rockhopper 2.
Genomic DNA-seq data
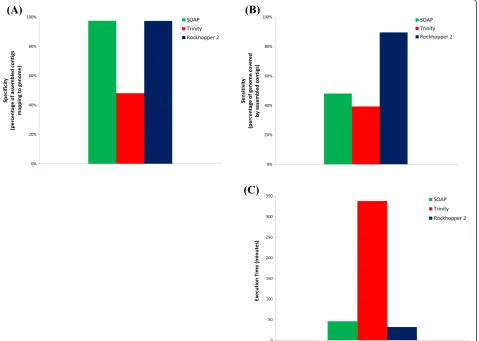
[image:6.595.61.541.343.684.2]We used three biological replicates of genomic DNA-seq data from E. coli (see Materials and methods) for pre-liminary assessment of Rockhopper 2’s performance. Genome assembly based on DNA-seq data is generally more straightforward than transcriptome assembly based on RNA-seq data since RNA-seq data correspond to transcripts with highly variable expression levels and lengths, whereas DNA-seq data do not. Thus, the perform-ance of an assembler using DNA-seq data can suggest an upper bound on the quality of the assembly that we can ex-pect from the assembler using RNA-seq data.
Figure 2 and Additional file 1 provide statistics on as-semblies based on the DNA-seq data. Rockhopper 2 and
SOAPdenovo2 both had close to 100% specificity, indicat-ing that the vast majority of their assembled contigs could be aligned to theE. coligenome (Figure 2A). In contrast, just over half of the contigs assembled by Trinity were considered false positives in that they did not align to the
E. coli genome (Figure 2A). Further, Rockhopper 2’s as-sembly had a sensitivity of approximately 90%, indicating that 90% of the genome was covered by Rockhopper 2’s assembled contigs (Figure 2B). While Rockhopper 2 was not designed as a genome assembler, these results suggest that it does a plausible job of reconstructing most of the
E. coli genome. For comparison, the contigs assembled by SOAPdenovo2 and Trinity covered just under half theE. coli genome (Figure 2B). Regions of the genome that were not covered by contigs from any of the as-semblers generally correspond to some combination of repeat regions, errors in sequencing reads, and biases during library construction and high-throughput sequen-cing. Finally, we found that Rockhopper 2 required about 32 minutes to generate its assembly, a rate comparable to
that of SOAPdenovo2 and substantially faster than that of Trinity (Figure 2C).
RNA-seq data
While DNA-seq data provide a starting point for under-standing the quality of assemblies, the performance of an assembler using RNA-seq data is more meaningful. Thus, we gathered data from RNA-seq experiments con-ducted by 12 different labs for 12 different microorganisms (see Materials and methods). The organisms included nine bacteria, two archaea, and one fungus. While Rockhopper 2 was not designed for eukaryotic transcriptome assembly, we evaluated its performance on data from the fungus S. pombe primarily because this same data set was used by the authors of the Trinity assembler to assess Trinity’s per-formance [8,25]. The 12 organisms represented in our ana-lysis were chosen to reflect a wide range of phylogenetic diversity in order to help us understand the robustness of our assemblies. The 12 RNA-seq data sets range in size from approximately 2 million reads to 200 million reads and include 7 sets of single-end sequencing reads and 5 sets of paired-end sequencing reads (Table 1).
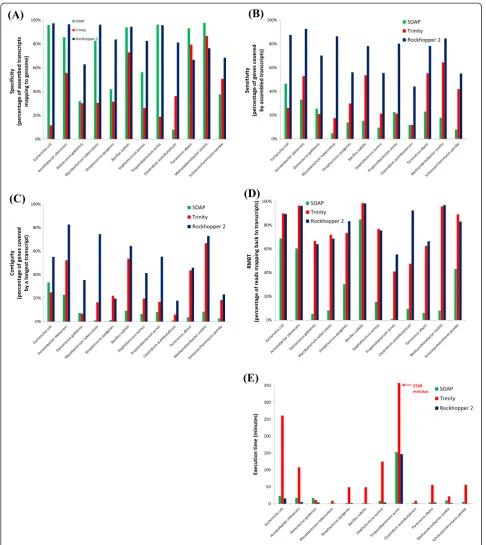
A variety of statistics (see Materials and methods) was used to evaluate the assemblies produced by Rockhopper 2, Trinity, and SOAPdenovo2 across the 12 RNA-seq data sets and the results are provided in Figure 3 and Additional file 1. Rockhopper 2 and SOAPdenovo2 generally had the highest specificity, generating fewer false positive assem-bled transcripts that did not align to the corresponding genome (Figure 3A). Interestingly, Rockhopper 2’s specifi-city was lowest among the three assemblers on the two ar-chaea data sets, but otherwise was among the highest. Assembly of additional RNA-seq data sets from prokary-otes beyond the 11 used in this study will help illuminate whether Rockhopper 2’s higher specificity on bacterial data and lower specificity on archaeal data, relative to the other two assemblers, is a broad trend resulting from biases toward certain domains or if it is an artifact of a small sample size. In terms of sensitivity, Rockhopper 2 demonstrated the highest sensitivity of the three assem-blers across the 12 data sets, with its assembled transcripts covering a significantly larger percentage of reference genes than those of the other two assemblers (Figure 3B). Contiguity reflects the percentage of reference genes cov-ered by a single longest transcript and is a useful measure for distinguishing whether an assembly contains tran-scripts covering a gene with multiple short trantran-scripts or a single long transcript. Rockhopper 2’s assemblies demon-strate greater contiguity than those of the other two as-semblers for 11 of the 12 data sets, with Trinity’s assembly demonstrating the greatest contiguity for the S. pyogenes
data set (Figure 3C). RMBT indicates the percentage of sequencing reads that align to assembled transcripts; this measure is often used to evaluate assemblers under the
assumption that higher RMBT corresponds to a greater percentage of reads used in constructing an assembly, which is desirable in that it is more likely to lead to a ro-bust assembly than using a smaller percentage of reads when generating an assembly. Trinity and Rockhopper 2 consistently had high RMBT, in contrast to SOAPde-novo2, suggesting that these two assemblers generally use the majority of sequencing reads to construct their assemblies (Figure 3D). Finally, the execution time of the assemblers was assessed. Both SOAPdenovo2 and Rockhopper 2 demonstrated substantially greater efficiency than Trinity across the 12 data sets (Figure 3E).
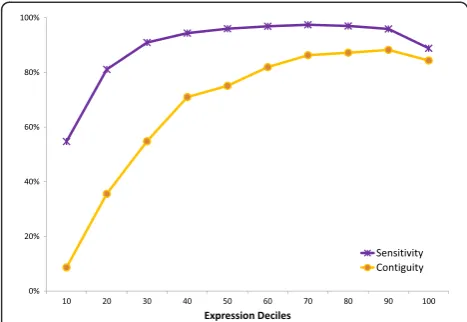
In order to investigate how Rockhopper 2’s assemblies are affected by expression level, we evaluated Rockhopper 2’s sensitivity and contiguity across the 12 RNA-seq data sets at different expression deciles (Figure 4). Each point represents an average across the 12 data sets (Figure 4). For example, the leftmost point corresponds to the aver-age sensitivity (purple) or contiguity (yellow) of Rockhopper 2’s assemblies across the 12 data sets for the 10% least highly expressed reference genes. The rightmost point corresponds to the average sensitivity (purple) or con-tiguity (yellow) of Rockhopper 2’s assemblies across the 12 data sets for the 10% most highly expressed reference genes. For this analysis, rather than requiring assembled transcripts to align exactly to reference genes, we used a more permissive alignment criterion and allowed assem-bled transcripts to align to reference genes with a small number of gaps or mismatches (BLAST E-value <0.01). Unsurprisingly, Rockhopper 2 is better able, in terms of sensitivity and contiguity, to assemble transcripts with higher expression than lower expression, as performance generally improves as the expression decile increases (Figure 4). However, there is a small decrease in perform-ance at the very highest expression deciles (Figure 4). This asymmetric rainbow-shaped curve is consistent with what others have observed [27], namely that assembly perform-ance generally improves rapidly from the lowest expres-sion quantiles to mid-level expresexpres-sion quantiles, plateaus across mid-level expression quantiles to higher-level ex-pression quantiles, and decreases slightly at the highest level expression quantiles. These results provide one indi-cation as to how confident a user can be in Rockhopper 2’s assembled transcripts for transcripts expressed at dif-ferent levels.
reflects the amount of RAM consumed during an assem-bly. A comparison of memory usage by SOAPdenovo2 and Trinity has been performed by others [27] and we did not repeat the analysis here. With default parameters, Rockhopper 2 uses at most 1.2 GB (gigabytes) of memory. For the assemblies in this study, we allowed Rockhopper 2 to use up to 2.0 GB of memory, an amount generally avail-able on any common laptop. In contrast, the authors of the Trinity assembler recommend approximately 1 GB of memory per million paired reads for Trinity [25]. The RNA-seq data sets used in this study contained between 2 million and 195 million reads, with an average of 36 mil-lion reads. Thus, Trinity’s memory consumption typically requires high-performance computing hardware whereas Rockhopper 2 has no such requirement. All three assem-blers are fully parallelizable and their runtime performance scales inversely with the number of processors available for computation in the machine on which the assembler is executed.
Conclusions
Transcriptome assembly is a common step in the analysis of RNA-seq data. When a sequenced genome is available, assembly approaches can leverage the reference genome by aligning sequencing reads to the genome. When a high-quality reference genome is not available, transcrip-tomes must be assembledde novo. While a number of ma-ture tools exist for de novo assembly of transcriptomes from RNA-seq data, these tools were designed primarily for eukaryotic data and their performance suffers when applied to bacterial data. In this study, we propose novel al-gorithms forde novo assembly of bacterial transcriptomes.
The algorithms have been implemented in an open-source software system called Rockhopper 2.
We evaluated Rockhopper 2 using one set of DNA-seq data and 12 sets of RNA-seq data corresponding to a range of microorganisms. We found that Rockhopper 2 produced high quality transcriptome assemblies and outperformed other leading assemblers. Rockhopper 2 has several other advantageous features, including a graphical interface and the ability to run on common laptops rather than necessi-tating a high-performance computing environment. In addition tode novotranscriptome assembly, the Rockhopper 2 system integrates algorithms for normalization of data across experiments, quantification of transcript abundance, and testing for differential gene expression. Thus, Rockhopper 2 reduces the initial stages of ana-lysis of large bacterial RNA-seq data sets to a matter of minutes, enabling investigators to spend more time on downstream interpretation of results and extraction of new biological insights.
Additional file
Additional file 1:For the DNA-seq data set and the 12 RNA-seq data sets used in this study, the table provides details on the performance statistics for each of three assemblers when generating assemblies from each data set.
Abbreviations
bp:base pair; PCR: polymerase chain reaction; RAM: random-access memory; RMBT: reads mapping back to transcripts; RPKM: reads per kilobase per million; SRA: Sequence Read Archive.
Competing interests
The author declares that he has no competing interests.
Author’s contributions
BT designed the algorithms, implemented the software, and wrote the manuscript.
Acknowledgements
This work was supported by the National Institutes of Health grant R15 GM102755 to BT. The author would like to thank Cari Vanderpool and Alisa King for genomic DNA sample preparation and sequencing. The author would also like to thank members of the Rockhopper and Rockhopper 2 user community for their valuable feedback on the software systems.
Received: 20 August 2014 Accepted: 15 December 2014
References
1. Wang Z, Gerstein M, Snyder M. RNA-Seq: a revolutionary tool for transcriptomes. Nat Rev Genet. 2009;10:57–63.
2. Garber M, Grabherr MG, Guttman M, Trapnell C. Computational methods for transcriptome annotation and quantification using RNA-seq. Nat Methods. 2011;8:469–77.
3. Flicek P, Birney E. Sense from sequence reads: methods for alignment and assembly. Nat Methods. 2009;6:S6–12.
4. Martin JA, Wang Z. Next-generation transcriptome assembly. Nat Rev Genet. 2011;12:671–82.
[image:9.595.56.290.89.250.2]5. Trapnell C, Williams BA, Pertea G, Mortazavi A, Kwan G, van Baren MJ, et al. Transcript assembly and quantification by RNA-Seq reveals unannotated transcripts and isoform switching during cell differentiation. Nat Biotechnol. 2010;28:511–5.
6. Guttman M, Garber M, Levin JZ, Donaghey J, Robinson J, Adiconis X, et al. Ab initio reconstruction of cell type-specific transcriptomes in mouse reveals the conserved multi-exonic structure of lincRNAs. Nat Biotechnol. 2010;28:503–10.
7. Mortazavi A, Williams BA, McCue K, Schaeffer L, Wold B. Mapping and quantifying mammalian transcriptomes by RNA-Seq. Nat Methods. 2008;5:621–8.
8. Grabherr MG, Haas BJ, Yassour M, Levin JZ, Thompson DA, Amit I, et al. Full-length transcriptome assembly from RNA-Seq data without a reference genome. Nat Biotechnol. 2011;29:644–52.
9. Birol I, Jackman SD, Nielsen CB, Qian JQ, Varhol R, Stazyk G, et al. De novo transcriptome assembly with ABySS. Bioinformatics. 2009;25:2872–7. 10. Li R, Zhu H, Ruan J, Qian W, Fang X, Shi Z, et al. De novo assembly of
human genomes with massively parallel short read sequencing. Genome Res. 2010;20:265–72.
11. Schulz MH, Zerbino DR, Vingron M, Birney E. Oases: robust de novo RNA-seq assembly across the dynamic range of expression levels. Bioinformatics. 2012;28:1086–92.
12. McClure R, Balasubramanian D, Sun Y, Bobrovskyy M, Sumby P, Genco CA, et al. Computational analysis of bacterial RNA-Seq data. Nucleic Acids Res. 2013;41:e140.
13. Rockhopper. http://cs.wellesley.edu/~btjaden/Rockhopper. 14. Rockhopper at GitHub. https://github.com/btjaden/Rockhopper. 15. Li H, Handsaker B, Wysoker A, Fennell T, Ruan J, Homer N, et al. The
sequence alignment/map format and SAMtools. Bioinformatics. 2009;25:2078–9.
16. de Bruijn NG, Erdos P. A combinatorial problem. Koninklijke Nederlandse Akademie v Wetenschappen. 1946;49:758–64.
17. Compeau PE, Pevzner PA, Tesler G. How to apply de Bruijn graphs to genome assembly. Nat Biotechnol. 2011;29:987–91.
18. Burrows M, Wheeler DJ. A block sorting lossless data compression algorithm. In: Technical report 124. Palo Alto, CA: Digital Equipment Corporation; 1994.
19. Ferragina P, Manzini G. Opportunistic data structures with applications. In: Proceedings of the 41st Annual Symposium on Foundations of Computer Science. 2000. p. 390–8.
20. Bullard JH, Purdom E, Hansen KD, Dudoit S. Evaluation of statistical methods for normalization and differential expression in mRNA-Seq experiments. BMC Bioinformatics. 2010;11:94.
21. Anders S, Huber W. Differential expression analysis for sequence count data. Genome Biol. 2010;11:R106.
22. Benjamini Y, Hochberg Y. Controlling the false discovery rate: a practical and powerful approach to multiple testing. J R Stat Soc. 1995;57:289–300. 23. Kodama Y, Shumway M, Leinonen R. The sequence read archive: explosive
growth of sequencing data. Nucleic Acids Res. 2012;40:D54–6. 24. Rhind N, Chen Z, Yassour M, Thompson DA, Haas BJ, Habib N, et al.
Comparative functional genomics of the fission yeasts. Science. 2011;332:930–6.
25. Haas BJ, Papanicolaou A, Yassour M, Grabherr M, Blood PD, Bowden J, et al. De novo transcript sequence reconstruction from RNA-seq using the Trinity platform for reference generation and analysis. Nat Protoc. 2013;8:1494–512. http://sourceforge.net/projects/trinityrnaseq/files/misc/TrinityNatureProtocol Tutorial.tgz/download.
26. Luo R, Liu B, Xie Y, Li Z, Huang W, Yuan J, et al. SOAPdenovo2: an empirically improved memory-efficient short-read de novo assembler. Gigascience. 2012;1:18.
27. Zhao Q-Y, Wang Y, Kong Y-M, Luo D, Li X, Hao P. Optimizing de novo transcriptome assembly from short-read RNA-Seq data: a comparative
study. BMC Bioinformatics. 2011;12:S2. Submit your next manuscript to BioMed Central
and take full advantage of:
• Convenient online submission
• Thorough peer review
• No space constraints or color figure charges
• Immediate publication on acceptance
• Inclusion in PubMed, CAS, Scopus and Google Scholar
• Research which is freely available for redistribution