Impact of Resident’s Characteristics on Domestic
Electricity Utilization Pattern: A Study on City of
Agra
Vivek Birla1
1Assistant Professor, Amity University Gurgaon - Haryana
Abstract: The paper study the impact of the houses and their resident’s characteristics on domestic electricity utilization pattern by analysis of the data acquired from metering survey of the representative cross section of apprx 3600 domestic residents of city of Taj - Agra, UP India. A multiple linear regression model was applied to three attributes : total electricity consumption, maximum demand and time of use (ToU) for various different residences and their occupants. In particular, residence type, type of construction, location, social class, income group, household age, household composition, and various other parameters have major impact on the overall total household electricity consumption. The paper shows the relation of various attribute on the various parameters.
Keywords: Domestic Power Consumption, Residents – occupant characteristics, domestic Energy usage pattern, building and design operations, appliances power performances, behavior modeling, electricity use
I. INTRODUCTION
In electrical engineering, power consumption often refers to the electrical energy over time supplied to operate an electrical appliance. The energy used by equipment is always more than the energy really needed. Energy efficiency is an essential aspect in the design and operation of residential buildings. Residential energy consumption has been shown to account for approximately 8% of the electricity in the India.
A. Indian Electricity Consumption
In an indication of growing appetite for electricity in India, the country’s per capita electricity consumption has reached 1010 kilowatt-hour (kWh) in 2014-15, compared with 957 kWh in 2013-14 and 914.41 kWh in 2012-13, according to the Central Electricity Authority (CEA), India’s apex power sector planning body. “Per capita electricity consumption crossing 1,000 units a year is certainly a milestone, but without much significance. One-fourth of the households in the country still have no access to electricity, with some states in East and North East having less than even 30% households with (electricity) access. Most significant milestone that the nation must achieve is 100% households having 24x7 quality supply of electricity”.
India’s per capita power consumption is among the lowest in the world. Around 280 million people in the country do not have access to electricity. In comparison, China has a per capita consumption of 4,000kWh, with developed nations averaging around 15,000kWh per capita. Interestingly, while the peak shortage in the country was at 2.3% in May, many believe that the demand still looks artificially suppressed as state electricity boards (SEBs) are not buying power. SEBs have been unwilling to procure electricity because of their weak financials due to low tariffs, slow progress in reducing losses, higher power purchase costs and crippling debt. India has an installed power generation capacity of 272,503MW.
B. Residential Sector in India
Residential building sector has great potential for energy efficiency by adopting energy efficiency measures to reduce the total energy requirement of the building to fulfill the needs of energy for various purposes: lighting, heating and cooling and food. Adoption of Energy efficiency measures not only reduces the overall energy consumption of building but also reduces the exhaustion of nonrenewable energy resources.
giving equal amount of light output of 2000 to 2500 lumens. Adoption of energy efficiency measures and energy efficient behavior can considerably reduce the energy demand in residential buildings.
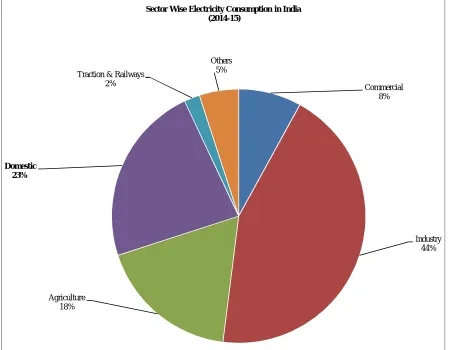
Fig. 1: Sector wise electricity consumption in India (2014-15) Source: Energy Statistics 2016
The above data shows that maximum % amount of electricity consumption is for the industry sector accounting to 44% of the demand and second more demanding area is domestic or household sector which accounts for the 23% of the electricity power consumption. The lowest is for the railways alone which makes 2% of the electricity demand of the nation.
Continuous research and development is very helpful in overcoming the problems: degradation of environment and exhaustion of nonrenewable energy sources.
II. ENERGY CONSUMPTIONS DATA
The Energy Statistics 2013 of India’s National Statistical Organisation (NSO) illustrate electricity report for more than 57 percent of the whole energy consumption during 2011-12 in India, and building sector is already consuming close to 40 per cent of the electricity. An increase to 76 per cent by 2040 is expected. A bulky quantity of incremental electricity demand will come from the residential sector in India.
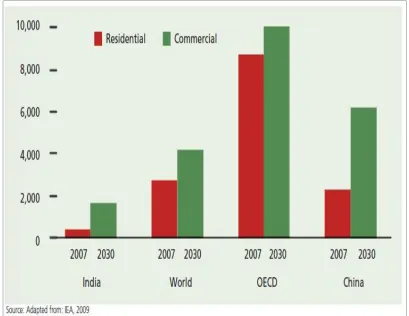
International Energy Outlook 2013 shows that India’s residential energy consumption trend resembles that of China at 3.7 percent per year, and India’s commercial sector energy consumption growth is projected to increase at an average rate of 5.4 per cent per year, which is also the world’s highest (see Graph: Projection of energy for buildings by region 2003-30). Compared to the industrialised world, India’s energy consumption in households is much lower and penny-pinching. This, however, will change dramatically in India with the transformation in lifestyles, incomes and growing electrification. The future growth, especially in commercial and retail sectors, will see greater absorption of mechanised heating and cooling that will push up overall energy consumption and costs significantly.
Commercial 8%
Industry 44%
Agriculture 18% Domestic
23%
Traction & Railways 2%
Others 5%
Figure 2 : Annual per capita Electricity Consumption
Oil is the world’s leading fuel and accounts for 32.9% of energy consumption globally, according to BP statistical review 2016. Total world consumption of marketed energy expands from 549 quadrillion British thermal units (Btu) in 2012 to 629 quadrillion Btu in 2020 and to 815 quadrillion Btu in 2040—a 48% increase from 2012 to 2040 (IEO 2016).
In India, the estimated electricity consumption increased from 411887 to 948328 GWH from 2005-06 to 2014-15 and have shown an increase of 8.48% (IEO 2016). Fig. 2 shows the sector wise consumption of electricity in India (2014-15). Total energy consumption is estimated to be 22465 Peta Joules during 2014-15 by energy statistics 2016.
[image:4.612.92.501.425.610.2]Fig. 4:Source wise percentage consumption of energy (2014-15) Source: Energy Statistics 2016
The energy source data shows that 3% for the consumption is meet by the electricity sector as it as source of energy and maximum of the demand is meet by the crude and petroleum as source of energy comprising of 42%.
III. LITERATURE SURVEY
There are different ways to do the modeling and mapping for resident’s characteristics on domestic electricity utilization pattern by analysis of the data acquired from metering survey of the representative. The data is analysed with each of their individual strength and weakness. The data has been sort out for the Statistical Regression methodology applied.
Statistical regression models are specifically used when a very big data set or information is available. Here the data is real time data and recorded through individual survey method and collections of records from meter etc which gives the better knowledge for the electricity consumption. The liner model to interpret the affiliation between the appliance used and electricity consumption by the individual user. The study shows the exploratory variables that have comparative more impact on the electricity consumption such as residents characteristics, location value, residents types. Apart from this occupant details such as – income, age, period of stay, social class, time of stay type, disposable income, household size i.e number of persons staying in the residence, residence age, etc will be variables that will impact the usage of electricity consumption
Residence and individual resident characteristics used in the analysis were based on the ranking system as obtained from various study. The various parameters’ used for the study are as :-
Residence Type Resident Income
Number of Appliance used Number of persons staying Location
Household composition Appliance rating Residents Age Floor Area Time of usage
Usage patterns on weekends Temperatures
Residence age Number of Rooms
42% 47% 8%
3%
Crude Petroleum Coal & Lignite Natural Gas Electricity
Job / Business type Disposable income Social Group No of bed rooms Education level Residence surface area Period of residence Property value Electricity Price No. of days of extreme temperature
IV. AIM / OBJECTIVES OF STUDY
The aim of this research is to study the energy consumption patterns of residential buildings in Agra region of Uttar Pradesh. The Objectives of the research to accomplish this aim are as following:
A. To study the variation of energy consumption between different slabs of variables.
B. To find out most influencing variables those are affecting the energy consumption.
C. Measuring the relationship between variables that influence most energy consumption
V. METHODOLOGY
Energy consumption pattern of residential buildings in NCR was studied. A questionnaire survey was designed to understand and record the energy usage of individual household unit with the penetration of electrical appliances in the building and to analyze the energy consumption trend with different independent variables. A sample of 3600 residential buildings was selected on random basis and door to door survey of the buildings was done.
A. Descriptive analyses of variables to study the energy consumption variation of households within different income and
household size.
B. Regression Analyses to know the variation of energy consumption with different slabs of independent variables.
C. To study the energy consumption behavior of households.
The data set used in the study was divided into six groups based on total annual household electricity consumption to ensure an even spread of electricity consuming customers. The original sample of 3600 residents were across all segments were reduced to 3150 residents by targeting certain groups to improve the symbolize of residence and social economical variables or attributes. The concluding sample of 2740 was used in the analysis.
Eight months data between the September 2016 to April 2017 was used to measure data from digital meters installed by the power distribution agency – Torrent Power Limited (Agra). Non Continuous data were removed for the better results. The paper more study the residents electricity consumptions hence the time period used is both extreme summers and extreme winters with moderate time also. Thus true parameters will be obtained.
Mathematical Equation : The electrical parameters are shown in mentioned equations which describe the electricity consumption pattern over the period of 8 months –
ETotal = ½ ∑ Ei
where ETotal is total amount of electricity consumed over 8 months in kWh and Ei is electrical demand in kW in each half hour period.
Multiple linear regressions is used to model the variation in electrical parameter.
a) Physical Structure and Characteristics of Building: includes the physical information of buildings: age of building, no. of floors, floor area, orientation of building, insulation material, building attachment etc. which gives the clear picture of the structural aspect that could lead to consumption of energy and can be reduced.
b) Appliances Used in Buildings: includes the information on the electrical appliances used in the building unit and usage hours of the appliances which clearly shows the usage of electricity by the appliances and corresponding increase or decrease in energy consumption of that building unit.
c) Behavior and Culture of Households: contains the behavior and culture survey of households, to know how people think on energy conservation and how much they are willing to adopt energy efficiency measures.
2) Phase 2: Collection of Data from Survey
a) The survey was done for the single family houses with household size ranging 1 to 6.
b) Household income was divided in four income slabs: 0 to 2.5, 2.5 to 5, 5 to 10 and >10 (in Lakhs).
c) Similarly the floor area was also divided in four parts: 0 to 140, 140 to 270, 270 to 450 and >450 m2.
d) Household size was divided in three ranges: >4, 4 and ≤ 3.
e) Dwelling type was divided in two parts: Fully attached and other.
f) The division of income, floor area, household size and dwelling type was done to know the energy consumption in households
of different income slab, floor area, household size and Building attachment.
g) Percentage penetration of appliances and usage hours was recorded for different income slabs.
h) Only fully attached buildings were considered and corresponding energy consumption of buildings was analyzed and rest of the
dwelling types are considered in one range.
i) The linear regression analyses of 3600 household’s was carried out in MS Excel 2013, in this analyses energy consumption of
households was regressed with independent variables: income and floor area of households. 3) Phase 3: Data Analyses:Statistics Used for the analysis are as following
a) Mean: Mean is the average of the values of a dataset. It can be calculated by adding all the values in the dataset and divide the sum with the no. of values.
b) Median: It is the middle number in a sequence of numbers in a dataset. Means and medians are tracked to spot the trends. It gives the average of two middle numbers.
c) Range: Range is the difference between the highest and the lowest values in a dataset.
d) Coefficient of Variation: Coefficient of variation shows the dispersion of the data points around the mean of a dataset. It
represents the ratio of the standard deviation to the mean. It is very useful for the comparison of degree of variation from one dataset to another.
e) Standard deviation: Standard deviationshows the measure of how are the values within the dataset is spread out. It is square root of the variance.
f) Linear regression analysis : and descriptive statistical analysis of variables in all 3600 households was carried out in Microsoft excel 2013 to know the energy consumption patterns in residential buildings.
Regression analyses of energy consumption of households and independent variables: income of households and floor area was done. Further the regression between income and floor area of households was done to know the relationship between the variables. Descriptive statistical analysis were done for all the variables divided under different Income slabs to know the average energy consumption and energy consumption trend of households in different income slabs of households.
Results were compared with penetration of appliances in different slabs to study the energy consumption and effect of appliances on energy consumption. Energy consumption variation under different slabs of income was recorded and change of energy consumption between different income households was calculated.
Percentage penetration of electrical appliances and usage hours of appliances under the different income slabs was recorded to study the effect of appliances on energy consumption between varying incomes of households. To study the energy saving behavior of households, descriptive analysis of penetration of energy efficient appliances and energy efficiency measures adopted in 3600 households was carried out.
VI. RESULT AND ANALYSIS
parameter.
A. The linear regression was done for the analysis. The various result obtained are listed as below - 1) The study based on individual staying or household characteristics
a) Applying the regression model on the sample size of 3600 samples data sets and on 5 variables – Number of people staying
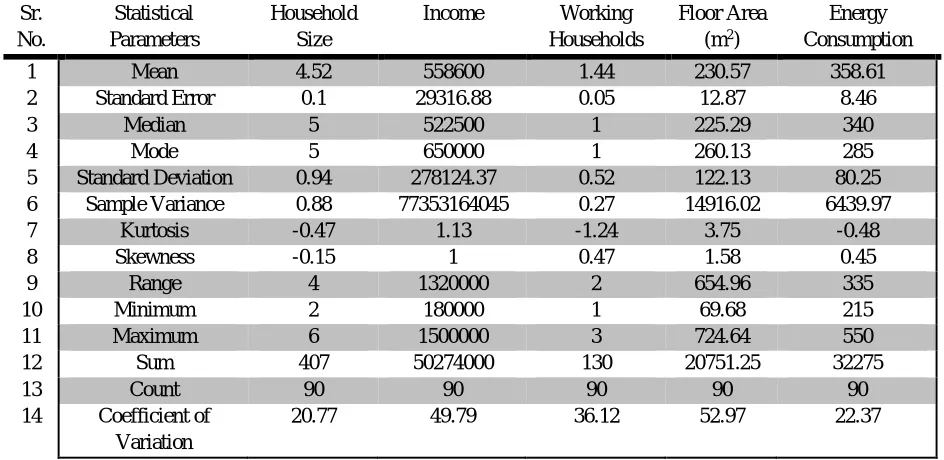
in house ie Household size, Income, Weorking professional in house, Floor area of the house and total average energy consumption. The following statistical information is obtained as below which includes details of Mean, std error, median, mode, and other parameters.
Sr. No. Statistical Parameters Household Size
Income Working
Households
Floor Area
(m2)
Energy Consumption
1 Mean 4.52 558600 1.44 230.57 358.61
2 Standard Error 0.1 29316.88 0.05 12.87 8.46
3 Median 5 522500 1 225.29 340
4 Mode 5 650000 1 260.13 285
5 Standard Deviation 0.94 278124.37 0.52 122.13 80.25
6 Sample Variance 0.88 77353164045 0.27 14916.02 6439.97
7 Kurtosis -0.47 1.13 -1.24 3.75 -0.48
8 Skewness -0.15 1 0.47 1.58 0.45
9 Range 4 1320000 2 654.96 335
10 Minimum 2 180000 1 69.68 215
11 Maximum 6 1500000 3 724.64 550
12 Sum 407 50274000 130 20751.25 32275
13 Count 90 90 90 90 90
14 Coefficient of
Variation
[image:8.612.71.543.195.425.2]20.77 49.79 36.12 52.97 22.37
Table 1: Results of descriptive analysis of data for all the households
b) The relationship between the electricity consumption for the individual household based on their income growth is studied
and the results are shown below in the plot. The graph shows that as the income is increasing the life style is changing and more the utility of power and electricity. The graph also shows the predictive electricity consumption. The straight linear relationship.
Figure 5: Relation between Electricity Consumption and Income slabs
0 100 200 300 400 500 600 700
0 500000 1000000 1500000 2000000
E le ct ri ct y Co n u m p ti o n i n k W h
Income in Lakhs
Electricity Consumption
Predicted Electricity Consumption
Linear (Electricity Consumption)
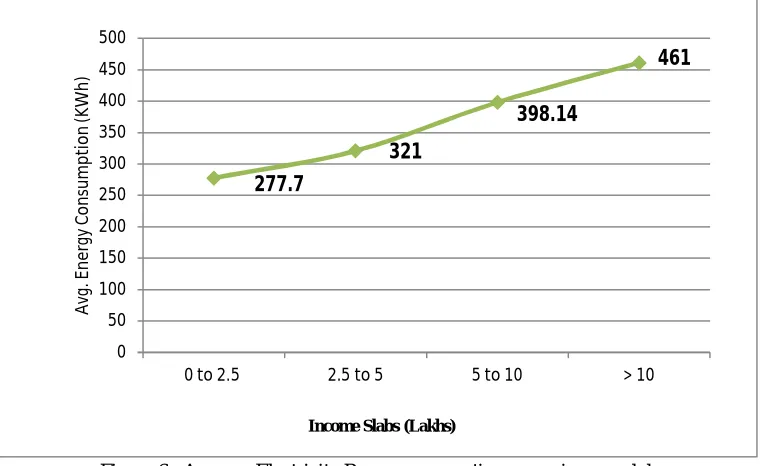
[image:8.612.102.511.504.704.2]The second graph below shows the average needs of the electricity for the various individual households as per their income slabs. The graph shows that as the income is raised by the four times from 2.5 lakhs to 10 lakhs or more the demand is proportionally not increased with same pace. Demand is increased by almost 1.7 times only. Thus this matter of relief but the story is not same for all segments’. There are few households which have even more requirement.
Figure 6 : Average Electricity Power consumption as per income slab
The third graph discusses the details of % change in the energy consumption with respect to change in the income slab. The base to measure the change is taken 0-2.5 Lacs slab. It is seen that as the income is increasing the amount of the requirement of the electricity is also changing hence the percentage is shown as below in graph.
Figure 7: Percentage variation in energy consumption wrt base variable income slab
c) The relationship between the electricity consumption for the individual household based on their house floor area in m2 is
studied and the results are shown below in the plot. The graph shows that as the floor area is increasing the house consumption per room is also increasing. The energy /power is required for each part of the house and hence the graph also shows the predictive electricity consumption. The straight linear relationship.
277.7 321 398.14 461 0 50 100 150 200 250 300 350 400 450 500
0 to 2.5 2.5 to 5 5 to 10 > 10
Av g. E n e rg y C on su m p ti on (K W h )
Income Slabs (Lakhs)
0 15.59 27.79 66.01 0 10 20 30 40 50 60 70
0 to 2.5 2.5 to 5 5 to 10 >10
% E n er gy C o n su m p ti o n V ar iat io n
Income Slabs (Lakh)
[image:9.612.101.515.434.615.2]Figure 8 : : Relation between Electricity Consumption and Floor Area
d) The relationship between the electricity consumption for the individual household based on their house floor area in m2 and
the income slab is also is studied and the results are shown below in the plot. The graph shows that as the floor area is increasing and also the income, the house consumption is also increasing. The energy /power is required for each part of the house and hence the graph also shows the predictive electricity consumption. The straight linear relationship.
Figure 9 : Electricity consumption for Average Floor Area wrt to Income slab
e) The relationship between the Building attachments i.e either it is open or closed or it has ventilation or not, or the
surrounding areas makes an important role to play with the power consumption. It is find that building with the fully attached or closed environments needs more power in their daily needs as compared to the building with the open non fully attached environment. lower power electricity consumption for the individual household based on their house floor
area in m2 and the income slab is also is studied and the results are shown below in the plot. The graph shows that as the
floor area is increasing and also the income, the house consumption is also increasing. The energy /power is required for each part of the house and hence the graph also shows the predictive electricity consumption. The straight linear
0 100 200 300 400 500 600 700
0 200 400 600 800
En
e
rg
y
C
on
su
m
p
ti
on
Floor Area (m2)
Energy Consumption
Predicted Energy Consumption
Linear (Energy Consumption)
Linear (Predicted Energy Consumption)
111.51
201.59 257.31
520.25
0 100 200 300 400 500 600
0 to 2.5 2.5 to 5 5 to 10 > 10
F
lo
o
r
A
re
a
[image:10.612.101.486.394.596.2]relationship.
Figure 10: Power Needs wrt to Building Environment
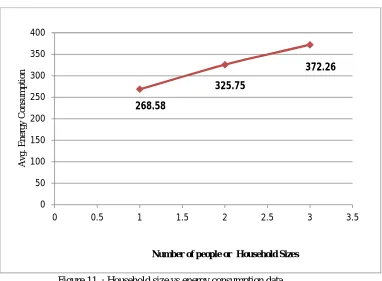
f) The relationship between the electricity consumption for the individual household based on their number of persons staying
in the house is studied and the results are shown below in the plot. The graph shows that as number of households are increasing and the house consumption is also increasing. The energy /power is required by each individual in the house and hence the graph also shows the predictive electricity consumption. The straight linear relationship.
Figure 11 : Household size vs energy consumption data
The graph discusses the details of % change in the energy consumption with respect to change in the household size. The details shows the rise in the electricity consumption when households are till 4 but then the comparative dip in the electricity consumption as household size increases.
369.38 349.16 335 340 345 350 355 360 365 370 375
Fully Attached Other
Av g. E n e rg y C on su m p ti on (K W h )
Building Environment or Attachment
268.58 325.75 372.26 0 50 100 150 200 250 300 350 400
0 0.5 1 1.5 2 2.5 3 3.5
A v g . E ne rg y C o ns um pt io n
[image:11.612.136.518.386.667.2]Figure 11 : Percentage change in electricity wrt to household
B: The study based on Analysis of Appliances Data
1) Appliances having penetration between 0 to100 % penetration: Penetration or % of frequency distribution among the sample size of 3600 samples is done for different appliances has been shown below in table. The appliance having penetration between 0 to100 % penetration were analyzed as they are contributing in all the buildings or households. The result is shown in below given table 2. The results in % shows % households which have these equipments and are dependent on these on their day to day needs.
2) Appliances having penetration either 0% or100 % : The study was made for the various appliances that contribute for the 100% penetration or 0% penetration and the five appliance were obtained based on the location needs. These appliance were in all the houses and hence need not to be indivually studied.
.
0
21.29
14.27
0 5 10 15 20 25
≤3 4 > 4
%
V
a
ri
at
io
n
Household Size
Percentage Variation of Energy Consumption in Different Household Sizes
Sr. No. Appliances % Penetration
1 Microwave Oven 24.44
2 Vacuum Cleaner 18.89
3 Computers / Laptops 62.22
4 AC 42.22
5 Smart phones 70.21
6 Electric Motor 56.33
7 Washing Machine 46.67
8 Water Purifier 42.22
9 Electrical Modular Kitchen 11.23
10 LCD / LEDs 78%
[image:12.612.138.475.357.530.2]11 Geyser 33.2%
Table 2: Details of Appliance penetrations between 0 to 100%
Sr. No. Appliances with either 100% or 0% penentration
1 Cooler
2 Lighting
3 Refrigerator
4 Television
[image:12.612.152.460.587.673.2]5 Ceiling Fan
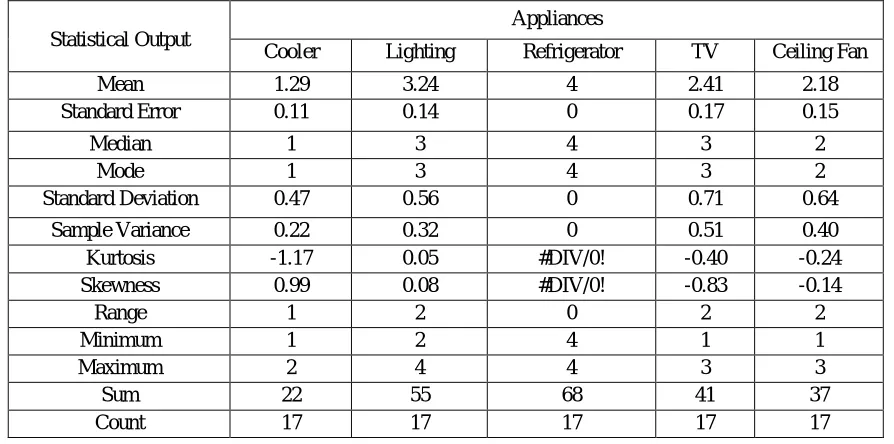
The study was made using the regression analysis and statistical data was obtained for them. The details of following statistical information is obtained as below which includes details of Mean, std error, median, mode, and other parameters
Table 6 : Average Use of Appliance in hourly basis
3) The study of the 100% penetration appliances were made with respect to Income slabs and they average day hourly usage
was obtained for them. It shows that for the refrigerators, there is full 24 hours usage and the for the various other appliances the usage vary based on the income slabs.
Income Slab (Lakh)
Average Usage Hours of All Five Appliances
Cooler Lighting Refrigerator TV Ceiling Fan
0 to 2.5 2.29 6.24 24 2.41 17.18
2.5 to 5 2.81 6.44 24 3.4 17.04
5 to 10 3.4 6.7 24 3.28 17.58
>10 3.67 6.83 24 2.66 16.83
VII. CONCLUSION
The result obtained are showing the relation between the resident socio economic variable and residence and electrical parameter for total electricity consumption. The study shows that more number of bedrooms have direct impact on the electricity consumption. Then with the increase in the income, the floor area increases and also the residents consumes more power. The study tell that for the fully attached closed environment building there is more consumption of the power then for the open building. This is because they need the more power to maintain their internal temperature with the external temperature. Then study also shows that that more the number of individuals staying in the building, more will be power consumption as this will make the more utilization of the electricity for various reasons and this will add into their demand.
The deep analysis for the appliances were made for the various residents. The study was divided into two category in which one segment discuss the parameters which have direct impact for the study and they are not having either 100% or 0% frequency distribution and other parameter is for the study of appliances which have either 100% or 0% impact.
The result shows that smart phones have maximum penetrations for the household with 70.21% , followed by computers or laptops which makes 62.22% (this is because of the various UP government and local administration schemes which helps even people in low income group to avail the benefits), then LCD / LEDs TVs make the 68% penetrations. The electrical motor for the water needs also plays an important role with 56% penetration. The lowest among were vacuum cleaner 18.89 % and electrical modular kitchen
Statistical Output
Appliances
Cooler Lighting Refrigerator TV Ceiling Fan
Mean 1.29 3.24 4 2.41 2.18
Standard Error 0.11 0.14 0 0.17 0.15
Median 1 3 4 3 2
Mode 1 3 4 3 2
Standard Deviation 0.47 0.56 0 0.71 0.64
Sample Variance 0.22 0.32 0 0.51 0.40
Kurtosis -1.17 0.05 #DIV/0! -0.40 -0.24
Skewness 0.99 0.08 #DIV/0! -0.83 -0.14
Range 1 2 0 2 2
Minimum 1 2 4 1 1
Maximum 2 4 4 3 3
Sum 22 55 68 41 37
[image:13.612.83.530.129.351.2]Count 17 17 17 17 17
making 11.23%
The study for the other segment having 100% penetration, shows that for the hours utilizations part, appliance 1 – cooler is having maximum utilization for the 2.67 hours daily while for the Lighting, there is marginal change in the usage irrespective of the income slabs and same is with the refrigerators. For the TV, their maximum average usage is for the people with income slab 5-10 Lacs while for the people with > 10Lcs income use less electricity for the TV. Similarly for the utlisation for the Fan, the usage is marginal same for all the income slabs
The overall study shows the 66% rise in the usage for the power when compared base income slab to highest income slab and the electricity utlisation is max for the households with four occupants. But it decreases later as number of occupants increases. The reason is more number of households occupy common rooms and use same power for the various reasons.
Thus overall the electricity consumption is directly influenced by the various social – economical parameters which make the residents to use or consume the power into various reasons. This suggest the potential for the introduction of the time of use tariff along with the income slab based smart metering.
REFERENCES
[1] H.B. Gunay, W. O’Brien, I. Beausoleil-Morrison: A critical review of observation studies, modeling, and simulation of adaptive occupant behaviors in offices. Build Environ 2013, 70: 31–47.This paper provides a review of occupant behaviors in offices.
[2] T.S. Blight, D.A. Coley: Sensitivity analysis of the effect of occupantbehavior on the energy consumption of passive house dwellings. Energy Build 2013, 66:183–192.This study reveals that passive design is less sensitive to behavior than initially anticipated.
[3] Fintan Mcloughlin, Aidan Duffy, Michael Conlon, Charchtersting domestics electricity consumption patterns by dwelling and occupant socio- economic variables: An irish study, Energy Buliding(2012)Elsevier
[4] J.K. Day, D.E. Gunderson: Understanding high performance buildings: thelink between occupant knowledge of passive design systems, corresponding behaviors, occupant comfort and environmentalsatisfaction. Build Environ 2015, 84:114–124.This study investigates connections between building occupant behavior, environ-mental gratification, and the knowledge needed for high performance buildings.
[5] B.K. Sovacool: What are we doing here? Analyzing fifteen years of energyscholarship and proposing a social science research agenda. Energy Res SocSci (2014), 1:1–29.This paper emphasizes the need for integrating social science methods and tech-niques into energy related research.
[6] B.K. Sovacool, S.E. Ryan, P.C. Stern, K. Janda, G. Rochlin, D. Spreng, M.J.Pasqualetti, H. Wilhite, L. Lutzenhiser: Integrating social science in energy research. Energy Res Soc Sci 2015, 6:95–99.This paper provides a perspective of the energy studies field from a social science vantage and provides recommendations for better interdisciplinary work with engi-neering and sciences
[7] J. Langevin, J. Wen, P.L. Gurian: Including occupants in building performances imulation: integration of an agent-based occupant behavior algorithm with Energy Plus, in: 2014 ASHRAE/IBPSA-USA Building Simulation Conference,September 10–12, 2014, Atlanta, Georgia, 2014.[7] D. Parker, E. Mills, L. Rainer, N. Bourassa, G. Homan: Accuracy of the home energy saver energy calculation methodology, in: ACEEE Summer Study on Energy Efficiency in Buildings. 2012, (12–206 to 12–222).
[8] X. Feng, D. Yan, T. Hong: Simulation of occupancy in buildings. Energy Build2015, 87:348–359.Occupancy patterns in buildings are determined.[16] C. Duarte, K. Van Den Wymelenberg, C. Rieger: Revealing occupancy patterns in an office building through the use of occupancy sensor data. Energy Build 2013, 67:587–595.Sensor data is used to formulate new occupancy patterns.
[9] S. D’Oca, T. Hong: Occupancy schedules learning process through a data mining framework. Energy Build 2015, 88:395–408.Four different twenty-four hour occupancy schedules were determined using data mining.
[10] D. Aerts, J. Minnen, I. Glorieux, I. Wouters, F. Descamps: A method for the identification and modelling of realistic domestic occupancy sequences for building energy demand simulations and peer comparison. Build Environ 2014, 75:67–78.This paper presents a three-state occupancy model which can discriminate between individuals being absent, at home, awake or asleep
[11] T. Ryan, J.S. Vipperman: Incorporation of scheduling and adaptive historical data in the Sensor-Utility-Network method for occupancy estimation. Energy Build 2013, 61:88–92.This paper focuses on two enhancements to the sensor-utility-network method.
[12] V. Motuziene, T. Vilutiene: Modelling the effect of the domestic occupancy profiles on predicted energy demand of the energy efficient house. Procedia Eng 2013, 57:798–807.This study presents simulation results of the effect of different occupancy profileson the energy performance in Lithuania homes, assessing the influence of behavioron the energy demand for heating, lighting and ventilation
[13] F. Oldewurtel, D. Sturzenegger, M. Morari: Importance of occupancy information for building climate control. Appl Energy 2013, 101:521–532.The study focuses on Swiss office buildings which have advanced control systemsand highlights the significance of occupancy information.
[14] C.M. Stoppel, F. Leite: Integrating probabilistic methods for describing occupant presence with building energy simulation models. Energy Build2014, 68:99– 107.This paper focuses on underutilized aspects, such as vacancy, with findings suggesting that the incorporation of occupant behavior-related aspects could improve modeling efforts
[15] K. Anderson, K. Song, S.H. Lee, H. Lee, M. Park: Energy consumption in households while unoccupied: evidence from dormitories. Energy Build2015, 87:335–341.This is one of the first papers to investigate energy use in households without occu-pants
[16] ANSI/ASHRAE, ANSI/ASHRAE Standard 55: Thermal Environmental Conditions for Human Occupancy, ANSI/ASHRAE, 2004.