.A. STUDY OF THE VIBRATIONAL CHARACTERISTICS OF TWO MULTISTORY BUILDINGS
Thesis by
Douglas Allen Foutch
In Partial Fulfillment of the Requirements for the Degree of
Doctor of Philosophy
California Institute of Technology Pasadena, California
1977
ACKNOWLEDGMENTS
The author wishes to express his gratitude to his advisor~ Professor P. C. Jennings, for his guidance and for his helpful suggestions provided throughout this investigation. The assistance provided by Professor G. W. Housner in obtaining permission for the tests of the Ralph M. Parsons Company ·world Headquarters building, and by Professor C. D. Babcock in providing suggestions regarding instrumentation is greatly appreciated.
The fira nci::l.l support prO"'Tided by tbe California Institute of Technology in the form of teaching and research assistantships is appreciated. The partial support of this investigation by a grant from the National Science Foundation is acknowledged.
The author expresses1 his thanks to the Ralph M. Parsons Company for granting permission to test their World Headquarters building.
The assistance provided by Mr. Raul Relles in maintaining the instrTu."nentation system and in conducting the tests is greatly appre-ciated. Gratitude is also extended to Mr. Albert Ting and l'v1r. Marty Cohen who provided assistance in conducting the tests and reducing data. The help of Mr. Donald Laird and the Mechanical Engineering Shop is also acknowledged.
Sincere thanks are given to Mrs. Henriette \Vymar for her skillful typing of the manuscript.
iii
ABSTRACT
Forced vibration tests and associated analysis of two multistory buildings are described. In one case, the dynamic properties of the building measured during the tests are compared to those predicted by simple analytical models. A three-dimensional finite element model of the second building was constructed for the purpose of evaluating the accuracy of this type of analysis for predicting the observed dynamic properties of the structure.
Forced vibration tests were performed on Millikan Library, a nine-story reinforced concrete shear wall building. Measurements of three-dimensional motions of approximately 50 points on each of six floors (including the basement) were taken for excitation in the N-S and E-W directions. The results revealed a complex interaction betvveen lateral and vertical load carrying systems in both directions.. '"I11e results also suggest that a significant change in the foundation response of the structure occurred in the stiffer N-S direction during the San Fernando earthquake. This phenomenon was investigated through the use of two analytical models of the building which included the effects of soil-structure interaction.
v
TABLE OF CONTENTS
Part Title Page
Acknowledgments ii
Abstract iv
Chapter I Introduction 1
Chapter II Instrumentation and Data Reduction 8 Procedures for Full-Scale Tests of
Multistory Buildings
2.1
Motion Sensing Transducers 82.2 Signal Conditioning and Recordin.g 10
2.3 Force Generating Systems 13
Chapter III Three-Dimensional Deformation of 20 a Nine-Story Reinforced Concrete
Building During Forced Excitation
3.1
Description of the Building and 20 Experimental Procedures3.2 Presentation and Discussion of 23 Results
3.3 Conclusions 35
Chapter IV The Use of Simple Models as an Aid 37 to Interpreting Experimental Results
4.1 An Euler Beam Model of the Millikan 38 Library Building
4.2 A Lumped Parameter Model of the
44
M illi."kan Library Building4.3 An Additional Investigation of the 56 Observed 01anges in the Dynamic
Characteristics of the Millikan Library Building
vii
Part Title Page
Chapter V Forced Vibration Tests of the 61
Ralph M. Parsons Company World Headquarters Building
5.1 Description of the Building 61
5.2 Preliminary Tests 69
5.3 Natural Frequencies, Mode 78
Shapes and Damping
5.4 Three-Dimensional Motion of 93
Three Floors and the Surrounding Ground
5.5 Measurement of Strain in the 119
Moment Resisting Frame
5.6 Investigation of Apparent 125
Nonlinearities in the IY;namic
Response of the Parson...;; Building
5.7 A Study of the Response of the 136
Parsons Building to Ambient Excitation
5.8 Conclusions 147
Chapter VI Dynamic Characteristics of the 151
Parsons Building Predicted by a Finite Element Model
6.1 Description of the Model 151
6.2 Computed Natural Frequencies 158
and Mode Shapes for the Model of the Parsons Building
6.3 Comparison of Measured and 169
Computed Responses
6.4 Conclusions 174
Chapter VII Summary and Conclusions 176
Part
Appendix A
Title
Enlarged Figures Showing Floor Deformations Measured During Forced Vibration Tests
of Millikan Library
Page
1
CHAPTER I Introduction
The analysis of stress and deformation in structures such as buildings, bridges and dams is often accomplished by constructing and analyzing a mathematical model of the structure. These models are based on the behavior of individual members such as beams, columns, plates and walls and on the assumed combined behavior of these ele-ments as a structural system. Consequently, the reliability of these analyses :·is· largely dependent on the engineer's ability to model complex structural systems. To improve this reliability, engineers have performed numerous experiments to determine the elastic and
post-yield behavior of individual elements as well as a more limited number of tests on full-scale structures. As a result, much is known about the static and dynamic behavior of structural components; but the knowledge of the behavior of complete structures is in a less : advanced state.
In the past 15 years the tools for modeling and analys:is that are available to the structural engineer have increased rapidly. This is due to the expanding technology of digital computers, coupled with the
Although extensive experimental programs have been performed to determine the behavior of structural components, only a small
number of studies have been undertaken to test the assumptions
regarding the behavior and interaction of these components when they are combined to form a structural system. Several studies of the dynamic behavior of planar models of structural systems have been completed using shake tables in recent years. Since these tests are performed in a laboratory, a high degree of control is maintained over the loadings applied to these models and a large munber of detailed measurements may be taken. Much of our knowledge of the dynamic post-yield behavior of structures is the direct result of these tests. While these tests have provided valuable information, they are limited by the size and composition of test specimens that can be accommodated. The test structures do not contain the so-called nonstructural members which may play a significant role in the overall behavior of a real
structure; they do not possess the three-dimensional dynamic charac-teristics of a real structure, which may be critical for understanding its behavior during dynamic excitations; nor do they rest on a deform-able foundation which may also influence the behavior of the system. These properties may only be studied through field. tests of full-scale structures.
The need for full-scale testing has long been recognized and vibration studies have been performed on multistory buildings in the
3
waves to induce motion in multistory buildings. This method of testing
has also been used in recent years, 17 ' 5
o,
64 , 67 as well, because it iseasily implemented and because the development of the fast Fourier
transform greatly facilitated the analyses of the recorded motions.
The scope of these tests is limited, however, since the investigator
has no control of the magnitude, duration, or frequency content of the
exciting forces.
In the mid-1930's, forced vibration generators were developed
to give investigators more control over the forces applied to the
struc-ture being tested. 3' 4 , 6 These generators provided for the first
detailed studies of the dynamic properties such as natural-frequencies,
mode shapes and damping. However, due to the lack of a good speed
control system for the shakers, results of some of these earlier
studies were misleading.
The development of a vibration generation system with adequate
speed control was undertaken in the early 1960's. Since its
develop-ment, most investigators have studied in detail the· dynamic
character-istics of such structures as dams, 37' 57 nuclear reactors30, 45 , 47' 58
and multistory buildings. 7, l 3, l 4 , 34 , 49 , 53 , 54 , 59 As would be
expected, many of these experiments were performed in conjunction
with analytical studies of the structures being tested.
Even though these tests were performed with the idea of verifying
mathematical models of the structures, many of the investigations were
limited in scope because of the simplicity of the analytical models that
it is common practice to use planar idealizations of the structure to
analyze its response to dynamic excitations. Consequently, many of
the previous tests of multistory buildings investigated only the
uni-lateral mode shapes and associated frequencies of vibration. Whereas
this particular assumption is satisfactory for a limited number of
buildings, it certainly is not realistic for many others.
To advance the state of the art in this field, an extensive series
of forced vibration tests of two multistory buildings has been conducted
by this investigator over the past three years. One purpose of these
studies was to broaden the scope of the full-scale forced vibration
tests. This goal was accomplished through the development of new
experimental procedures and through the improved deployment and
orientation of the motion-sensing transducers. Also, the use of an
improved instrumentation system was an integral part of the testing
program. Results of these studies revealed that much niore information
may be obtained about the three-dimensional dynamic behavior of
multi-story buildings than has been sought in previous tests.
Another purpose of this study was to investigate some of the
common assumptions concerning the dynamic behavior of buildings
made in their analysis for design. Of particular interest to this
investi-gator was the phenomenon of torsional.motions in buildings. The
sig-nificance of these torsional motions is that larger than expected
stresses may be induced in the structural elements at the periphery
of the building. Torsional response is usually considered only in an
5
nominally symmetric structure, for example, only planar analytical
models are derived for the building and torsional response is
approxi-mated by applying a static force eccentrically to the structural frame .
Torsional motions may be induced in such a structure, however, by
purely unilateral excitations. This occurs because of modal coupling
and modal interference.
Modal coupling occurs in a single mode when the centers of mass
and centers of rigidity of the floors of a building do not coincide. Thus,
when inertial loads are applied through the centers of mass, a torque
results about the center of rigidity. Thus a mode which is primarily
translational can include significant rotational motions as well. iv'Iodal
interference involves the interaction of two modes whose frequencies
of vibration are close together. If a torsional mode has a component
of motion in the direction of a translational mode which is being excited,
the torsional mode will also be excited if their frequencies lie close
together. Also, if a torque is produced by the vibration of the
trans-lational mode, the torsional mode wHl .. be excited. Consequently,
modal interference can occur in symmetrical, as well as
nonsymmetri-cal, structures. These phenomena have been previously studied both
experimentauy34 and analytically. 25' 64
A final goal of this investigation was to establish a procedure
whereby the reliability of current modeling practices to predict
stresses in structural members for a given excitation could be evalu
-ated. This involved the measurement of strain in a column of a
the reliability of finite element models of structures based on recorded
ground motion and on the resulting response of these structures during
earthquakes. 56 These studies provided some valuable lessons to
designers; 19 but, since they were based only on recorded accelerations,
knowledge of the actual stresses in the members was lacking. The
knowledge of the member strains for a given configuration of floor
displacements is essential if the accuracy of finite element models is to
be studied thoroughly.
To summarize, the aims of this investigation were to expand the
state-of-the-art of forced vibration testing of full-scale structures, to
investigate the adequacy of the assumptions concerning the overall
dynamic behavior of multistory buildings which are commonly employed
in their analysis for design, and to attempt to assess the reliability of
estimates of stresses in structural members predicted by finite element
models of the structure.
A brief summary of, the contents of each chapter follows:
A description of the instrumentation used for forced vibration
tests of structures is presented in Chapter II. This improved
instru-mentation system greatly facilitated the accomplishment of the detailed
measurements taken during these tests.
The results of forced vibration tests of Millikan Library, a
nine-story reinforced concrete structure,are presented in Chapter III.
Measurements of the three-dimensional deformations of the floor slabs
of the building (including the basement) provided insight into the
7
the significance of soil deformations on the dynamic response of this structure.
A surpriSing result of the Millikan Library test was the apparent change that occurred in the foundation compliance of the
structure as a result of the San Fernando earthquake·~ In Chapter IV,
an Euler beam model with translational and rotational springs at the base is used as an aid to interpreting these results. A simple lumped mass model which accounted for the shear deformations in the struc-ture is also employed in this investigation. Also presented is an analytical procedure emphasizing simplified ideas in mechanics and
minimal computational effort which may be employed in· the analysis
of some multistory buildings.
In Chapter V, results of forced vibration tests of the Parsons building, a twelve-story steel frame building, are presented. Dynamic properties of the building that were studied in detail include natural frequencies, three-dimensional mode shapes and damping; modal coupling and modal inteference; apparent nonlinearities associated with increasing levels of response; and strain levels in a column of the structure during forced excitations.
In Chapter VI, a finite element model of the Parsons building is presented and discussed. The analysis is accomplished using SAP IV, a general purpose finite element code used by many engineers. The
dynamic properties measured for the building are compared to those
CHAPTER II
Instrumentation and Data Reduction Procedures
For Full-Scale Tests of Multistory Buildings
A description of the instrumentation and data reduction
proce-dures used during the full-scale tests of the Millikan Library building
and the Parsons building is presented in this chapter. The
instrumen-tation and data reduction procedures were s:imilar for both tests with
only minor differences which will be pointeci. out in the text.
_2. 1 Motion Sensing Transducers
The majority of the measurements taken during the tests utilized
up to twelve Model SS-1 Ranger seismometers made by Kinemetrics
of San Gabriel, California, as the motion sensing transducers. The
Ranger is a spring-mass system in which a permanent magnet is the
seismic mass. The magnet travels within a coil attached to the frame
of the seismometer. The changing magnetic flux caused by the motion
of the magnet induces a voltage in the coil proportional to the velocity
of the mass. The instrument has a nominal natural period of one
second. A potentiometer in parallel with the coil provides adjustable
damping ranging from nearly zero percent to above critical for the
seismometer. The damping was set above critical for all of the
forced vibration tests to avoid overdriving the amplifiers.
Due to the difficulty of making absolute calibrations of the
g
relative motion and phase between points. Two 0. 25 g Statham
accelerometers with a Brush model 13 4212 02 carrier preamplifier
were used to measure absolute motions. The natural frequency of
this transducer is about 400 Hz and the damping about 0. 7 of critical.
Absolute calibration of an accelerometer is easily accomplished by
tilting it a known angle in the earth's gravitational field. 38
The vast majority of the measurements taken during forced
vibration tests are used to determine the relative motion between two
points. The Ranger seismometers were chosen as the principal
transducers for these tests because their high output and their high
signal-to-noise ratio facilitates the accurate measurement of both
amplitudes and relative phases. Errors of most measurements made
with the Rangers are within 3 percent to 6 percent; whereas the error
of similar measurements made with a Statham can approach 10 percent
or higher.
One difficulty is encountered with the use of the Rangers,
however, that is not a problem with the Stathams. Since the natural
periods of the Rangers are in the range of measured frequencies and
since the natural period and damping is different for each instrument,
the transfer functions of the instruments are not identical.
Conse-quently, relative calibrations must be performed at all of the
frequen-cies of interest. To accomplish this the instruments are aligned side
by side in the same direction, the building is excited at a known
frequency, and then the outputs of all of the Rangers are measured.
particular frequency may be determined. Figure 2.1 shows a typical
calibration set-up.
2. 2 Signal Conditioning and Recording
The signal conditioning system which is used with the Ranger
seismometers serves several purposes. A model SC-201 A signal
conditioner- made by Earth Sciences Division of Teledyne was used
during the tests of Millikan Library. This provides amplification of
approximately 350, 000 as well as independent integration and
differen-tiation of up to four input signals. Consequently, output
sjgnalspropor-tional to displacement and acceleration. are· available. This is a useful feature when taking ambient measurements. The displacement
circuit may be used to study the fundamental mode since this signal
will accentuate the lower frequencies of the motion. The velocity or
acceleration circuits may be used to measure the motion due to higher
modes since these will enhance the higher frequencies and dilninish
the lower frequencies.
Two four-channel Kinemetrics model SC-1 signal conditioners
were used during the tests of the Parsons building. These are similar
to the Teledyne model but have a .gain of 100, 000. They also provide
optional low-pass filters which are continuously adjustable between
1 and 100 Hz. This feature is useful during ambient studies where it
can be used to diminish the presence of high-frequency noise in the
signal. The SC-201 A signal conditioner is shown in Figure 2. 2 and
11
[image:19.618.145.492.146.632.2]Figure
2.
2
SC-201
A
Signal
conditioner
used
during
Millikan
Library
13
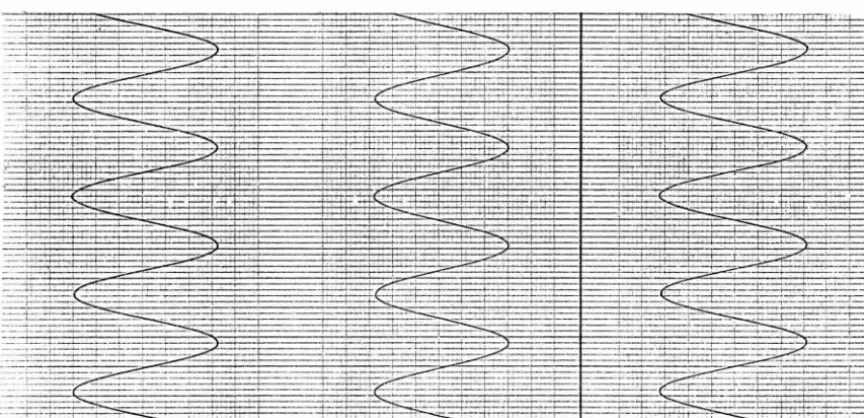
During the Millikan tests, signals from the Rangers were recorded on two Brush Mark 220 two-channel strip chart recorders. The measurements taken during the Parsons tests were recorded on an eight-channel Hewlett-Packard Model 7418A thermal tip recorder equipped with seven 8802 A DC preamplifiers and one 8805 A carrier preamplifier. The latter item was installed for use with a Statham accelerometer. The Hewlett-Packard system was found to be the superior of the two because it provided a cleaner, more readable
,tr.ace~ and, allowed twice as many simultaneous recordings.
For each measurement, the sensitivities of the recorders were adjusted so that the amplitude of the trace was as large as possible.
The resulting double amplitudes may be read to within~ of a division.
Sample traces from the Hewlett-Packard recorder are shown in Figure 2. 3.
During low-level ambient tests, signals from the Ranger seis-mometers were recorded on two four-channel Hewlett-Packard 3960 instrumentation tape recorders. These tapes were then taken to the lab where the recorded analog signals were digitized using a Kine-metrics model DDS-101 analog-to-digital converter. Details
con-cerning sampling rate and filtering will be discussed in a later chapter.
2. 3 Force Generating Systems
:' i: :::1: :
-"
,,.I,
·- ~
- :::+±+:LS:;...._..,
--~A=!==+=~.
~~ ·
-~ :.~~ -' _,,
:
--=$.
-~~:=t=··· I
!- +- .
- _ _ L _ __ _ . _
---:·~:
=--..J...-...-f :---.: .. ~.:--·-r--:::::t::=+=- :- -: ·---~
:c::;i- ·'--~.::::,_
-- -- t ·~
. --1----1.
-~--=--'~ r.:.._ ~
- ·
[image:22.620.109.541.224.433.2]15
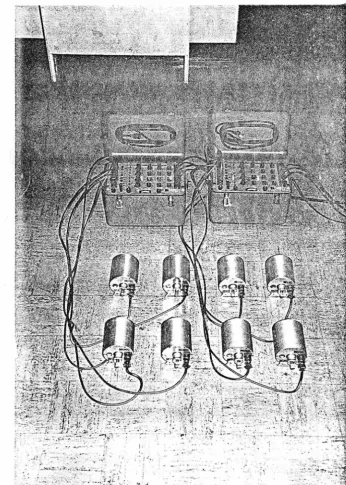
counter-rotating baskets which may be loaded with a variable number
of lead weights. The resulting sinusoidal force may be aligned in
any fixed direction. This was the first design that incorporated an
accurate speed control system. The rotational speeds are adjustable
to within 0.1 percent. A more detailed description of the system is
given by Hudson. 2 8
A model VG-1 vibrational generation system designed by
Kinemetrics was used for tests of the Parsons building. This system
has two mechanical shakers which are nearly identical, mechanically,
to the ·ones designed at Caltech. The control consoles, however, are
a new design utilizing solid state control circuits. One console is
provided for each shaker. The consoles differ only in that one may be
used as a master unit in a master-slave set-up. In this case the
shakers are run simultaneously at the same frequency. Improved
features of this system include: 1) relative ease of operation in the
master-slave arrangement; 2) continuous adjustment of the relative
phase (accurate to ± 1. 25 degrees) of the forces generated by the two
shakers when they are run simultaneously; 3) a 0°-180° switch for
easy adjustment of the relative phase between the forces when torsional
excitation is required; and 4) digital display of the exciting frequency
accurate to± 0. 001 Hz. Figure 2. 4 shows the front panel of the
master console of the VG-1 system with the mechanical shaker in the
background.
For both vibration generating systems, the force produced is
proportional to the square of the exciting frequency. The maximum
=
-~=
---·
·
-
-~
..
.•
.
.
k
':!I
~~~~·:
Figure
2.
4
Master
control
console
of
VG-1
vibration
generating
.
system
with
shaker
in
the
17
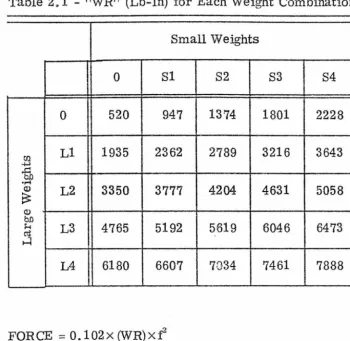
The force generated by each shaker is obtained by the equation
FORCE = 0.102 x (WR) x f2
lbs., (2.1)
where f is the exciting frequency in Hz~ and WR is a constant
depend-ing on the combination of weights in the baskets. Table 2. 1 lists the
values of WR for various combinations of weights and Table 2. 2 gives
the maximum allowable frequency for these weight combinations.
These tables were taken from the instruction manual for the VG-1
system. 39
Slight variations in the procedures and some additional
special-ized instrumentation were required for certain of the Millikan and
Parsons tests. These will be discussed, as they occur, in the
Table 2.1 - "WR" (Lb-In) for Each Weight Combination
Small Weights
0 Sl
0 520 947
tf.l Ll 1935 2362
.;...>
t1
...
(].) L2 3350 3777
~
(].)
b.O
H L3 4765 5192
~
H
L4 6180 6607
FORCE = 0.102x (WR)xf
f =frequency (Hz)
(WR) is in 11Lb-In"
FORCE is in "Lb11
S2
1374
2789
4204
5619
7034
S = small weight (center section) L = large weight (side section)
S3 84
1801 2228
3216 3643
4631 5058
6046 6473
7461 7888
The number (1, 2, 3, or 4) following 11811 or "L11
indicates the number of weights of that size placed
[image:26.629.105.456.133.474.2]19
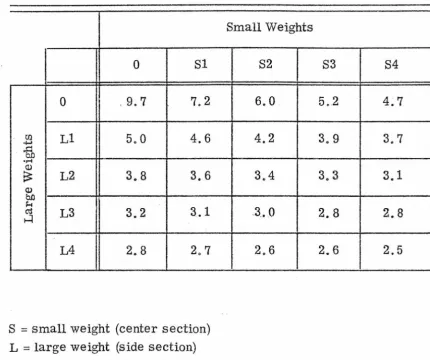
Table 2. 2 - Maxlinum Frequency (Hz) for Each ·weight Combination
0 Sl
0 . 9. 7 7.2
Ul Ll 5.0 4.6
4->
.
in
•r-1
Cl)
~ L2 3.8 3.6
Q.)
bD
~
3.1
cd L3 3.2 ~
L4 2.8 2.7
S
=
small weight (center section) L=
large weight (side section)Small Weights
S2 S3
6.0. 5 .. 2
4.2 3.9
3.4 3.3
.3 .. 0 2. 8
2.6 2.6
The number (1, 2, 3, or 4) following 11811 or "L"
indicates the number of weights of that size placed in each section of that size in each weight bucket.
S4
4.7
3.7
3.1
2.8
[image:27.618.110.540.117.477.2]CHAPTER III
Three-Dimensional Deformations of a Nine-Story Reinforced
Concrete Building During Forced Excitations
Forced vibration tests of the nine-story reinforced concrete
Millikan Library building were conducted between August and
December 1974. The three-dimensional motion of approximately
50 points on each of six floors including the basement and at
approxi-mately 100 points on the ground surrounding the building was measured.
The purpose of the tests was to ascertain the breadth of information
that may be gained about the dynamic behavior of multistory buildings
using forced vibration tests. The tests revealed a substantial amount
of deformation of the floor slabs and interaction between horizontal
and vertical load carrying members. The tests also indicated that the
deformation of the soil had significant influence on the response of the
building in the stiffer N-S direction. Results of these tests were
reported in abbreviated form in reference 4.
3.1 Description of the Building and Experimental Procedures
The Robert A. Millikan Memorial Library is a nine-story
reinforced concrete building located on the campus of the California
Institute of Technology in Pasadena, California. Since its completion
in 1966, the building has experienced three earthquakes (Borrego
Mountain, 1968; Lytle Creek, 1970; and San Fernando, 1971) which
were recorded by strong motion accelerographs located in the
21
construction, several tests and analyses have also been performed on
the building. 14, 32135 , 44 , 54 , 65 The collection of all of these tests and
analyses provides a valuable case study of a multistory building that
has been subjected to dynamic loads of varying types and intensities.
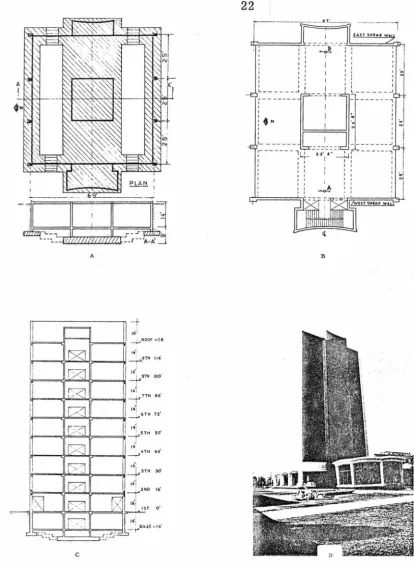
The library building is 69 x 75 feet in plan and stands 144 feet
above grade and 158 feet above the basement level. This includes an
enclosed roof on which elevator and air handling equipment are located.
The majority of the lateral loads in the tran..sverse (N-S) direction are
resisted by 12-inch reinforced concrete walls of the central core
which houses :two elevators and an emergency stairway. The
founda-tion system is composed of a central pad 32 feet wide by 4 feet deep
that extends between the east and west curved shear walls. In addition
to this, continuous foundation beams 10 feet wide by 2 feet deep run
east-west beneath the columns at the north and south ends of the
building. These are connected to the central pad by stepped beams.
Plan and section views of the foundation system are shown in Figure
3. l(a). Plan and section views of the structural system are shown in
Figures 3. l(b) and 3. l(c), respectively. A more detailed description
of the building may be found in reference 44.
One vibration generator was mounted on the roof at point A in
Figure 3 .1 (b). \Vith the baskets of the shaker loaded to capacity, the
building was shaken at resonance in either the N-S or E-W direction.
The maximum force applied in the N-S direction was
approxi-mately 2930 pounds which produced a peak acceleration of about
1.4% g on the roof. In the E-W direction, a maxi..."'11.um response of
A
l
~:
.'..___ _ _ - --_6 !)'._____ _ _ . _ ___;
:
:==~----!:
: : : :
: : I t I: : :
L::.::_::1--r]l:_-:
:
~
J
l _
_
____
===
~
=
=-
1---j
Ni,- - - --- -11 I 2 l' 6" I j - - -- - - -I
: :; I ~: :
: ~ : I : : :
I 1 I I
' '
' '
-1,
'u~
__
:_,,~
;1llfll~
:
.
~
['._'
-"D
u .,_, "'lA
I
~
I
--~==
11;"'""''
1
1
,
I
7""
....
l===~•""==~':r====Oi __f., OTH 100.
I
I, I ,4j: 7TH 86'
,__ _ _,.,...._~.,..,.,,~--w--r
"
f'-==~""=="=t?==='!/ ~ 6 TH 72'
,.-i
iii---..~=="~===';jl __!.,5TH 50'
l
ii---.~...;;.~--~
i
im
••'
r.:-71 '/ ••·
!---~I >_/ ·,;:,;,l!.fr=~-!1-_j, >TH 3d
,,
14:
c
B
Figure 3.1 Millikan Library Building: (a) foundation plan and
N-S section; (b) typical floor plan; (c) a N-S section
[image:30.624.88.503.68.635.2]23
One Ranger seismometer was placed in the bas.ement of the
building at a reference point located at the center of the north face
of the central core wall where it remained throughout all the tests.
This point was chosen to facilitate the matching of the test results
with measurements taken in the basement and on the surrounding
ground by other investigators. 14 Three Rangers were mounted on
an aluminum plate in such a way that three orthogonal components
of motion at a point could be more easily measured. This package
of transducers was then moved from point to point to measure the
three-dimensional motion during steady state response. The
trans-ducer package as: well as the signal conditioner and recorder dis-·
cussed in Chapter, II are shown in Figure 3. 2
3. 2 Presentation and Discussion of Results
During the forced excitation, the building oscillates between
two extreme positions. As the building oscillates, the floor slabs
undergo translational and rotational in-plane motions and various
points on the floor also move vertically due to bending deformations
in the slab. Consequently, at one of the extreme positions of the
building, the displacement of a particular joint on a floor slab may
be composed of three components of motion.
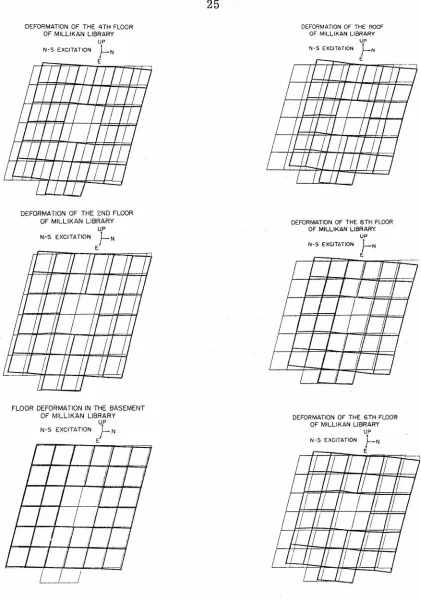
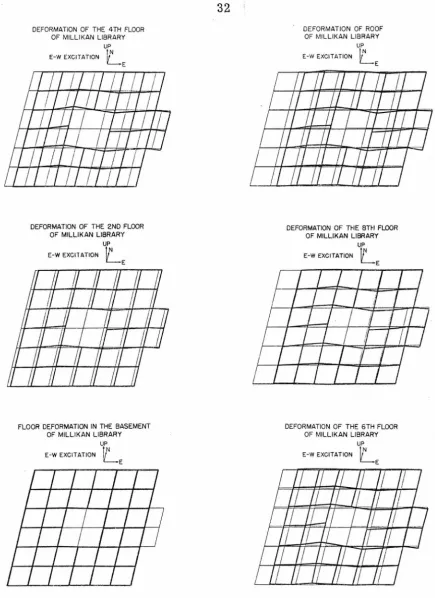
The three-dimensional motions of the basement, second, fourth,
sixth and eights floors and also the roof at one of their maximum
positions are shown in Figure 3. 3 for shaking in the N-S direction
at the reso:nant frequency of 1. 76 Hz. For each of these figures the
Figure
3.
2
Instrumentation
package
and
recorders
used
for
the
Millikan
Library
DEFORMATION OF THE 4TH FLOOR OF MILLIKAN LIBRARY N-5 EXCITATION
DEFORMATION OF THE 2ND FLOOR
OF MILLIKAN LIBRARY
UP
N-5 EXCITATION }-N
E
FLOOR DEFORMATION IN THE BASEMENT OF MILLIKAN LIBRARY
UP
N-5 EXCITATION
}-N
E
25
DEFORMATION OF THE ROOF OF MILLIKAN LIBRARY
DEFORMATION OF THE srn FLOOR OF MILLIKAN LIBRARY
DEFORMATION OF THE 6TH FLOOR OF MILLIKAN LIBRARY
N-5 EXCITATION
[image:33.612.120.541.70.670.2]floor, and the heavy lines connect the points at their maximum
de-formed position. In addition, each displaced point is connected to its
undisplaced position by three light lines representing the three
com-ponents of displacement. Clearly, the displacements are drawn to a
much different scale than the structure. An enlarged view of each of
these figures is shown in Appendix A.
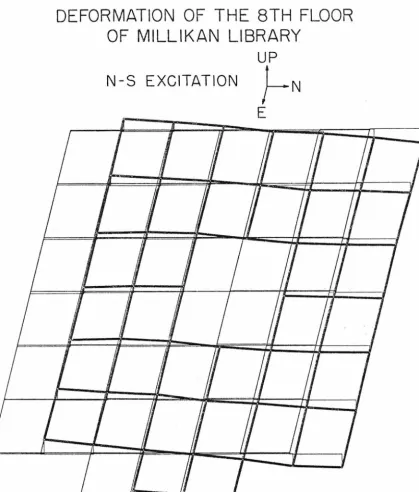
The characteristics of the motion of the structure for shaking
in the N-S direction are dominated by the behavior of the shear walls
at the east and west ends of the building. Figure 3. 4 shows an
enlarged view of the deformations for the eighth floor. Notice that
the edges of the slab at the east and west ends of the building moved
nearly as straight lines as the structure deformed. This indicates
that, although the channel-shaped section joining the two straight
portions of wall (see Figure la) experienced some shearing-type
deformations, the overall behavior of the wall assemblage was more
like that of a single Euler beam than two beams acting independently.
A simple analysis based on the section properties of the shear wall
indicate that approximately 25
%
of the total deformation of the roofwas due to shear deformation. The bending-type behavior was even
more evident for the west shear wall where the stairs acted as a
bracing element resisting shear deformation. This would be an
important consideration for the designer attempting to estimate the
stresses in each wall element.
The bending behavior of the walls produced vertical motion of
the slab which reached a maximum at the ends of the walls. This
27
DEFORMATION OF THE 8TH FLOOR
OF MILLIKAN LIBRARY
UP
N-S EXCITATION
}-N
[image:35.624.127.546.102.594.2]motion of the roof. The columns at the north and south edges of the
slab acted as rigid elements in the vertical direction, thus resisting
the vertical motion of the slab caused by the bending of the walls.
This produced bending in the slab as well as the edge beams
connect-ing the wall to the column. Consequently, if one ignored the
inter-action of the vertical and horizontal load-carrying systems in the
design model, conservative estimates of the stresses in the wall would
result; but nonconservative estimates of the stresses in the column,
in the slab and in the edge beam would arise for this building.
The behavior of a section of the building a.long the west shear
wall is shown in Figure 3. 5. Again, the bending-type behavior of the
wall section is demonstrated. Notice also the amount of deformation
of the soil that takes place at the basement level. The translation of
the base of the building was about 4 percent as large as the horizontal
roof translation, while the maximum vertical motion, which again
occurred at the corners of the shear wall, was twice as great as the
horizontal motion.
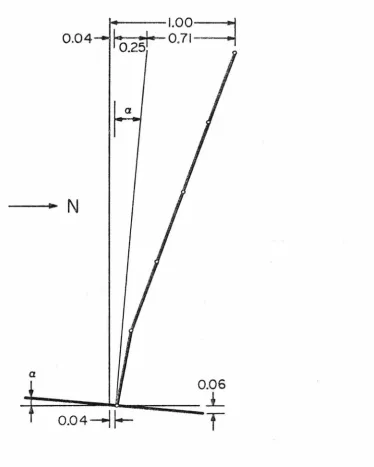
The importance of the foundation deformation during forced
vibration is illustrated in Figure 3. 6. Using the average rotation of
the basement slab, rocking of the structure accounts for 25 percent
of the roof motion. This amount added to the four percent contribution
due to translation indicates that almost 30 percent of the roof motion
is attributable to foundation compliance. This is a surprisingly high
contribution and differs significantly from results reported by
Figure
3.
5
DEFORMATION
OF
SECTION
ALONG
WEST
SHEAR
WALL
OF
MILLIKAN
LIBRARY
N-S
EXCITATION
--N
CONTRIBUTION OF FOUNDATION DEFORMATION
TO ROOF NlOTION FOR N-S SHAKING
1.00~
0.04
ro.z51·
0.71---l_ __.
... N
a
[image:38.617.135.509.185.652.2]31
the soil deformation contributed less than 3 percent to the roof motion.
Possible reasons for this difference are considered in Chapter IV.
The three-dimensional floor deformations for the basement,
the second, fourth, sixth and eighth floors and the roof for shaking
in the E-W direction at the resonant frequency of 1. 21 Hz are shown
in Figure 3. 7;; and Figure 3. 8 is an enlarged view of the deformations
of the eighth floor. The figures indicate that the building behaved
quite differently in the E-W direction when compared to the N-S
response. There was little vertical motion of the slab around the
perimeter of the building, but there was a substantial amount at the
east and west ends of the central core wall. Consequently, there was
considerable deformation in the slabs. This result occurred because
of the different types of load resisting elements in the system. The
central core behaved like a bending beam, while the columns and the
east and west shear walls acted as rigid elements in the vertical
direction. A section through the center of the core wall is shown in
Figure 3. 9. This indicates a behavior similar to that expected for
shear wall-frame interaction. In this case the central core is the
shear wall and the east and west shear walls, acting in their weak
directions, behave as the frame elements.
Figure 3. 9 also indicates that there was only a small amount
of basement translation which measured 2 percent of the horizontal
roof motion. Due to the shear wall-frame pattern of deformation in
the E-W direction, it is difficult to define a meaningful average
rotational component for the base motion. One possible definition
OF MILLIKAN LIBRARY
UP
f.NE
E-W EXCITATION L
DEFORMATION OF THE 2ND FLOOR OF MILLIKAN LIBRARY
UP
E-W EXCl1ATION L E
FLOOR DEFORMATION IN THE BASEMENT OF MILLIKAN LIBRARY
UP
E-W EXCITATION L E
OF MILLIKAN LIBRARY
UP
E-W EXCITATION L E
DEFORMATION OF THE 8TM FLOOR OF MILLIKAN LIBRARY
UP
E-W EXCITATION L E
DEFORMATION OF THE 6TH FLOOR
OF MILLIKAN LIBRARY E-W EXCITATION
[image:40.618.112.547.67.665.2]Figure
3.
8
DEFORMATION
OF
THE
8TH
FLOOR
OF
MILLIKAN
LIBRARY
UP
E-W
EXCITATION
L
E
Fi
g
ure
3
.
9
DEFORMATION
OF
SECTION
THROUGH
CENTERLINE
OF
ELEVATOR
CORE
OF
MILL
I
KAN
LIBRARY
E-W
EXCITATION
35
at the extreme east or west edges of the slab divided by the distance
from :the center of the slab to the extreme edge. For this definition,
the average vertical motion at the edge of the slab is 1. 6 percent as
large as the horizontal roof motion. Thus, rotation of the base would
cause roughly 6 percent of the roof motion. Again, these are larger
values than those reported by Jennings and Kuroiwa, but the
founda-tion mofounda-tions for vibrafounda-tion in the E-W direcfounda-tion will have considerably
less important effects on the dynamic behavior of the building than
those for the N-S direction.
3. 3 Conclusions
The results presented in this chapter give a clear insight into
the nature and degree of the interaction that can occur between the
lateral and vertical load carrying systems of a complicated structure.
This type of detailed information would be very valuable for analytical
studies of the building utilizing sophisticated finite-element models.
Consequently, even though the information obtained is for low levels
of excitation, this study has shown that very useful information may
be obtained concerning the interaction of the various elements of a
complex dynamic system. In fact, forced vibration tests are the
only reliable means of obtaining this type of information for full-scale
structures at the present time.
These tests also revealed that soil-structure interaction has a
significant effect on the dynamic response of the Millikan Library
Effects of this foundation compliance will be considered in more
detail in Chapter IV.
Finally, the results indicated that the dynamic behavior and
distribution of stresses in a real structure may be quite different
than a simple one-dimensional model (a planar model with one degree
of freedom per floor) would predict. In particular, out-of-plane
deformation of floor systems may induce significant stresses in other
members of the structural system even though in-plane deformations
are negligible. In the case of Millikan Library, this effect
signifi-cantly contributed to the interaction of the shear walls and other
37
CHAPTER IV
The Use of Simple Models as an Aid to
Interpreting Experimental Results
In this chapter the results of the tests of Millikan Library are
interpreted through the use of simple analytical models. In the first
analysis, the library structure and foundation system are modeled as
an Euler beam with a translational and a rotational spring at the base.
This model was used to investigate the differences in the fundamental
period of vibration and the mode shape in the N-S direction as measured
before and after the San Fernando earthquake. In the second analysis,
an engineering model of the building in the N-S direction is constructed.
The model is derived from the geometric and material properties of
the building and the supporting soil. The emphasis is on simplified
computations which are easily accomplished in an engineering design
office. The dynamic characteristics are compared to those
demon-strated by the building during forc~d vibration tests and during the San Fernando earthquake. In the third analysis, a lumped-mass model of
the building which includes the effects of shear deformation is
con-structed to investigate the apparent changes in the vibrational
character-istics of the structure that were mentioned above. The results of this
analysis are compared to those based on the Euler beam model; and
conclusions are drawn regarding the dependency of the results on the
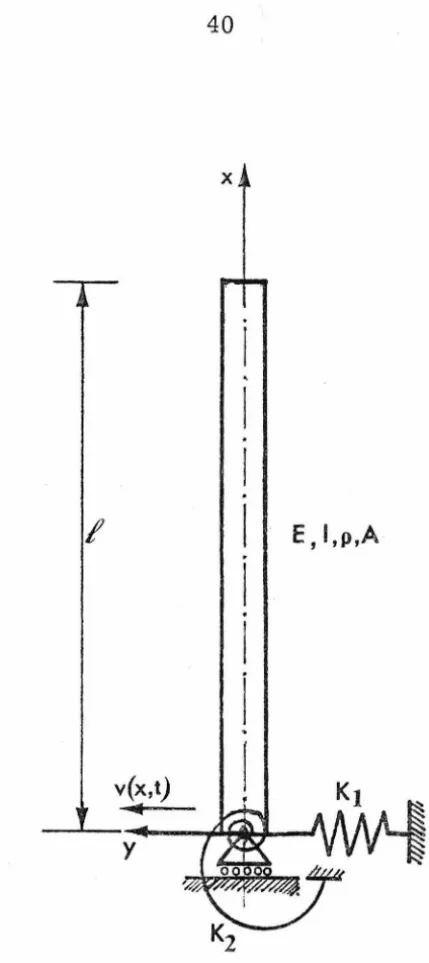
4. 1 An Euler Beam Model of the Millikan Library Building
A surprising result of the Millikan Library tests was the large
amount of soil-structure interaction that was present during vibration
in the N-S direction. The results revealed that approximately 29
per-cent of the roof translation during steady-state vibration was the result
of translation and rocking at the foundation level. The largest
contribu-tor was the rocking mode which caused 25% of the roof translation.
These results differed from those reported by Jennings and Kuroiwa.32
They determined that less than 3 percent of the roof motion was the
result of foundation compliance and that the rocking at the base level
contributed less than 1 percent. Since the original tests were
per-formed before the San Fernando earthquake of 1971 and those reported
in this paper were completed afterwards, and since the acceleration
levels in the building reached 45% g at the top during the earthquake
with 20% g at the base, it was believed that the differences could be
attributed to a change in the foundation resistance that was the result
of the earthquake.
In addition to these observed changes in the foundation motion,
a lengthening of the fundamental period by 11 percent was also observed.
The natural frequency of the first mode in the N-S direction was
deter-mined by Kuroiwa to be 1. 97 Hz and by this investigator to be 1. 76 Hz
for similar exciting forces. (During the earthquake the natural
fre-quency was approximately 1. 6 Hz.) The permanent decrease in the
natural frequency is consistent with possible softening of the foundation
39
observed in the frequency of vibration was consistent with the observed
change in the mode shape. In. particular, it seemed that the natural
frequency might be more sensitive to large changes in the base
rotation-al component of the mode shape than the building demonstrated. This
suggested that larger than expected experimental error could possibly
have occurred during the initial measurements. This could be the
result of the low signal-to-noise ratio that would be expected for the
accelerometers used to measure these extremely low levels of motion
at the foundation level, or of some other difficulty that occurred in the
two sets of expGr~ents. Part of the difference may be explatied by
the fact that the measurements of rocking made by Kuroiwa were made
at the point of minimum vertical motion of the base. The average
rotation of the base as determined by this investigator was about 50
percent greater than the minimum. For purposes of comparison, the
rotational component of Kuroiwa 's mode shape was adjusted accordingly
from that which he reported.
In order to determine if the change in the natural frequency of
vibration was quantitatively consistent with the changes in the mode
shape, two simple models of the building-foundation system were
con-structed. Since the test results indicated that the behavior of the
structure in the N-S direction was dominated by the bending
character-istics of the shear walls at the east and westends of the building, an
Euler cantilever beam was chosen to model the building behavior. A
translational and a rotational spring were included at the base to model
x
I
'
I
I
.
I
E,l,p,AI
.
I
l
.
v(x,t)
I
'
...
y
Figure 4.1 An Euler beam model of the Millikan Library building
[image:48.620.227.442.61.543.2]41
the model. A second model which includes the effects of shear
defor-mations in the structure is presented in section 4. 3.
From
Timoshenko~
2 the differential equation of the vibratingbeam may be written
a
4v(x} 1
a
4 v{x}=
ax4 az at2 (4.1)
where
2 EI EI
a =
-
=
pA µ (4. 2)
In equation (4. 2), E is the modulus of elasticity; I is the moment of
inertia of the beam; p is the density of the material; A is the cross
sectional area of the beam; and µ is the mass per unit length of the
beam. The method used for solving equation (4.1) is separation of
variables which leads to the well known characteristic function
where
X(x)
=
C1 sin(kx) + C2 cos(kx) + C3 sinh(kx) + C4 cosh(kx), (4. 3)w
a (4. 4)
Jn (4. 4), w is the characteristic frequency of vibration in radians
per second.
(4. 5)
- C1 cos(k.Q) + C2 sin(k.Q) + C3 cosh(k.Q) + C4 sinh(k.Q)
=
0In matrix form, these equations may be written
Elk3 -kl -Elk3 -kl
-~ -Elk -~ Elk
det
=
0. (4. 6)-cos (k.Q) sin(k.Q) cosh(k.Q) sinh(k.Q)
-sin(k.Q) -cos (k.Q) sinh(k.Q) cosh(k.Q)
Expanding this equation and substituting a. = k.Q yields the following
frequency equation, in a, for the Euler cantilever beam with a rotational
and a translational spring at the base:
- [cos(a)cosh(a)-l]a + - - [sin(a)cosh(a)-cos(a)sinh(a.)]a.
( EI)
2
4 EI~ 3
12 £3
+
E~k
1 [sin(a) cosh(a)- cos(a) sinh(a)] a+k
1
~
[-1-cos(a) cosh(a)]=
0.(4. 7)
As a simple check on equation (4. 7), one can observe the effect of
letting k1 , the translational spring constant, and k
2, the rotational
spring constant, approach infinity. This should lead to the standard
43
Dividing equation (4. 7) by k1
kz
and letting k1 andIs
approach infinityyields
cos(a) cosh(a) = -1 (4. 8)
which is the expected result.
The first step of this investigation was to construct a model of
the building in the N-S direction that would closely match the dynamic
characteristics measured by Kuroiwa. To obtain a realistic value for
EI, the total weight of the building was assumed to be distributed over
the height of the b'.lilding (142 ft.) Using the resulting valne fr1r
µ ( µg
=
1. 97 x 105 lb/ft.), the frequency equation of the fixed-freecantilever beam was solved for EI, assuming a frequency of vibration
of about 2. 00 Hz. This resulted in an initial estimate of
EI = 3.177 x 10¹³ lb-ft.2 Values of k1 and
kz
were then found so thatthe natural frequency and mode shape of the model would match those
measured for the building before the San Fernando earthquake. A
slight adjustment in the initial estimate of EI was also required.
Starting with this model which represented very closely the
dynamic properties of the structure measured before the earthquake,
EI was held constant and the values of k1 and
kz
were adjusted until themode shape reported in this thesis was obtained. This included an
iterative scheme whereby equation (4. 7) was solved for certain values
of k1 and
kz;
the resulting frequencywas then substituted into equation(4. 3) and the mode shape was computed and normalized to equal 1. Oat
the top (x
=
.Q.); the values of base translation and base rotation weremodified in the appropriate direction. This procedure was continued
until the authorts measured values of base translation and rotation
were closely approximated.
The results of this investigation are shown in Figure 4. 2. The
initial slight adjustment in EI so that Kuroiwa 's results could be
matched resulted in a fixed-base frequency of 2. 02 Hz. The frequency
of vibration that was then obtained after adjusting k1 and
Is
until thepredicted mode shape matched the most recently measured one was
1. 65 Hz. This result is in good agreement with the value of 1. 76 Hz
that was measured by this investigator, considering the simplicity of
the model. The resulting frequencyis about 6 percent lower than the
measured value.
The results of this initial investigation suggest that the observed
change: in the frequency of vibration is consistent with the apparent
change in the mode shape. A more thorough discussion of these results
will be given in section 4. 3 where they are compared to those based on
a model that includes the effects of shear deformation in the building.
4. 2 A Lumped Parameter Model of the Millikan Library Building
Due to economical considerations, a building the size of Millikan
Library would not normally be analyzed for design using a sophisticated
finite element analysis. More likely, the design of the structure to
resist earthquake forces would be accomplished by approximating the
dynamic forces by means of a static analysis using some equivalent
static forces obtained from the Building Code. Another approach which
EI
=
0.32LlOOE lll Kl = 0. lOOOOE 30 K2=
O.lOOOOE30 i--1.000-,
0.000 ____ ...__ ___ --'J.0000
MDDE
1
FREQUENCY
=
2.02
EI=
0 .32ll00E 1 Ll Kl=
O.l!2500E 10 K2=
0.75200Ell!
i---1 . 000-t 0.023 ____________ a .002s
M(jOE
1
FREQUENCY=
1.97
EI=
0.32L!OOE lli Kl = 0.13500E 10 K2=
0.23000E13 t--1
u. m.
J J
h.
J
,
FIXED REFERENCE
SOIL-STRUCTURE INTERACT! ON MODEL
[image:54.614.81.452.58.578.2]47
behavior of a building more realistically would be to construct a simple
lumped-mass model of the building based on the physical properties of
the structural members. The effects of soil-structure interaction may
even be included with little additional effort.
To demonstrate the procedure that could be followed in a
simpli-fied dynamic analysis of a building and to determine how accurate the
results of this approach might be, a lumped-mass model of the Milli"kan Library building in the N-S direction was constructed. The effects of
shear deformation in the walls of the building and the effects of
soil-structure interaction were included in the model.
A schematic of the dynamic model of the building is shown in
Figure 4. 3. The equations of motion for this system may be written
n
j~
mj hj(Uj
+ hj (fj +ug
+ lib) +1t
(fj +Ccpr
2~
+ Kcpr2c/>=
0 ,where,
ug
=
acceleration of the groundub
=
the relative translation between the base of the structureand the fixed reference.
us
=
a vector of horizontal displacements of the floorsu~
=
the horizontal displacement of floor j relative to the base.J
h
=
a vector of floor heights above the base.h.
=
the height of floor j above the base.J
¢
=
the rotation of the base.1t
=
the sum of the centroidal moments of inertia of the floorsand base masses.
K
=
the fixed base stiffness matrix of the model.c<P
=
the foundation rotational damping coefficient.K¢
=
the foundation rotational spring constant.ex
=
the foundation translational damping coefficient.Kx
=
the foundation translational spring constant.M
=
the fixed base mass matrix of the structure.Neglecting the damping terms, this may be written in matrix form
K
* ..
u=
-mu..
- - g (4.10)
49
n
n
K
0 I • • 0
0
n + 1 n + 2
,,.-,,
~m1 h1m1
m2 h2m2
+1t
n+l n+2
~~
0 0
0 0
~
00 r2
kcp
n
J
(4.11)}n+l
} n + 2
n
(4.12)
} n + 1
and,
m=
n
~h.m.
j=l J J
(4. 13)
In these equations ~ is equivalent to the translational spring, kH of
the previous model and r2K¢ is equivalent to the rotational spring,
is.
The numerical values used in these equations for the model of the
library building were derived using the geometric and material
proper-ties of the east shear wall (see Figure 3. 1) and of the foundation
material. The weights of the floors used in the model were as follows:32
roof, 2. 6 x 10⁶ lbs.; floors 9-3, 1. 95 x 106 lbs.; floor 2, 2.433 x 10⁶ lbs.;.
floor 1, 2. 28 x 106 lbs.; and the base weight is approximately
7. 0 x 106 lbs. The moment of inertia of the east shear wall was
com-puted to be 3. 32 x 104
rt!
·
This value was then doubled so that the totalmass of the building could be used. In this way, results could be more
easily compared to those of the previous section. Young's modulus for
4000 psi concrete is approximately1 3. 6 x 10⁶ psi= 5. 18 x 108
lbs./ft~
The resulting value for EI was 3. 44 x 1013 lbs. -ft.2
A common practice of determining the equivalent springs to model
51
of a rigid disk on a half space. Veletsos 66 gives the following equations
for determining the equivalent springs:
where
and
K =
x axK
Kcp = acpK
K = 8 Gr
2 - v
v
=
Poisson's ratior
=
radius of foundation base.(4.14)
(4.15)
(4.16)
The parameters ax and acp depend on the frequency of excitation, the
radius of the base and the shear wave velocity of the foundation material.
For Millikan Library, ax and a cp are approximately equal to 1. 0 and 0. 85
res pee ti vely. The shear modulus of the foundation was estimated from
the approximate shear wave velocity of the soil immediately under the
building by the relation C
8 =
{(]fp ,
where C5 is the shear wavevelocity and p is the mass density of the material. Using the values
1650 ft. /sec. for the shear wave
velocity~
8 110 lbs./ft:
for the weightdensity, and 41 feet for the radius of the equivalent circular base
resulted in the following values for the base springs:
K
=
1. 8 x 10⁹ lb. /ft.x
These values were increased by 22 percent for Kx and by 28 percent
for r2Kcf> to account for imbeddment.43 The final values used in this
analysis were Kx = 2. 2
x
109 lb./ft. and r2Kcf> = 3. 5x
1012ft. -lb./rad ..The dimensions of the east shear wall of Millikan Library
indicate that approximately 20-25 percent of the deflection of the roof
due to lateral loading may be contributed by shear deformations. The
model of the building should reflect this contribution. The plane stress
solution for the displacement of the centerline of a rectangular
canti-lever beam with a concentrated load applied at the end is27
v(x)
=
P(3 .e - x)x2
6EI
Pc2x
+
2GI (4.17)
The first term of this expression represents the part of the total
dis-placement due to bending and the second term represents the
contribu-tion due to shear deformacontribu-tion.
The flexibility matrix was determined for the fixed base model by
applying a unit load independently at each floor level and computing the
resulting floor displacements at each floor level using equation (4.17).
The resulting flexibility matrix was then inverted to obtain the stiffness
matrix, K, of the fixed-base model.
The procedure as discussed so far has been based on simple ideas
in mechanics. The numerical computations required could have been
completed in the design office without the use of a digital computer. In
order to remain consistent with this approach, the natural frequency of
the model was computed using Rayleigh's Quotient which for this system
53
(4. 18)
In equation (4.18), 1.jJ represents the approximate mode shape for the
first mode of the model. 1.jJ was obtained by applying loads at each
floor level which were equal to the weight of the floor and computing the
resulting displacements. Using this procedure, the normalized
com-puted displacements are usually very close to the exact mode shape of
the system. The resulting natural frequencies are expected to be
within 1-2 percent of the exact values. Error in the predicted natural
frequency for the fixed base condition was less than 1 percent.
Using the stiffness and mass matrices of the fixed base model,
eigenvalues were computed which revealed that the first natural
frequency was 1. 89 Hz. When the translation and rotation of the base
are included in the model the natural frequency dropped to 1. 66 Hz.
The fact that this value is smaller than either of the test results may be
potentially due to the added stiffness of the building (contributed by
the core wall and the columns) which was not included in the model.
This was partially offset, however, by the omission of the effect of
holes in the shear wall at the first floor level [see Figure 3. 1 (d)]. The
resulting mode shape is shown in Figure 4.4.
It is interesting to note that the natural frequency of this model is
actually quite close to the one at which the building vibrated during the
San Fernando earthquake. Assuming that the mode shape measured
after the event is representative of the one during the earthquake, the
0.02
I
I
I
1. 66 Hz.
I
I
I
I
I
II
I
I
[image:62.624.109.526.66.613.2]0.05
Figure 4. 4 Mode shape and frequency of the fundamental N-S mode
of the Millikan Library building resulting from a
lumped-mass model of the structures based on physical proper