I
I
I
I
I
I
I
i
I
I
I
MEMORANDUM SERIES 1 16
SOURCE
OF
MATERIALS FOR
UNEMPLOYMENT IN
I
R.C.
I
I
I
I
I
Geary
The Economic and Social Research Institute
4 Burlington Road
Dublin 4
Ireland
Telephone (3.53-I) 667 1525 Fax (353-I) 668 6231
¯ ’, , .
A ~STUDY
IRELAND
I
I
I
I
I
I
I
I
I
I
I
i
I
I
I
I
I
I
I
I
I
Chapter 1
2 I
Ii Ill
I II
I II
5
I I!
6
7 -.
Unemp!c:yment Study
Co nte nts
The Setting of the Problem
Public Policy and Exper;ence in Ireland with Employl;lent Schemes Guidance from Experience
The Existing Situation
Experience wlth Employment Schemes in Other Countries ILO Experience
QECD study of the main tendencies ~n employment and manpower poilcy measures in the current recesslon. Appendix
Two Irlsh Surveys
A Pilot Survey of the Unemployed
Natlonal Manpawer Servlce Surveys Summary Econometrlc Aspects
A Simple Model The COMET ....
I
I
I
I
I
I
I
I
I
i
I
I
I
I
I
I
I
I
i
I
Introduction
This memorandum is mainly a loose collection of papers, in
no particular order, pertaining to the Irish unemployment problem. We are
very conscious that, if it is to be published at all, it will require drastic reduction,
reordering, unification and revision of text. The problem is, however, so
urgent and important that we have decided to inc, lu.de ft in its present imperfect
form in the ESI~I Memorandum Series, for reference by our colleagues who may
be studying the problem, as we hope they are.
Our main thesis, first ad~anced in ESRI Paper No. 52 by Geary
and Hughes in 1970, is that the endemically large Irish unemployment problem
must be tackled directly, i.e. by the creation of jobs the main purpose of which
is not economic but to put the unemployed to work. All due regard will be had,
of course, to social usefulness and efficiency in the selection of tasks to be
tackled, from the vast number’possible. An Auti.ority shouldlbe created for this
purpose, endowed with funds {and discretion as to their deployment) on an immensely
larger scale than in the past. As u~employment is largely caused by an excess
labour pool of unskilled, special attention should be devoted to training and
education. If, in consequence mainly of the recent great increase in the marriage
rate, there are indications of larger numbers annually seeking jobs than can
economically be absorbed at home, regard should be had to the desirability of
emigration; such emigration would be very different from what it was in the past,
in that emig~cants would be properly trained,their interests officially recoguised
and looked ~ter at home and abraod.
These matters are dealt with in Chapters 1 and 7. Ireland’s
past experience with employment schemes, the’fruit of study of two unpublished
government commission reports Whicl~ luckily became available to us) is dealt
with in Chapter 2. Recent experience with employment schemes in some
other countries will be found in "Chapter 3, mainly derived from material kindly
made available bY the ILO and the OECD. The studies reported in Chapters 2
and 3 are perhaps as valuable for indicating what not to do in future schemes
.,,j
as the contrary.
Chapter 4 contains the results of two surveys, one a pilot
conducted by ourselves, mainly dealing with attitudes of the recent unemployed
in Ireland, the other the results of a survey conducted by the National Manpower
I
I
I
I
I
I
I
I
i
I
I
i
I
I
I
I
i
I
I
I
statements of the men interviewed, is that most of them wanted work and were
prepared to work at jobs of lower status than they were accustomed to. This
attitude is contrary to the common belief that recent increases in unemployment
pay have made the recipients work shy on a large scale.
The so-called "simple" model in Chapter 5 is little more than
a chart showing that in the period 1958-73 the incr~sed rate of volume of output
in non-agriculture was accompanied by a vastly greater rate of volume increase
in gross domestic fixed capital formation and a very small rate of increase in
number at work in non-agriculture. This chart is our main reason for our
suggesting that economic development alone, on the scale which we can afford,
will be unlikely to bring about a sizable reduction in the number of unemployed,
though, of course, economic development is good for itse!f~
The main showing of Chapter 5, which we describe as "dismal"
is that of the elaborate COMET model, prepared for EEC countries on data for
approximately the years 1954-71. COMET shows that the Irish rate of unemployment
is expected to increase from 7.2 to 16.5 per cent between 1973 and 1980.
Admittedly the model does not "work" very’well by reference to Irish data in the
computation years of 1958-71. Nevertheless the alarming result is unlikely to
be contradicted by a better-behaved model. COMET, howeTer, does not take the
possibility of emigration into account. This result is the principal reason for our
believing that an~¢hing like full employment at home with the next decade is most
unlil~ely without the safety valve of emigration.
We are indebted to the ILO for making available to us, on a
short mission, the distinguished services of Dr Emile Costa. Dr Costa produced
in general lines what .we regard as an excellent scheme for Ireland which we give
without comment as Chapter 6. It will be seen that Dr Costa’s scheme will cost
something Uke £70 million net a year: "hence our earlier remark in this introduction;
that ex~penditure must be on a far’larger scale than heretofore.
I
I
I
I
I
I
I
I
I
I
I
I
I
I
I
i
I
-3-Chapter 1. The Setting of the Problem
Prefatory
It used to be a clich6 in demography that in most inter-national comparisons Ireland’s situation has been exceptional. One need only cite our low marriage rate, high fertility rate, high emigration rate, resulting in a declining population over the past century and. in the fact that the ratio of number of Irish-born domiciled abroad to the population cf the mother country is one of the highest in the world. Emigration has also been responsible for the low proportion of the population in the active ages 15-64, resulting in a dependency ratio of 73 (1971) compared with 54-59 c(~. 1971).for other EEC countries ~193. It goes without saying that, with a GNP per head about one-half of that of most of our EEC part-ners, a considerable constraint is imposed on the level of social security or indeed any kind of public payments we can afford.
Of greater relevance is the fact that in 1971 Ireland’s per-, centage unemployed was by far the highest in Europeper-, twice as high as the
next in order in EEC ~15,]. At the Census of. Population of April 1971 when the out-of-work numbered 65. 000 the percentagss were as follows:
Unemployed as percentage of, (i) Total employee class ....{ili Total gal nfully occupied
Total Total ¯excl. A FF l
8.1 (7.2)
s.s (4.7)
7.0 (6.3)
6. s (s.4)
The figures fn brackets are those of the previous CP, five years beforei showing that economic.expansion since then has been accompanied by a Small, but sigtlificant, increase in thevnemploymeht rate. Clearly, Ireland
would make a better international showing under concept (ii) which,
however, is open to the objection that it takes no account of Under-employ-ment in the non-employee class, mainly farmers and working members of their families. In.1971 gainfully occupied in AFF in Ireland formed 26 per of total gainfully occupied and in AFF 82 per cent were non-employees.
T
] Excluding agriculture, forestry, fishing.
..:"
!
|,
I
I
I
I
i
I
I
i
i
i ¯_¯¯
I
i
1
I
I
i
I
I
I
--4--There have been remarkhble changes in the last two decades. Pcrhap~ the most heartening is that the marriage rate, prac-tically unchanged at 5½ per 1, 000 for a gcnoration up to and including the year 1965, has moved to nearly 7½, almost a demographic revolu-tion in the few short years since. The net number of emigrants, 43, 000 a year as recently as in the ¯decade 1956-1961, has been reduced to 17, 000 In 1931-1966, further to 12, 000 in 1966-71, and to a net immigrati0n in, 1972-1973. The result has been that, with a sizeable natural increase, the population has begun to rise, slowly but significantly, after practical stagnation during the half-century before. We shall draw inferences from these fundamental changes later which, ff sometimes loss than positive proof, are essential for a hypothetical background to what we conceive to be right thinking on this p+roblem of reducing the human and financial was-rage in carrying perpetually large numbers of unemployed.
Since 1961 (and until very recently) the unemployment rate, at 6-7 per cent, has been at a lower level than previously: from 1947 fo 1961 the seasonally corrected quarterly rates oscillated between 7-10 per cent/:7~. The unprecedentedly large economic advance since 1960 has had little impact on the size of the labour force, almost constant at about 1.1 million, a sizable fall in agric~’Iture being almost exactly balanced by a rise¯in non-agricultural economic activity. Having regard to the fall !.n emigration, casting more job-seekers on the labour market,
it is remarkable that the unemployment rate is so low, compared with the past. However, our initial supposition is that it is still intolerably high.
Sources of Statistics ’.
Regular sources of official statistics of unemployment are the Live Register (LR) and the Census of Population (CP). The LR
statisticS, compiled by CSO from returm~ supplied by local offices of the Department of Social Welfare, are published in various detail from¯ weekly to yearly. 2 They are, of course, the main source of current information On unemployment. The CP statistics are available only for a ’single date every five years but they are sub-classified in considerable detail. Statis-tics from both sources have Often been critically compared (e. g. ~7~/.16] ) but this aspect need not concern us much here. It may suffice to state that the great majority of unemployed register at the local offices because they have a financial inducement to do so and not primarily because they are seeking work, though refusal to accept a suitable job would be a disqualifi-cation for paymenL This means that most of the unemployed not entitled to benefit are not included.in the LR. These exclusions include most young people (aged i5-1Y) seeking their first job, endemically a problem category in Ireland because the number is so large. The CP statistics are probably of better quality than those of LR, especially as regards place of residence and classification into occupation and industry, and have been used effec-¯ tively for level and trend comparisons over intercensal periods. In favour
of such procedures is that, broadly speaking, there is a measure of constancy ever short periods in the Characteristics of the unemployed: t.he story at a single date tells the story of many dates near it,
2Media of publication of LR data are the Trend of Employment and Unem-ployment (latest for 1973, Prl. 437S), the quarterly Irish Statistical
Bulletin and current leaflets.
. + .:
¯ " :. ¯ + . ,.
¯ ¯. ’:/ . ¯ ? . ¯ . ¯ ¯, . , . .
¯ ¯ + ¯ .
-:’5-Though they differ in numbers in different categories (e. g. in~Justries), tom[ numbers on LR and at CP of males and females at near Census date usua|ly agree fairly well ~7 , Appendix3.
Statistical Analysis..
Statistics from both principal sources have fairly.tecently been a.nalysed In considerable detail (by one of us amongst .others)’~ so
there is no need to repeat, or even to try to extend, these analysis here. In what follows we shall simply describe the principal relevant results of these researches with as little recourse to actual figures as possible.
" Since the principal official panacea for reducing
unemploy-ment.is economic development, in the comment that follo.ws we have to consider very general relationships between economic and social variables, not only proven but speculative. The question here is: is this "indirect" approach likely to create full employment (however defined) in the reasonab!y near future? If this is so, obviously it is :he choice which should be made to solve the unemployment problem, the problem of optimality arising only in regard to choice and location of economic activity. If not, we cannot exclude the possibility of a rev|val of emigration, though the tatter term may come to be regarded as a misnomer (carrying, as it does, a trail of bitter past associations in this country of relatively, largest emigration in the last two centuries) and the word mobli|t7 as more suitable under EEC conditions; and uttlmateiy the word might be qualified by "external". The modern fashion tends to be for industry to come to people instead of vice versa. The Irish, with their traditions, may be less reluctant to move than most and, environing conditlohs being favourable, be able to take advantage of better wages elsewhere in EEC than in Ireland. Certainly, such migration cannot be ruled out as a part-solutlon. We may here remark that the optimal
eoluti6n of the Irish unempl~yment problem will probably involve a mixture of the:several approaches.
).
The Present Recession
Writing in April 1975 the LR is a little over 100, 000, a 33 per cent increase on its level.twelve months before. In planning this
paper we decided that we could ignore this recession and regard our problem as that of reducing the customary level of 60, 000-70, 000, and disregard the presentday LR as unrepresentative in age, sex, employment etc. of regis-trants. Now we are less sure. How "permanent" is this 100, 000? With the very high level of incomes ruling, tangible capitalisation will be encour-aged with reduction in the labour - to - capital ratio. Has the recession, coupled paradoxically with rapidly increasing money wages, hastened the approach of the Leisure Age? For the present, however, we ignore £his
recent high level of unemployment.
3 See [7)and[24J.
4 We resume the study of Irish emigration in its relation to unemployment
later.
L.
.... .’
-6-Female Unemp!oycd
The problem of lowering the female LR is very minor compared with that of the male LR. At CP April 1971 women constituted 26 per cent of the labour force of 1, 1 million per cent amongst non-agricultural employees¯ A survey conducted by Walsh and O’Toole[22J in 1972 showed that married women’s participation (in LF) amounted to
15.3 (part-time 9.6, full-time 5.7) per cent. Ireland’s full-time rate of 5 per cent is in marked contrast to the some 30 per cent quite common
in Western Europe [22.2, a contrast obviously related to the far higher fertility of marriage amongst Irishwomen, hence With greater commitment
to household duties, still, it is expected that the low IrisE percentage will increase.
On average in 1973 the number of females on the LR num-,bered 12, 000, or one-sixth of the total number on the LR. At CP April
1971 the female rate was 3.8 per cent, less than half the male rate of ¯
10.0 per cent. A rate of 3.8 per cent might be regarded as "full employ-ment" in Irish conditions. Of course, it will be borne in mind that a vagueness attaches to any definition of female unemployment because many of those ~ngaged in "home duties" would be "able and willing" for paid employment if pay and other conditions were right. Even at CP 1966 only 6 per cent of married women described thumselves as in the labour force, nearly the same as the foregoing 1972 survey figure for "full-time partici-pation" but ignoring the 10 per cent part-time participation.
Age Of the Unemployed ~ . .,
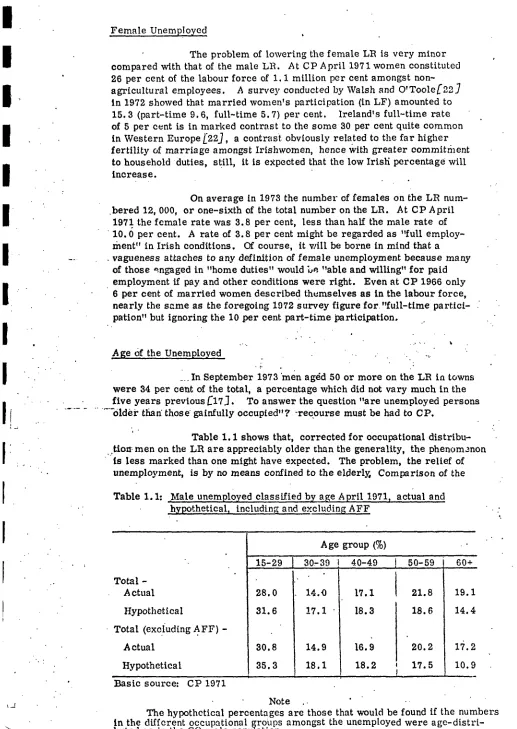
.... In September 1973 ’men aggd 50 or more on the LR in towns were 34 per cent of the total, a percentage which did not vary much in the five years previous ~17.]. To answer the question "are unemployed persons ... -01der than those gainfully occupied"? -recourse must be had to CP.
[image:8.595.5.522.33.762.2]..
Table 1.1 shows that, corrected for occupational distribu-,,riot,: men on the LR are appreciably older than the generality, the phenomenon
is less marked than one might have expected. The problem, the relief of unemployment, is by no means confined to the elderly, Comparison of the
Table 1.1: Male unemployed classified by age April 1971, actual and hypothetical, including and excluding AFF
Total -Actual
Hypothetical
Total (excluding A. FF)
-Actual
Hypothetical
Age group (%)
15-29 30-39 ! 40-49 ! 50-59 i 60+
28.0 14.{3 17.1 I 21.8 19.1
31.6 !7.1 ¯ 18.3 18.6 14.4
30.8 14.9
i 16.9 i 20.2
17.2
35.3 18.1 18.2 ’ 17.5 10.9!..
Basic source: CP 1971
" /
Note ....
The hypothctical percentages are those that would be found if the numbers in the different occupational groups amongst the unemployed were age-distri-buted as in the GO male population.
I
I
I
i
I
I
I
i , ".
I
I
I
I
I
I
i
i 1
-
7-foregoing CP statistics may be made with those of LR. The latter relate to UB and UA claimants residing in towns in September 1971 which are compared with actual (excluding AFF) in Table 1.1 in April 1971
Aged 15-29 Aged 50+
\
%
%
LR - 35.7 32.4
CP - 30.8 37.4
Men describing themselves as out-of-work at CP are older, oh average, than those on LR, possibly because of ineligibility" of older men, though out-of-work, for unemployment payments. Another inference is that the problem may be more age-oriented than i’ndicated by LR statistics.
B. M. Walsh~24j, regressing the proportion of the urban male LR in each age group on (i} non-agricultural unemployment rate (ii) n’~t emigration rate and.(iii) linear trend in the 19 years 1954-1972 found highly significant results for age groups over 21. Expressing the coefficients for (i) in mean elasticity form, he finds elasticities ranging regularly fror.1 .57 for ages 21-24 to -. 81 for ages 60+. He infers that "as the unemployrhent rate falls the proportion of younger men on the LR tends to fall .. At the other end of the scale, as the unemployment rate falls, there is a fairly pronounced rise in the proportion of male LR con-sisting of those aged 60 and over".
CPApril 1971 shows that, when the general male un-employment rate was 10 per cent, the rates for all four young age groups from 14-19 to 35-39 were much the same at 7-8 per cent; the rates increased sharply and regularly from 8 per cent for ages 35-39 te 25 per cent for ages 65-69. If these figures show the age-effect more empha-.ticaUy’than previously, clearly the ra~es for young men are formidable.
Duration of Unemployment
Unemployment is specially severe in Ireland for those who experience it at all. TUE shows that in September 1973 the average number of weeks of employment obtained during the previous twelve months was 12, the lowest figure for the six years 1968-1973, for which the average was 14 weeks, I.e. men on the LI-I spend one-quarter of each year at work and three-quarters idle. Further, the number of weeks employment does
not vary so much With age: in September 1973, while it is true that the under 21’s got 16 weeks work, all other age groups from 21-25 to 60-65
ranged from 10-13 ~veeks.
From a different angle: tn November 1973 almost exactly half the males and 45 per cent of the females on the LR were in continuous
registration (i. e. ot~t-of-work) for a half-year or more.¯
I
I
I
I
I
I
I
I
I
I
I
I
I
I
I
I
I
g
-When one studies the table of the percentage of regis-feted unemployed males who had no worl.~ during the previous twelve months one is immediately struck by the great rise between the years 1968 and 1969, obviously due mainly to the increase (in 1968)~ in duration of payment of UB from six to twelve months.¯ From ages 25-29 to 60+ the percentage increased rapidly and regularly from 18 to 46 in September 1972.
In a very interesting section of his paper WalshL"24J showed that in 1972-1973 the probability for males of remaining on the LR for at least three months averaged . 60 compared with. 39 in 1966-1967, six years before. The male probabilities for remaining on LR for twelve months or more nearly doubled in the six year period, from . 14 to .23. The female probabilities showed the same upward trend, but at a far ¯lower level.
This sharp tipward trend in the propensity to remain for long terms on the LR we assume to be mainly due to the rise in unem-" .... i)[oyment payments, proportionately much greater than in incomes which
we discuss later. Walshf24J calculates that in 1974 an unemployed father of four would have a net income equal to 88 per cent of average net indus-t’i~al earmngs as long as he qualified for UB (which qualification period, to repeat, has recently been extended from six to twelve months) and equal to 48 per cent when he was on UA. This contrasts ~tth the 32 per cent estimated by Geary and Hughes ~7] for total payments in December 1967
of non-agricultural UB and UA in relation to earnings which the workers concerned would have received, had they been employed. It will also be borne in mind that unemployment payments are not taxable and tbat the unemployed also receive children’s allowances, if qualified.
That, humanly speaking and in .no censorious spirit, leisur.e
has become so profitable, clearly the problem of setting the unemployed to work is exacerbated.
Regions
Amongst the eight regions into which TEU presents the LR statistics, the non-agricultural unemployment (NAU) rate, for Dublin (Dublin Co. Bore’ and Dun Laoghaire Bore’) is by far the lowest. Geary and Hughes/’7 J remark on what they term the "staircase effect" of the
regional unemployment rates. This means that the annual regional rates (in the period 1950-1968) follow each other closely with Dublin nearly always lowest: the economic level and trend in this small country is pervasive. These authors also show that the eight NAU rates ire reasonably consistent with six socio-ec0nomic indicators, e.g. percentage population in towns and average employee income. Rcgressi’on of net emigration rate on the NAU rate for the intercensal period 1961-1966 was e = -9.35 + 2.57 u, with
¯ C
r = .83 significant (P = .01) with d.f. =’6.
When Walsh ~24] regresses the annual NAU rate for each region on (i) the annual NAU rate for the other se~en regions and (ii) linear time trend during the nineteen years 1954-1972,R is never lower than . 87 and DW’s are indicative of residual independence. He finds that the high slope coefficient associated with the rcg’[on Ulster (part of) (with a compara-tively high NAU rate) suggests that this region experiences greater amplitude in its cycle than is true for the rest of the country. Walsh concludes from this
part of his
--9 ""
"This is serious evidenbe of a growing regional imbalance between labour markets, and suggests that cithcr manpower
policies must be directed to encouraging labour migration into Dublin and Munster, or that more vigorous efforts¯ must be made to encourage industries and services outside Dublin and Munster."
He asterisks this conclusion with the remark "The recent announcement of some large-scale industrial projects for the North Connscht region may alter the situation dramatically." The date of his paper is October, 1974.
Occupation and (Normal) Industry
The large wealth of data available in these regards from both CP and LR are perhaps the best indicators of the circumstances of the unemployed, to be taken into account in any schemes for alleviation. In the comments following attention is’confined to the male NAU.
Geary and-Hughes remark ,Non-agric’ultural unemployment
in Ireland would scarcely be the major.problem it is were it not for its chronic magnitude in three very large/unskilledJoccupattonal groups". The three groups are (i) builders’ etc. labourers, (ii) road etc. labourcrs and (lii) general labourers, practically all male. These are termed Depressed
Occupations (DO). ¯
.-"..
At cP April 1971 together they accounted for 20, 000 out of" a total of 43, 000, i.e. not far short of one-half. Their unemployment rate 5 (t. e. as percentage of number of employees at work and out of work) was 22.7 compared with a rate of 5.6 for all other male non-agricultural employees,¯ i.e. p ratio of 4.1. The general male NAU rate was 8.6.
No fewer than 91 per cent (CP 1966, Vol. VII) of DO’s (at work and idle) ended their education at primary level and one must surmise that DOs contain many of that near 50 per cent of primary level children who
(9.9.. 1963) left without completing the course.
Geary and Hughes estimate that about 2, 000 young men enter DOs every year. It is true that, as Hutchlnson/10Jshows, many DO entrants improve their employments in their subsequent career Odyssey. The majority don’t. There is obviously a vast social waste in this recruitment (mainly from under-privileged homes) to relatively poorly-paid (an entrant should reckon on only 75-80 per cent annually of the low stated pay) and probably unpleasant
duties. The erosional rhetorical question in ~93stands "How many geniuses are lost every year amongst the 2, 0007"
A mitigating circumstance, also relevant to this inquiry, is that one-third of those in DOs live in households with agricultural land
[7J.
Many of these people therefore have a modest sufficiency, making them less inclined to seek better work.
5 Not including male agricultural labourers out of work (April 1971), numbering
10, 000 or 28.8 per cent.
.’ ., ":
... .’
: ’ ’ " , 4)..~
I
I
I
I
I
I
I
I
I
I
I
I
I
I
I
-10-The LR statistics are also analysed by industry. From what has gone before we are not surprised to find that in the Construction
g1’oup of industries the rate (14 per cent on average in 1973) is twice as high as the gener.al average. It is obvious that any serious attempt to reduce un-employment must concentrate on (i) General building and (ii) Other construc-tion (roads etc. L. and/or reduce the numbers engaged in them.
Using CP April 1966 statistics, Geary and Hughes. showed that, out of 184 industries, 79 had rates less than 4 per cent unemployed, which industries accounted for 42 per cent of the non-agricultural GO. The proportion of persons GO in industries With less than 2 per cent unemployed (in 1966, the conventional percentage for lndicattng’~ull employment") ~;~s 19
per cent.
Reverting to LR, there is a strong cyclical similarity be-tween the trends ’in the unemployment rates "in eight broad industrial groups, a fact of considerable importance in considering the extent t0 which the future trade cycle can be relied on to reduce the unemployment rate autonomously. If we succeed in reducing the rate in Manufacturing, will reduction follow in Construction, Commerce etc? Geary and Hughes, using annual data 1947-1967 inclusive found generally high c.c.s, between Manufacturing and six of the seven other major groups, not only using absolute rates as data but the far more testing year to year chan~es.
B.M. Walsh carried the industrial analysis still further, in regress!ng the unemployment rate in each of eight broad industrial groups on trend and the general non-agricultural rate excluding the dependent variable
group, using an,real data for the more recer~t period 1954-1972. He finds high values of ~2 (none less than. 54, the highest Commerce .91 and Services ¯ 86 and
concludes}-"Construction is a very major contributor to the national unemployment problem, and the fairly significant negative trend in this sector is the most encouraging showing/.’of his Table 15J. On the other hand, the significant positive trend in such important sectors as Manufacturing and
Commerce indicates that these sectors have experienced an upward trend in their unemployment rates relative to the national average"¯
As to the latter part of the comment it may be noted ’that Walsh’s da~.a extend
to the not-~o-good years 1968-1972, compared with those of the Geary-Hughes analysis. Walsh makes the following important comment as a result of his
consideration of the Construction industrial
-1-1-i
I
!
!
I
I
I
I
I
I
I
!
I
I
I
i
I
I
Emigration
All researchers have linked emigration with uncmploy-ment. Itappily nowadays emigration is a less emotive subject than it ~.~s. Geary recalls his coming in for adverse public criticism in the 1930’s when he showed that emigration in the 100 years before had more of the character of a "pull" (to other countries) than a "push" (from under-development at home) and that a large increase in population (i~ e. to anything like the politically sacrosanct pre-Famine 8½ milli611 for the whole island) by the end of this century was moat unlikely/:5~. Scarcely a vestige of this publ]c attitude
remains, possibly because of the diminution to vanishing point in the most recent few years of net emigration.
This diminution, coupled with the greatly increased marriage rate, in a short term of years is a most remarkable phenomenon. It means that possibly for the first time in Irish history a majority of young
people have come to believe that they could make a c.areer in Ireland. Such ... asentiment is, of course, to be welcomed, but it can also exacerbate the
problem of finding work at home.
Since we regard emigration (which as was indicated earlier ---we-pT-efer to’call "mob|l|ty"- ) as one of the choices open as a partial soluti~_n
of the unemployment problem in" certain circumstances and as we consider that much of the public thinking at present on the subject is wrong, as being too influenced by traditional attitudes, we make no apology for dealing with it here at some length and depth. ..
A generation or so ago quite respectable academic opinion argued that, ff the cost to.the mother country of rearing an emigrant was £20, 000 a year, a country lost £20 million a year if 10, 000 emigrated. Yes, as simple as that. Geary now reads his attempted refutation~.6J(on ethical and economic grounds) with some embarassment,, pleading anger and outrage when it was written. He now admits that there can be circumstances in which the initial argument is justified but overwhelmingly he maintains his original "" " opinloh.
,~’ ~: He did not then realize, as he has since, that this "value
of an tndiv~.dual’’ (in money or other terms) is the most fundamental social problem of our time. It cannot be left out of account in any consideration of welfare, of which our unemployment problem is one aspect. Theproblem is : .is the interest of the State or the Individual paramount? These interests
may be in conflict.
From the viewpoint of the State, emigration may have good and bad effects and these may be different at different times. For instance, it may relieve the State of. a costiy burden of mendicancy but leave it with an undesirably high dependency ratio; there are lots of other reasons for and against.
We speak of the "interest of the Individual" in no absolute Sense. We mean what the person judges to be his or her interest, in which, of course, they may be quite wrong. But are they wrong? Of course they sometimes are. But I am more likely to be right as to my own interest than is the State, however paternalistic - we use the term in no pejorative sense. In a free society the individual has the right to be wrong when he "is breaking no law, human or Divine.
I
I
I
i
i
I
I
i
i
I
I
I
i
I
I
I
I
I
12
-modify this view. In the same source these authors remarked that, defining the Irish Eace as the home population and emigrants since the Famine5 and their descendants numbering perhaps 15-20 million including home population (all Ireland, when they ~vrotc) of 4½ million, this population, having regard to the countries to which the emigrants went, had a very sub-stantial rise in the real standard of living per head whereas if compelled to remain at home would have the lowest standard in Europe, as it had pre-Famine.
Some of the foregoing views may be regarded as ideo-cyncratic and we have no wish to insist on them. What we d_..qo maintain, with all the emphasis at our command, is that in this rapidly changing society, emigration, unemployment and every other social problem should be given a new look untrammelled by traditional thinking. Prior to Indepen-dence (in 1921) this thinking was all political, and revolutionary political thinking is always biased, over-simplified, and often plain wrong. Even If right, it has now little or no relevance in this changed society.
" From the world point of view the Irish propensity to emigrate temporarily or permanently is a positive good, ff only on balance of good and ill, like everything else. It is so deep in our tradition that thoughtle.~s curbing of it nmy be harmful. In the 9th century the monk Strabo, thinking about the .arrival of the Irish monk Sedultus "whether it was dread of the Danes or simply ...’the Irish fashion of going away’ that brought him to France". Push or pull nine hundred years ago’
Nearly all young members of ou*: Institute, most of them honours graduates in the social sciences, now leave Ireland for jobs or further study, or plan to leave. That so many are acceptable by foreign
organisations of higher learning is gratifying. Many have settled down abroad. In the other direction, the number of foreign professors and students comir~g to reside in IreLand is increasing.
Within Ireland, and no doubt everywhere else, the volume of migration is strongly rela’.ed to degree of education reached, highest for third level, lowest for primary. Surely it is in the interest of social efficiency that this professional mobility should obtain amongst nations. The higher the specialized skill the greater should be its mobility, on a world basis.
Relation between EmigTation and Unemployment
The number of persons born in the Irish Republic residing in England and Wales in 1966 was 674, 000 equivalent to one-third of the population of the home country aged 15 or over. This extraordinary showing as between politidally independent countries,, naturally raised the question:
does the Republic behave in the unemployment-emigration relationship as if it were a region of Britain7
To answer, Geary and Hughes ~7)studied the relationship between the average rates of unemployment (u) and of net emigration (e) of insured persons in seven British regions in the five years 1962-1966. The regression
was:-e = -0.7684 + 0.426 u
"6 The Famine of 1846-1848 was one of the worst disasters that afflicted any
people. It reduced the population of all-Ireland by one-half and its materiai and psychological effects are still with us. ,
i
I
I
I
I
I
I
I
I
I
I
I
I
I
I
I
I
I
I
I
I
i3
-for which r had the remarkably high value of .98, overwhelmingly signi-ficant, even with only 7 pairs of observations. If this foirmula applied to Ireland, the NAU rate for the years 19G2-1966 bcing 5.8 per unit ( = u), using the foregoing formula average ammal net emigration would have been 8,600, rcgarded as a reasonable estimate of the net emigration of
non-agricultural unemployed, in annual average net emigration of !6,000’ in the period 1961-1966. The authors therefore found that in its reaction emigration-wise to unemployment, the non-agricultural unemployed behawd as if the Irish Republic were a British region.
This Would mean that part of the explanation of the low emigration rates in the past few years is the depression in’Britain. One infers that ff the rate of recovery in Britain is greater than in Ireland, migration to Britain will be resumed, in possibly sizable volume. As ECC is also depressed but with a potential for recovery and advance possibly greater than for Britain or Ireland, a future large migration to the Continent cannot be ruled out of account. Such a move cannot be prevented, should not be deprecated, but efforts should be directed towards making cpnditions for migrants as good as possible, including training them properly.
No pne has studied the rc:atior!ship betwee.~ unemployment and migration more successfully than has B. M. Walsh/.’21]using single equation regressions, with either variable as dependent. An equation
explaining year-to-year change in number of NAU (LiUn) is as
follows:-o
AUn = 14.61 -0.53/1En - 0.42 ~ +e, .(5. 1) (5.3) (5.2)
E being neff-agricultural employment, M levei of net emigration, all ~um-bets in thousands, regression period 1952-1966. For a /~ equation the ~2 =. 73 is remarkably high. One may be ,]oubtful about the chain of
causation: if /2E can be regarded as indicating change in production and hence a causation vnariable, M is surely more "the effect than the cause of ¯ cba:nge in numbers unemployed, i.e. ~ U . This is the view taken in another
n
of Walsh’s regressions (quoted, with reference, in
~16j)--N = 7.05 - 9.56 WI + 0.33 UI (4.8) (4.3) WB (5.1) UB
N, net" emigration as percentage of population aged 15-64, subscripts I and B meaning Ireland and UK, W average real weekly earnings of industrial workers, U annua.l average percentage of insured workers registered as
unemployed (excluding agricultural workers in Ireland). This is statistically a very satisfactory relationship:, its R = .84 and if its DW = 1.37 is some-what low, as indicating absence of residual autoregression (i. e. completeness of relationship ), the cause-effect direction seems right, in th~ case of all three variables involved.
Regarding the last relationship as an eciuation and taking
WI/WB as 0.8, (more or less realistic) we find that Nt = 0 when U./U_ = 1.8, an annual ratio never obtained in the post-war period. It will be unrealistic to leave migration out of account in any future consideration of lowering the ¯ unemployment rate.
¯ ..,’. . . . .’ .
:.,..."
, :...
¯ ./ . . ’.
. . ¯ .
i ’: :".." "’." .., :.
I
I
I
I
I
I
I
I
I
I
I
I
I
I
I
I
I
I
I
-
14-Full EmFloyment
This condition has been adjudged by percentsge unemployed. The report on Full Employment of the National Industrial Economic Council (NIEC) published in March 1967 proposed s figure of 2 per cent. Since then there has been a lowering of sights, following a more realistic appraisal of what is possible in Ireland. Almost independently in the Colin Buchanan and Partners Report ~2 ] Geary and Hughes[7] B. M: Walsh [14J and the National. Economic and Social Council (advised by B. M. Walsh) (NESC) assume 4,per cent and S. H. Santell [16.] raises the figure to 5 per cent.
The NESC /14 ] asked B. M. Walsh to make population projections for the period 1971-86 and to calculate the net increase in total employme~,t which would have to be achieved if full employment were to be reached by !986, on certain assumptions about the possible behaviour of emigration, fertility, marriage and participation rates. The Council prudently adds "It cannot be emphasised too strongly that Professor Walsh’s projections are not forecasts of what will happen", a point stressed by Walsh himself in his.report appended to the Council’s. This figuring is merely a sensible aid to thought and to planning.
*
As a pioneer in the field of projecting the irish population by age ... and sex on various assumptions ~’5J Geary congratulates Walsh on his
thorough-ness. As Wal~h’s projection period is only 15 years from CP date April 1971/ one can have much confidence in his population results for 1986, especially for ages 15 or over, for all these people were in existence and included in CP ¯
1971. Hazards attach to the projections of numbers under 15, number married, participation and fertility rates. Walsh pays close attention to the past trends in the multitude of rates involved in his projections. He presents his results in the form of Low and High estimates. The range shown for 1986 mainly
reflects variations in assumptions made about emigration and participation rates. The main result is tha~ if the average redundancy rates (i. e. num-ber of redundancies each year as percentage of industrial employment) were 2½ per cent (only half the rate obtaining in the last few years), the gross number of new jobs required would be of the order of 375, 000 to 420, 000 - or over 25, 000 a year. Is this possible?
In this connection regard must be had to the activities of the Indus-trial Development Authority (IDA) which, under the Minister for Industry and Commerce, has national responsibility for industrial development in Ireland. Mention should also be made of the Shannon Free Airport Development Company
Ltd (SFADCO), also an agency of the Department of Industry a~Jd Commerce, creator of Ireland’s first new town, Shannon, with a population over 6, 000, responsible also for the industrial development of the Mid-West Region, in con-Junction with IDA. /
¯ .,, .
*: "%.
¯ k
I
I
I
I
I
I
I
I
I
I
I
I
I
I
I
I
I
I
I
-15::
In the last four years the achievement of IDA may be summarised as follows:
Tables 1.2. IDA transactions 1971-1974 in manufacturing industry
Amount Invested Jobs created A mount
Year ended invested’
31March Total
As %of -
Projected A cruel per ’job created (2 .*- 5) GNP GDFCF1 2 3 4 5 6 7
.£m
%
%
.000i 000 £000
1971 23.5 1.4 5.9 12.5 7.6 1.9
1972 12.5 0.7 2.8 8.7 16.9 1.4
1973 23.0 1.0 4.3 14.1 17.8 1.6
1974 58.8 2.2 9.5 23.3 16.2 2.5
* New industry and small¯ industry grants. Main source: Annual Report of IDA, 1974
Col. 3: Col. 4.
Notes
Gross National Product at current market prices. ’
Gross Domestic Fixed Capital Formation at current market prices.
Our general appraisal from Table 1.2 is that IDA has been very successful in creatihg jobs at low capital cost in manufacturing industry. The number of jobs created as shown in columns 5 and 6 is, of course, gross. There is no contradiction between these sets of figures: the "prbjected" figure relates to number of jobs ultimately to be created some of which levels have not been achieved. We shall, however, take the "actual" figures of some 17, 000 gross per year (i. e. the lower figure) in manufacture during the last two years shown. To achieve a ne._/.t figure we need an annual total to account for redundancies, retirements and deaths. NESC [14] suggest 5 per cent for redundancies alone for "industrial employment’.’, amounting at present to about 10, 000 a year. If this figure be accepted for all reductions the net annual increase for manufac-turing industry would be about 7, 000 ( = 17,000 "- 10, 000). How does this accord with Walsh’s projected increase for al./.[ ~obs?
One of the most constant statistics for Ireland in the recent past has been the number, actual (at CP) and estimated, in the labour force (i.e. GO at work and out of work), at CPs of 1961, 1966 and 1971 being (in million) 1.11, 1.12, and 1.13 respectively, and for each of the years 1967
-16-I
I
net emigration never exceeding 5,000 a year, he requires this labour force total to move i:o i. 30 - 1.35 million by 1981, a narrow range it will be noted,
[image:18.595.0.527.31.744.2]between his High aad Low estimates. Making our own guess for the number at work in forestry, fishing and employees in agriculture, and accepting Walsh’s figure for family members at work on farms, we find 0.18 million in AFF, leaving I. 12 - i. 17 inillion for number at work in non-AFF in 1985, ~%y i. 14 million. . , ¯
I
I
I
I
l
!
I
Proportions of non-AFF at work in manu.faeturh~g industry
were identical (to units place) at 27 per cent at CPs of 1961, 1966 and 1971. As this constancy trans~pircd during a period of o-teat economic advance, we see no need to change it for the year 1985, so our 1985 estimate for number at work in manufacturing industry would be 308,000 ( = 1.14 x. 27 million compared ~;rith 214,000 at CP 1971, an average net advance of 6,000 a year in the 15 years 1971-1985. This 6,000 compares with the ’,actual’: 7,000 achieved by IDA estab]iahed above for manufacturing industry in the two years 1973-1974. It would therefore appear that a continuation of IDA activities at more or less present levels would be likely to lead to full employment in 1985. We must look at such a crucially important inference from another angle.
The figuring purporting to lead to such a heartening conclusion is obviously hazardous, in particular in the assumption that the 27 per cent for manufacturing as a proportion of non - AFF employment will persist. So we try to check our finding against experience in some recent
years, mindful that the last two years are of deepening depression - see Table 1;3
¯ Table 1.3 Gross and net changes in numbers at work in Irish manufacturing industry, 1971-1974.
Thou sands Head Month of December
1971 1972 1973 1974
I CSO, actualnumber 2 Dec. to Dec. net change
3 Gross’new jobs created, Dec. to Dec. 4 Estimated job losses
i95.8 199.7 207’. 5 203.7 -3.4 ÷3.9 +7.8 -3.8 7.6 16.9 17.8 16.2 11.0* 13.0. 10.0 20. C
I
I
I
I
I
i
I
o.
Source: AnnualReport IDA 1974 "" .
* 10.0 in IDA Report, 1974. Note___~s
~ - = ’ "
Head 4 = head 3 - head 2. While some statistical doubt must attach to Table 1..% - in particular do head3 figures derive from the (very rounded) head 4 figures or vice versa - only in the case of one of the four years, namely 1973 (usually regarded as the most prosperous recent year), has the required 6,000 at head 2 beeu exceeded. One notes the great variation from year to year in the head 2 figure. Evcn if the 1974 figure be excluded, as that for a year of depression the average gain for the three years 1971-1973 is only 2,800. Also, the poor
showing of the net gain in the years 1971-74, in order to obtain full employment by 1986 the foregoing net target of 6,000 a year for fifteen years would h.~_ve to be revised to something like 9,000 a year for the remaining period.
The foregoing paragraphs are included as an exerclse in economic arithmetic which may have some interest. Concl,~sions must be indecisive. It seems
I
I
i
I
!
I
I
Other ]lemarks about Employment
--1’7-Withall the cons,ramies-we have cited for the recent past, experiences of simultaneous occurrences of ~uncmployment with ~ uet
emigration and, very recently, of lou___., or no cmigl"ation with very high.unemployment, it is hard to conccivc of low unemployment and low emigration obtaining a decade or so from now. In the rapidly changing world anything can happen; we shall be wise to keep our options open.
,. ".
As we have already suggested, one of these is mobility. It is of the first importance that we shed our traditional attitudes and take a fresh look at everything, mobility in particular. If, with a high birth rate continuing
(see below), migration out shows a tendency to revive, it will do so On the
decisions of free individuals and so accepted by the nation, increasingly Europe-.. orientcd. Official recognition (perhaps by a Division in the Department of Foreign Affairs) must transpire, to look after the interests of migrants. In the education
andtraining of our people, the possibility of mobillty, must be borne in mind, e.g. in teaching foreign languages, though we Irish are fortunate in our having as a native tongue English for the vast majority, now almost the lin~m france of the West. In certain circumstances it may be conceivable for an Irish govern-... mont..to promote migration, should high unemployment come about.
¯ . Acceptance of the 27 per cent obtaining in 1985 as the proportion of number in manufacturing to non-AFF total at work implies a theory of autonomous-induced in the T.J. Baker . 1 sense,¯ "autonomous-induced" being much the same as "cause-e/’fect". Baker {vould not regard all manufactures as autonomous nor indeed all non-manufacture (e. g. the public "service) as induced. He would probably agree that in the present-day a much
more prosperous agriculture may have higher powers of loca____l induction than when he wrote his pioneeri.n~ paper in ¯1966.
", Niight we suggest that government and IDA interest themselves in Promoting services and service-type industry (construction7 etc. ) as well as manufaoturifig, so as not to rely on the latter (alone) bringing this about by ¯ induction ? In this connection one welcomes the CSO’s 5 per cent Labour Force
Survey which, if carried out annually and promptly compiled, will make it possible to keep the employment situation under review and to help promote balance where
necessary.
°. .~ .¯¯¯ .
°.
. °
7Building and construction are of course, fostered by government but, we suggest, not cneugh, as evidcnccd by the cnduring condition of largc unemploymcnt .in this
indu strial group.
-18-L
While the promotion of manufacturing is deeply embedded in the Irish consciousness as almost the sole expedient for’increasing employ-meat and for reducing unemployment, very recent work on Irish towns/:’.4j has shown that the industrial town is not a parttculal:ly prosperous one. Other employments should be positively promoted.
Finance 8
- In 1958-59 payments of UB and UA together amounted to £4.5 million, in 1973-74 to £36.2m., equivalent to 0.7 per cent and 1.3 per cent respectively of current GNP at market prices. These amounts are gross, i.e. of contributions to UB by employees and employers and of govern-ment to UB and UA. Contributions by employees and employers are, in the national accounting convention, regarded as part of direct taxation. As propor-tions of current transfer payments (excluding national debt interest £37 .2m. in 1958 and £298. lm. in 1973) unemployment payments represented 12.1 per cent in both 1958 and 1973.
The amounts paid to the unemployed are strategic figures from our point of view. In fact, the success or otherwise of two of the approaches we consider for lessening unempldyment, namely direct labour and labour subsi-disation mus~ be adjudged mainly by the saving they effect in unemployment expen-diture. In the last paragraph wehave shown that, in relation to GNP and to the total of current transfers unemployment . payments are surprisingly small, ... despite our high u,~employment rate. I%1972-73, the.last year for which full
details of transfer payments are available, we note *.hat UB and UA together amounted to £27. lm. but old age and widows’ pensions were £64.5m. and £25.9m. for disability payments, actually only slightly less than unemployment payments,
£27..1.m. This situation is somewhat anomalous if one takes the view that keeping " ...~’-the nation’s labour force health] arid competent shoul’d have a high priority in
. government expenditure.
¯ ’ .... It is show~labove that the proportion borne bY unemployment payment:: in the total of transfer payments has been much the same in 1958-59 and ~973-74. Indeed a quasi-constancy in the proportions devoted to the different
¯ objects of transfer payments is inevitable from the political point of view. Accord-ing to precedent, any increase in unemployment payments can come about only ¯
"with an increase across the board in transfer payments,
In 1973 Geary C8 ~showed that "having regard to relative incomes Ireland’s present distribution of transfer income (except national debt interest) measures up to the best EEC standards". For this view he was roundly assailed by J. O’Higgins and’M. O’Hagan ~15~ B.M. Walsh~23.7 and Finola KennedyL:ll~ also took part in the debate. Gea~-y had purported to show, from a study of the relative trends of personal income per head (Y) and current tra,~sfers
(except national debt interest) as percentage of current personal incomes (X) in the period 1947-1971 that when Irish income reached EEC levels, Ireland’s
transfer payments proportion would exceed those of all other eight EEC partners. O’Itiggins and O’Ha~n maintained that in such a study what was relevant ~-as rathez a cross-section study of countries in relation to the two variables and not a time
trend study for a single country. In an unmeek rejoinder~’8.~ Geary~ using new
¯ . -19: .
estimated data, showed that in the period 1’968-1973 X and Y were both increasing exponentially but X (the ratio) ~:~s rising at a far higher gradient: He therefore maintained his position that Ireland was well at the head of the EEC league in Lhis matter.
O’Higgins and O’Hagan did not try to rebut Geary’s thesis but rather to insist that he had not proved it. Walsh’s main point ,~-as that Geary’s transfer payment bag was toe miscellaneous. Kennedy agrees with Geary, also maintaining that this was the case with Walsh.
This issue is an important one, in the unemployment con-text. That, as a poor country, we are now far ahead of our partners in income redistribution (in deference to our critics we parenthesise "ff this be so")
must constitute a potent argument with EEC for a more than average share of payments for unemployment and other relief.
i
The Future of the Dependeney Ratio "
B. M. Walsh’s./.14 J estimates of the dependency ratio fol
1986, ranging from 68 to 79 from his various projections (compared with 73 ¯ in 1971) are still very high by presentday European standards. These projected
excess magnitudes are due entirely to young dependency, in turn due to the high birth rates ranging between 21 and 25 pei- 1000. Are these rates, based by
Walsh on very careful assessments of nuptia!ity and fertili.ty, plausible? The rate in 1974 was 23.
In 1973 the birth rate amongst our eight EEC partners ranged from 10 - 16, actually less.than half the Irish rate of 22 in the case of West
Germany, Despite the nearly 50 per cent increase in the marriage rate since
__ . ... !9_66 after a long period of stagnation, there are little signs yet of an increase in the Ii~lsh birth rate, norindeed does Walsh forese~ any large increase9,. But it s.eems likely that, as Ireland’s relations with its EEC partners
- .beCbme closer, its birth rate will also move nearer to the the EEC average,as has the marriage rate.
At several points in this chapter we have felt compelled to refer to mobility. Yet another remark: if this difference, or anything like it, in birth rates, persists, migratory (temporary or permanent) manpower might become one of the nation’s most precious assets. In an increasingly wealthy Europe the country’s receipts from m~grants’ remittances - a not
negligible £32m in 1973 - could become a formidable element in helping to balance our current international payments, rather chronically out of balance
Are the Unemployed a Class Apart?
In the absolute sense ti~e answer is No; there is some move-ment into and out of the LR. But we have seen that ha]f the number of men on the LR in November 1973 were there for six months or more; that in September 1973 townsmen on the LR on average had only 12 weeks employment in the pre-vious twelve months. It is also relevant to renmrk that the two big unskilled categories experience une,uployment with cxceptional severity. Obviously there is a hard core of uncmployed, I.e. of men who are permanently on the LR.
-20-To answer the question posed above, we require statistics of the amount of unemployment experienced by tl~e employcc class as a whole and not merely particulars of the unemployed at particular dates. Unfort~m~tely information of this kind for Ireland is available only for a remote date in the past, in fact at CP1936.
At CP April 1936 the number of NAU was 69, 000 or 12 per cent of the non-agricultural empioyee class (.573(000). Of these, no fewer than 428, 00O, or 75 per cent, experienced no unemployment in the previous twelve months. This means that only 145,000 had some unemployment during
the tweh, e months, about twice the number out of work at any given date. We do not know if this latter fact still obtains: there are indications that the 2:1
ratio would be lower recently but before the present recession bega’n. Our answer to the question must be something like "Mainly Yes". This does not mean that most or any of the long-term unemployed are unemployable. If this were true there would be little point in this exercise. It does mean that. perhaps the majority of the unemployed at any given time have become accus-tomed to unemployment as a way of life and for this reason alone, may be reluctant to change (even though change may be demonstrably for the better) especially with the present increased rates of unemployment pay. This is surmise. To m~ke it less so, is .the main reasonfor embarking on a sample survey, pilot to start with; see Chapter 3.
Choices Open
These are
several:-1. Leave matters as they are, accepting present level of UnemPloyed, remun-erated as well as the country can afford.
2. Rely on the purely economic approach with perhaps intensification of IDA effort.
,.
3. Wage sub~,idization, whereby employers receive payments from the govern-.merit to keep on workers whom they would otherwise have to let go.
o
Q’
7.
A direct approach: as soon as a worker becomes unemployed he is given a .job low in material and capital cost, a large extension of present LA practice
which extends only to minor road making and repairing etc. These works are social in clmracter, large}y tnfrastructural, typical of the kind of tasks un~’Jer-taken by government, with no goods or services for sale.
Another direct approach: the setting up of local industries, cooperative or other which, while produ’cing goods or services for sale, are not primarily impelled by the profit motive.
Controlled mobil]ty internal and external.
Programmes of ~.raining, retraining and general education of the unemployed.
.-’21- .
While we do not thitfl~ that Choice 1 will ever be acceptable, it is necessary to point out that an optimal solution, i.c. "the greatest good to the greatest number" on linear or mathematical programming lines, subject to specified constraints, may ordain a high level ’of unemployment, unless of
course, one constraint is that this be low.
. .. ,. ¯ : ..=.
In our view, 2, as far as it succeeds, is by far the best of all choices though its success wiU almost certainly involve others.of those listed, e.g. the i~ffrastructural element in 3 and 4. A proper study of 2 would involve us "in ~he history of economic development in Ireland which we cannot undertake¯ Instead we would refer students to an excellent treatment by James Meenan ~12].
We would hope that examination will find merit in 3, especially in times.of depression like the present. One wonders to what extent it is per-missible under EEC regulations as enabling Irish industries to reduce prices to increase sales at home and abroad - unless it be adopted by all nine members¯ Certainly it would be one of the most acceptab’e and least disturbing, to the worker himself, as avoiding or postponing redundancy.
As to 4, at little cost and with’little extra training, in addition to road-making one c.euld list environmental improvement, site clearing, drainage and clearing of gorse etc. 0a farms, house building (an industry with a perennially
large number of unemployed}, and works ia the interest of the tourist industry which may thereby reassume its position as the Irish industry with almost the largest potential.
TDA might take over 5. We have already dealt at fair length" with 6. We have 0nly to repeat our app~-~l to shed traditional attitudes towards
emigration, and recogaise it fully at official levels. We add one remark: tradi-tiorml appraisals of emigration are always biased as relating to particular
|nvar!,abl.y:bad cases coming to the notice of" charitable societies and the press.
Nothing could exceed the importance of 7. Here one would like to see an extension of AnCO, though teachers will be faced in a large way with the age of trainees and low level of formal education attained. The impression prevails that we Irish are insufficiently trained or educated.
Almost all "that has gone before is surmise. to convert this into something more reliable.
..
-22-I
I
|.
Appendix to Chapter 1.
The first draft of Chapter 1 was presented as a separate paper
(as by R.C. Geary) at the 1,1th General Corffc;’enee of the International
Association for Research in Lucome and Wealth held in Finland in August 1975. We are much indebted to K.A. Kezmcdy for the following summary of the discussion.
Mrs Margaret A. l~¢od of the Central Statistical Office of Ihmgary,
the discussant, beg,’m by saying that it would be good if more scientific papers were written as ctearly as Dr Geary’s. The paper deals with the phenomenon of unemployment itself rather than with its implications for the national accounts. Sh’e welcomed this policy-oriented approach. A total of seven possibilities were listed for dealing with the phenomenon. She agreed that a mixture or combination of these policies was required.
Speaking of emigration, she raferred to the Hungarian situation where there was substantital emigration in the 19th and early 20th centuries,
so much so that the country was unable to maintain its pop’ulation. After the war, there was a major drive for full employment both because this was desirable in itself and because they felt that everyone’s work was badly wanted to rebuild the country. Hungary was successful in this, and even though many
of the occupations involved low productivity wor~ :, still she felt it was better to have everyone employed. She did not regard emigration as a free decision in a situation where insufficient jobs were available.
’" She felt that Dr Gearyrs paper did not adequately distinguish
between the present situation and the prospects for the future,, given the substantial natural increase in the Irish labour force. In her view, economic development should play the main role in pro~iding adequate jobs. Emigration temds to leave behind a demoraHsed population. Welfare payments make development harder since people become accustomed to them and unwilling ¯to take work, ]~’ailure to give priority to economic development would widen
---the gap further between Ireland and other countries, she queried the conclusion in Dr Geary.’s paper that the present rate of economio development in Ireland would be,sufficient to achieve full employment in the next decade.A]
i
i
I
i
She raised the question as to why there had not been greater capital inflow from abroad, since she assumed that there was a plentiful supply of cheap labour. She felt that particular attention should be given, in looking to,wards the future, to the question of what manpower structure was best adapted to the needs of the cotmtry and what training ~as required to achieve this structure. She felt strongly that priority should be given
to training geared towards providing the desired manpower structure. Hungary. had encountered severe problems where training was of a type tlmt could not be used in’ the jobs available.
"o
¯ Mr Marczewski referred to the prob~ib’:lity that the wage rate was inelastic with respect to the supply of labour b~ause of the close con-nections with the U.K. economy. He enquired whether this was making for
substitution of capital for labour to a degree which made it impossible to provide
i
I
I
A Me have accepted this criticism,
modified the tex% accordingly.
I
I
I
|"
I
I
I
I
I
i
I
I
full employment, lie also felt that the educational system was il!-adapted to the needs of full employment.
. Mr Jaroslav Kmx of the Federal Statistical Office of Czechoslovaki.a raised the questiou as to why there was a c]osc correlation between unemploymenL and emigl-ation, since he undcrsLood that unemploy-ment. primarily arose in unskilled occupations whercas emigration consisted mainly of the skilled. Dr Geary e~,,~plained to him that although there was
some brain drain of skilled people from Ireland, the bull{ of emigrants were unskilled.
.’r ’
.o
¯ .t
g . o..
p.
¯ ¯ ...
° ¯
° , . ¯ o
o
¯ . . . ° ¯ ¯
.%
o~.

![’lITable 3.1][Table 3, 2]](https://thumb-us.123doks.com/thumbv2/123dok_us/8807995.917289/111.595.6.521.23.815/litable-table.webp)