What Determines the Location Choice of R&D Activities by
Multinational Firms?
Iulia Siedschlaga,b,*, Donal Smithc,d, Camelia Turcue, Xiaoheng Zhanga,b
a
TheEconomic and Social Research Institute, Dublin, Whitaker Square, Sir John Rogerson’s Quay, Dublin 2, Ireland
b
Department of Economics, Trinity College Dublin, Ireland c
Department of Finance, Government Buildings, Upper Merrion Street, Dublin 2, Ireland
d
Department of Economcs and Related Studies, University of York, York, United Kingdom
e
University of Orléans, Rue de Blois, BP 6739, 45067 Orléans Cedex 2, France
* Corresponding author: iulia.siedschlag@esri.ie Tel. +353-1-8632116
Abstract
We analyse 446 location decisions of R&D activities by multinational firms incorporated in the European Union over 1999-2006. Our results suggest that on average, the location probability of a representative R&D foreign affiliate increased with agglomeration economies from foreign R&D activities, human capital, proximity to centres of research excellence and the research and innovation capacity of the region. Further, our evidence suggests that in comparison to European multinational firms, the effects of patents intensity and proximity to centres of research excellence were stronger in the case of North American multinational firms. While government R&D expenditure intensity increased the probability of location of R&D activities by European multinational firms in the region, it did not have a significant effect on the probability of location of R&D activities by North American multinational firms.
JEL classification: F23; O32; R38
1 Introduction
There has been a growing internationalisation of enterprise R&D activities over the
last two decades. Multinational enterprises (MNEs) are the main drivers of this
growing internationalisation of enterprise R&D and in many countries foreign
affiliates carry out more R&D than domestic firms (OECD, 2007; Abramovsky et al.,
2008). While traditional cross-border R&D enterprise activities have tended to locate
in developed economies, an increasing amount of R&D outward investment in recent
years has gone to emerging economies (OECD, 2007; European Commission, 2008;
Sachwald, 2008). The type and motivations of R&D investment vary depending on
whether R&D activities by multinationals were located in developed or emerging
economies (Thursby and Thursby, 2006; Shimizutani and Todo, 2008; Sachwald,
2008).
In recent years, the speed and extent of the internationalisation of R&D have
increased (von Zedtwitz and Gassmann, 2002; UNCTAD, 2005; Abramovsky et al.,
2008). This increased mobility of R&D and innovation activities has been linked to
increased global competition, technological change, in particular the use of
information and communication technologies (ICT) and the availability and costs of
skills (Abramovsky et al., 2008, OECD, 2008). In addition to the traditional role of
R&D foreign investment in diffusing technology (demand-driven) related to adapting
products and services to local market conditions and supporting MNEs local
manufacturing operations, R&D foreign investment is being increasingly motivated
by tapping into worldwide centres of knowledge (supply-driven) as part of firms
strategies to source innovation globally (Wortmann, 1990; Hakanson and Nobel,
Sierra, 2002; Iwasa and Odagiri, 2004; von Zedwitz and Gassmann, 2002; Ambos,
2005; Abramovsky et al. 2008; OECD, 2008).
Over the period 1995-2005, the share of foreign affiliates in total business R&D
expenditure has increased substantially in almost all European Union’s countries
(European Commission, 2008). In 2005, this share was over 70 per cent in Ireland,
over 50 per cent in Belgium and the Czech Republic, over 40 per cent in Austria and
Sweden. In contrast, the share of R&D expenditure by foreign affiliates was lower,
less than 25 per cent in Slovakia and Finland. The European Union (EU) is the
largest recipient of R&D investment by US multinationals. In 2005, the EU accounted
for 62.5 per cent of the R&D expenditure of affiliates of US parent companies abroad.
Abramovsky et al. (2008) show that in comparison to 1990, over the period
2000-2004, the average level of innovative activity of multinational firms from EU
countries located abroad grew faster than their innovative activity conducted in the
home country. This dynamics has lead to a growing share of the innovative activity
located abroad in the total innovative activity of multinational firms.
This increasing internationalisation of R&D activity in the EU raises a number of
questions which are interesting and relevant for both research and policy making:
Where are the R&D activities of multinational enterprises located? Who are the main
foreign investors in R&D activity? What factors drive the location choice of
multinational R&D activity?
To answer these questions, we analyse the determinants of the location choice of
R&D activities by multinational firms across regions in the European Union. By
considering regions as location choices we account for heterogeneity of locations
averages in cross-country analyses. We use a large firm-level data set1 which enables
us to consider a wide range of location choices of R&D activities by multinational
firms. Specifically, we analyse the location choice of R&D activities of 446 new
foreign affiliates incorporated in the European Union over the 1999-2006 period. The
large number of location choices (233 regions) enables us to obtain robust estimates
of determinants of the attractiveness of regions to foreign investment in R&D
activity.2
The traditional theory of multinational firms has modelled the location decision of
multinational firms assuming that R&D activity is located where production takes
place and it has not addressed specifically the case of the location choice of R&D
activities by multinational firms.3 Notable exceptions are Markusen (2002) and
Ekholm and Hakkala (2007). These latter theoretical contributions allow the
geographical separation of knowledge-based (R&D) activities and production
facilities in a two-country general equilibrium setup. The theoretical model proposed
by Markusen (2002) known as the “knowledge capital model” of multinationals firms
predicts that when trade costs are low, international production is likely to locate in
large economies while knowledge-intensive activities will concentrate in small
skills-intensive economies. The model developed by Ekholm and Hakkala (2007) allows
agglomeration forces to arise in both production and R&D activities and predicts that
international production will locate in a larger economy while R&D activities by
multinationals will locate in a smaller economy to benefit from R&D spillovers.
1 The Amadeus data set provided by Bureau van Dijk contains information on over 18 million firms
located in 43 countries in Europe. We discuss in more detail our data in Section 3.
2 Data on regions is taken from the Regio data set of the Eurostat and the European Regional Database
provided by Cambridge Econometrics. We discuss in more detail these data in Section 3.
In contrast to the slow development of the theoretical literature on the location choice
of R&D activities by multinational firms, a growing number of empirical studies have
analysed the internationalisation of R&D and the development of R&D global
networks (Florida and Kenney, 1994; Patel and Vega, 1999; Frost, 2001; Ambos,
2005; Abramosvsky et al. 2008; Sachwald, 2008).
Given that multinational enterprises are concentrated in R&D-intensive industries,
many factors driving the location choice of foreign affiliates are also relevant and
important in the case of R&D activities of multinationals. However, as documented in
a number of recent studies in international business, in addition to demand-side
factors, such as market access, factors specific to the R&D sector such as knowledge-
sourcing have become increasingly important as a motivation for establishing R&D
units abroad (Florida, 1997; Patel and Vega, 1999; Frost, 2001; Le Bas and Sierra,
2002; von Zedtwitz and Gassmann, 2002; Ambos, 2005; Ito and Wakasugi, 2007;
Belderbos et al. 2008). Most existing studies analyse determinants of the location
choice of foreign R&D in a single country setup. Cantwell and Iammarino (2000)
analyse the location patterns of multinational networks for innovation in the UK
regions. Frost (2001) examines the origin of external sources of innovation of US
greenfield subsidiaries. Ito and Wakasugi (2007) and Shimizutani and Todo (2008)
investigate determinants of Japanese R&D investments abroad and Iwasa and Odagiri
(2004) analyse determinants of Japanese R&D investment in the US. Ambos (2005)
analyses motivations of German-owned multinational enterprises with international
R&D activities.
This paper builds on and extends these two strands of literature, namely the existing
theoretical and empirical literatures, on international trade and investment on one
hand. We add to the empirical literature on the location choice of multinational
enterprises in three ways. First, in contrast with most existing empirical studies
mentioned above which consider both demand-driven (market access) and
supply-driven (knowledge sourcing) motivations for foreign direct investment in R&D in a
single country setup, we estimate location choice models in a multi-country setup.
Second, in contrast to existing cross-country analyses, we account for heterogeneity
of locations within countries and avoid aggregation bias in the estimates of the
location choice determinants. Third, in contrast to previous studies, we use an
improved econometric methodology to account for spatial correlation among location
alternatives and firms due to unobserved location-specific characteristics.
Our results suggest that on average, the probability to locate in an EU region
increased with agglomeration economies from foreign R&D activities, human capital,
proximity to centres of research excellence and the research and innovation capacity
of regions. There is also evidence of a geographical structure in the location choice of
R&D multinational firms across the European Union. Further, our evidence suggests
that in comparison to European multinational firms, the effects of patents intensity
and proximity to centres of research excellence were stronger in the case of North
American multinational firms. While government R&D expenditure intensity
increased the probability of location of R&D activities by European multinational
firms it had no significant effect on the location of R&D activities by North American
multinational firms.
The remainder of this paper is organised as follows. Section 2 describes the empirical
methodology and testable hypotheses. Section 3 presents our data and summary
statistics. The results of our econometric analysis are presented in Section 4. Finally
2 Empirical Methodology
2.1 Modelling Location Choice
The background for our analytical framework is the literature on the behaviour of
multinational firms (Dunning, 1977, 1981; Cantwell, 1994; Krugman, 1991;
Horstmann and Markusen, 1992; Markusen, 1995). This literature models a
multinational firm’s location decision as part of a three-step decision-making process
which starts with the firm’s decision to serve a foreign market and follows with the
choice to undertake foreign direct investment and the location choice. This analytical
convention is discussed in more details by Devereux and Griffith (1998), Head and
Mayer (2004) and Basile et al. (2008). In the first stage, a firm decides whether to
enter a foreign market. Following the decision to enter foreign markets, the next step
is the choice on whether to enter foreign markets by exporting or by foreign direct
investment. If foreign direct investment is the chosen option to enter foreign markets,
the firm decides where to locate. Devereux and Griffith (1998) model the location
choice of multinational firms as well as the options of not serving the foreign markets
and of exporting as a mode to enter a foreign market. Head and Mayer (2004) and
Basile et al. (2008) focus on the determinants of the location choice of international
production by multinational firms.
In this paper, we focus on the last step of this process and use two discrete choice
models to analyse the determinants of the location choice of R&D activities by
multinational firms. First, we estimate a conditional logit model following McFadden
(1974) which we use as a benchmark for our analysis. This model has been widely
used for spatial choice analysis as it allows the modelling of a decision with more
than two discrete outcomes (Haynes and Fotheingham 1990). This random utility
each decision maker i=1,...I for vectors of observed attributes (McFadden 1974).
For each firm i the utility from locating in a given region j depends on a deterministic
component Xij which is a function of the observed characteristics and some
unobservable factors which are captured by a stochastic term εij:
(1) Uij = Xij′β ε+ ij
The probability that a firm i chooses to start up a plant in a region j as opposed to any
other region k is then equal to the probability of Uij being the largest of all
iJ
i U
U1,..., (Heiss 2002).
To estimate equation (1) an assumption must be made about the joint probability
distribution of the unknown stochastic utilitiesεij. As shown by McFadden (1974)
under the assumption of independently and identically distributed (IID) error terms
with type 1 extreme value (Gumbel) distribution, the probability of choosing a
location h is:
(2)
∑
= == J
j X X
ij ih
e e J
h y P
1
) ,..., 1 | (
β β
The IID assumption on the error terms implies a statistical property in the conditional
logit model, the independence of irrelevant alternatives (IIA). This property states that
the relative probability ratio (the odds ratio) of any alternative being chosen over
another alternative is independent of the size and composition of the choice set of
alternatives. With IID, the error terms cannot contain any alternative-specific
information and so adding a new alternative cannot alter existing relationships
between pairs of alternatives. This assumption thus constrains the ratios to be constant
alternatives as for the odds ratio to remain constant as alternatives are added and
removed from the choice set, the individual choice probability of the remaining
alternatives will have to change by the same amount (Hunt 2004). If the model’s IIA
property is violated, this will lead to biased parameter estimates. As discussed in
Haynes and Fotheingham (1990), the equal substitution pattern implied by the IIA
property is unlikely to hold in a spatial choice framework due to location-specific
characteristics of size, aggregation, dimensionality, continuity and variation. These
characteristics may yield alternatives spatially correlated in unobservable factors and
so estimates will be biased.
To account for this, a nested logit model is used. The nested structure is created by
grouping the alternative locations choices into nests chosen according to the degree of
similarity and so correlation between the alternatives (Basile et al 2003). Therefore in
the location choice model, the nests consist of regions with similar characteristics,
hence correlation is allowed within but not across nests. The structure allows the
independence of irrelevant alternatives (IIA) property to hold within nests but not
across nests.
Following Heiss (2002), let the error term to follow a generalised extreme value
distribution. Denote τk = 1−ρk , where ρk is the correlation of alternatives in nest
k, thus τk, the inclusive value (IV) parameter, measures the independence of
alternatives in nest k. If τ =k 1, the alternatives are perfectly independent of each
other and so there the nested structure is not required. At this value of the IV
parameter the nested model collapses into the conditional logit model. If τ =k 0,
becomes the alternative. One can further write the log sum of utilities generated from
alternatives in nest k as follows:
(3) ln exp( / )
k
k ih k
j n
IV U τ
∈
=
∑
,IVk is the inclusive value of nest k (denoted by nk). Therefore, τk is the IV parameter
of nk. The probability function of alternative h in nest k being chosen is the product
of the probability of choosing nest k (Pr( )k ) and the conditional probability of
choosing h given that k is chosen (Pr( | )h k ). The function can be expressed as
follows:
(4) Pr( | 1,..., ) Pr( | ) Pr( ) exp( / ) exp( )
exp( ) exp( )
h h h h
h K k k
U IV
y h J h k k
IV IV
τ τ
τ
= = =
∑
,where τh and IVh are the IV parameter and the inclusive value for the nest where
alternative h is in.
The choice of possible nested structures is multiple and there is no systematic way to
identify a best structure amongst all possible nests (Greene and Hensher 2002).
However, for the nested model to be consistent with the Random Utility
Maximisation (RUM) framework - the IV parameter τks has to be bounded between 0
and 1 (Heiss 2002).
2.2 Testable Hypotheses and Model Specifications
The dependent variable (yij) is the location choice of each R&D activity of a new
foreign affiliate over 233 possible locations.4 Specifically, the dependent variable is a
4
binary variable equal to one if firm i located in region j over the period 1999 to 2006
and zero for all regions different from j.
...
.... .
1
.
,
0
ij ik ij
if j k
y
otherwise
π >π ∀ ≠
=
ij
π is the expected profit for firm i in region j. Since πij is not observed we estimate
it as a function of variables that are likely to influence it.
Each firm’s location decision is explained as being a function of regional
characteristics as well as policy variables at national level. The empirical analysis of
the location choice of multinational enterprise activity distinguishes between
horizontal and vertical motivations of foreign direct investment (Mayer et al. 2007).
Horizontal motivations are driven by market access and market potential of an area
and affect the revenue component of the profit function. Vertical motivations are
concerned with the firms’ cost, locating the firm and its affiliates in regions that will
minimize the cost element of the profit function. The literature on the
internationalisation of R&D suggests that knowledge-sourcing has become an
important motivation for establishing R&D activities abroad (Florida, 1997; Frost,
2001; von Zedtwitz and Gassmann, 2002; Ambos, 2005; Ito and Wakasugi, 2007;
Belderbos et al., 2008). The importance of various motivations for the location of
R&D activities as well as the type of investment vary depending on whether those
locations were in developed or emerging economies. Thursby and Thursby (2006)
document on the basis of the results of a survey of over 200 multinationals across 15
industries that the most important motivations for the location choice of R&D
activities by multinationals in the advanced economies were the quality of R&D
personnel, the quality of intellectual property protection and the ease of collaborating
and the cost of research were the most important motivations in the case of locating
R&D activities in emerging economies. Shimizutani and Todo (2008) distinguish
between research and development/design activities of Japanese subsidiaries abroad
and find that while both research and development/design activities are performed in
advanced economies, in emerging economies most of R&D activities by Japanese
multinationals are development/design activities. Further, while R&D expenditure
intensity had a positive impact on the location of research activities, the
knowledge-intensity of the parent firm had a positive effect on the location choice of
development/design activities. It appears that while advanced knowledge-sourcing
from the host country is the primary objective of research activities, adapting products
and technology to local conditions drives the location of development/design
activities by multinational firms.
For horizontal motivations, the location and demand size of the final consumer market
are important (Krugman, 1980). This is important in the case of R&D activities as by
far the most common form of overseas R&D facility is the support laboratory. The
purpose of these facilities is to adapt technologies and products to local markets and
also provide technical backup for local manufacturing and sales (Dicken 2004;
Shimitzutani and Todo, 2008). However, as shown by Motta (1992) and Neary (2002)
this relationship between market size and foreign direct investment is not monotonic
as market size also affects the number and so competition between firms.
Following Harris (1954), we measure market potential of each host region by GDP in
that region and a distance-weighted sum of GDP in all other regions5. In theory, the
effect of market potential on the probability to locate in a region is ambiguous.
5
Agglomeration economies from foreign R&D activities are likely to be of particular
importance as R&D activities are characterised by the need to assemble a diverse and
skilled network of workers, sophisticated infrastructure and also uncertainty
surrounding outcomes. This leads to a need to concentrate activities (Dicken 2004).
This effect can be negative as agglomeration diseconomies, due to resources such as
labour being bid up in the region (Head et al. 1999). Firm-specific agglomeration
occurs as it reduces the uncertainty of operating in a region and so reduces the risk of
new investments.6 To account for this spatial dependence, we measure agglomeration
by the number of R&D foreign affiliates in the same region plus a distance-weighted7
measure taking into account foreign-owned R&D firms located in all other regions.
Firms are counted at the beginning of the period to mitigate endogeneity problems.
As pointed out by Head and Mayer (2004), counts of multinational firms also proxy
the unobserved attractiveness of regions to foreign direct investment and thus
alleviate the omitted variable bias.
As for vertical motivations, a number of factors are considered important in
determining the costs of production such as labour costs, unemployment rates (a
proxy for labour market flexibility), and taxation.
We proxy labour costs with compensation per employee in each region. The expected
effect can be positive or negative. While regions with high labour costs can indicate
the presence of highly skilled workers, regions with low labour costs would be
associated with low skills. It is thus necessary to account for human capital. We use sizes of the neighbouring regions weighted by a measure of accessibility to all regions. For a discussion of measuring market potential in modelling the location choice of multinational firms see Crozet et al. (2004) and Altomonte (2007).
6 Barry et al. (2003) provide empirical evidence showing that the presence of multinational firms in
Ireland has acted as a “demonstration effect” for the attraction of new foreign direct investment.
7
the percentage of the economically active population with tertiary education as a
proxy for human capital in a region indicating a more productive labour force. Our
theoretical prior is a positive effect of human capital on the location probability.
The effect of the unemployment rate on the location probability is ambiguous. On one
hand, as shown in efficiency wage models, unemployment reduces workers
bargaining power and increases worker effort as it increases the cost of being fired.
On the other hand, high unemployment can indicate a pool of available labour but
may also be related to labour market rigidities in a region.
Tax directly reduces the profits of firms. Devereux and Griffith (1998) show that the
effective average corporate tax rates significantly influence US multinational firms’
decision on which European country to locate in. Tax rates can also indicate a stock of
public goods and so the sign may be positive. Benassy - Quéré et al (2000) show that
firms may be willing to pay higher taxes in exchange for more public goods. To
control for the effect of taxation on the location probability of R&D activities of
multinational firms we use data on the top corporate tax rate at country level.8
A growing number of countries use R&D fiscal incentives9 to increase the level of
R&D investment. However, R&D tax incentives can foster as well as discourage
international investment. To the extent that many firms prefer to incur R&D costs
where they can be offset against higher taxes, countries with lower corporate tax rates
might be less attractive to foreign R&D investment (OECD, 2002, 2009). Hall and
van Reenen (2000) survey existing econometric evidence from country studies and
8 We use data on corporate tax rates available from the World Tax database available from the
Michigan Business School, http://www.bus.umich.edu/otpr/otpr/default.asp
9 Among OECD countries, 26 governments use R&D fiscal incentives to promote business R&D
conclude that R&D investment is responsive to R&D tax credits. Bloom et al (2002)
analyse a panel data on tax changes and R&D expenditure in nine OECD countries
over the period 1979-1997 and find that on average, R&D tax credits had a significant
positive effect on the level of R&D investment in the short-run as well as in the
long-run. While controlling for the tax treatment of R&D is desirable, for the purpose of
this paper, data on R&D tax incentives is not available for a sufficient number of
countries and years.10
The literature on the internationalisation of R&D (Wortmann, 1990; Hakanson and
Nobel, 1993; Almeida, 1996; Daniels and Lever 1996; Florida 1997; Patel and Vega,
1999; Cantwell and Iammarino, 2000; Kumar, 2001; Le Bas and Sierra, 2002; von
Zedtwitz and Gassmann 2002; Dicken 2004; Iwasa and Odagiri, 2004; Ambos, 2005;
Ito and Wakasugi, 2007; OECD 2008) points to access to a strong knowledge base as
a factor driving foreign investment in the R&D sector. To test this effect on the
location choice of R&D activities by multinational firms, we proxy the knowledge
base of regions by patent intensity, calculated for each region as the number of patent
applications to the European Patent Office per GDP.11 Patents have been extensively
used to measure innovation output and the technology capacity of regions and
countries (Jaffe et al., 1993; Almeida, 1996; Cantwell and Iammarino, 2000; Frost,
2001; Iwasa and Odagiri, 2004; Abramovsky et al., 2008). However, not all firms use
patents in their innovation strategy. In addition, patents measure inventions while
innovation activity is broader than inventions. Therefore, alternatively we use R&D
10 Data on the rate of R&D tax subsidies over the period 1990-2008 are available from the OECD
(2007, 2009) for 12 of the 21 European Union countries analysed in this paper.
11
expenditure intensity, which has been also extensively used to proxy innovation
activity and the level of technological development (Kumar, 2001; Shimituzani and
Todo, 2008). Specifically, we use three measures of R&D expenditure intensity: total
R&D expenditure, business R&D expenditure and government R&D expenditure as a
percentage of regional GDP. Our theoretical prior is a positive link between the
innovation and technological capacity of the region measured alternatively by patent
intensity and R&D expenditure intensity and the location probability of R&D
activities by multinational firms.
Florida and Kenney (1994) have shown that an important number of Japanese R&D
subsidiaries in the US are located near major research centres to access new sources
of scientific and technological excellence. Abramovsky et al (2007) find that
foreign-owned R&D labs are located in the proximity of centres of university research
excellence in the UK. Universities provide firms with access to high quality
researchers for basic scientific research. Location close to universities indicates that
R&D firms are engaging in a higher level of research than a basic production support
function and are engaging in global market orientated R&D (Dicken 2004). Thursby
and Thursby (2006) document the growing role of universities in global innovation
systems. This result comes out from a survey of over 200 multinational firms on the
factors that influence the decisions on the location of R&D. Proximity to universities
ranks higher than costs factors in developed countries and it is as important as cost
factors in emerging economies. To capture the effect of proximity to centres of
research excellence, we include a dummy variable which is equal to one if a region
has at least one university ranked in the top 500 ranked universities12. We test the
12 We use the QS World University Ranking published annually available from
hypothesis that the presence of a top ranked university in the region is positively
associated with the location choice of R&D foreign affiliates.
In this paper we focus on long-term determinants of the location choice of new R&D
foreign affiliates and we do not consider firms decisions to exit markets. In the latter
case, an analysis using panel data would be more suitable.13
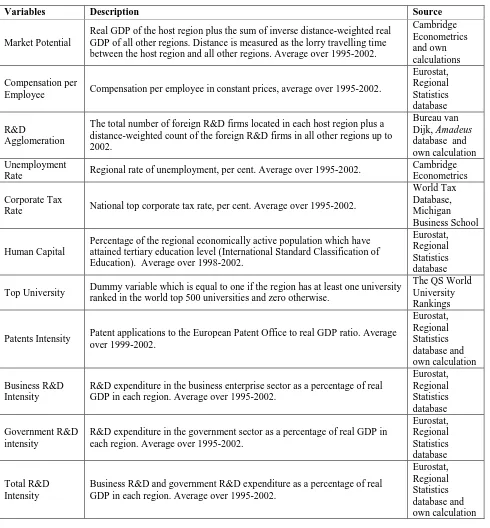
Explanatory variables are lagged with respect to the dependent variable to account for
the fact that investment decisions are lagged in time and to avoid possible
endogeneity. Detailed variables definitions and data sources are given in Table A1 in
the Appendix.
3 Data and Summary Statistics
The firm-level data used in this analysis is taken from the Amadeus database provided
by Bureau van Dijk14, which contains information on over 18 million firms located in
43 European countries. By using data over the period 1999-2006 on ownership,
location, incorporation date and industry affiliation, we identify 446 newly established
R&D activities by multinational firms in EU regions. A firm is defined as
foreign-owned if it had one foreign shareholder with at least 10 per cent of voting share in it.
This definition is in line with the IMF’s definition of “foreign direct investment
enterprise” (IMF 1993). Thus, we identify 3,5 million foreign affiliates which fulfil
this definition. We extract data on R&D activities by multinational firms from the
database according to NACE Rev. 1.1 codes15. R&D activities are classified as K73.
13 Becker et al (2005) discuss this point.
14 Information about the Amadeus database is available from
http://bvdinfo.com/Products/Company-Information/International/AMADEUS.aspx
The identified 446 new R&D activities by multinational firms over the period
1999-2006 are located in 233 regions16 in 21 EU countries.17 The location choice is
analysed at regional level as multinational firms consider both country and region
characteristics in their decision. Regional data are taken from the Eurostat and the
European Regional Database provided by Cambridge Econometrics.18
Table 1 about here
Table 1 presents descriptive statistics of the locations of new R&D activities by
multinational firms over the analysed period, 1999-2006. Columns one and two show
the top ten countries chosen as location of the new R&D foreign affiliates. Regions in
the United Kingdom and Germany attracted the bulk of foreign investment in R&D,
approximately 72 per cent of the total number of R&D foreign investments. Six per
cent of the new firms chose regions in the new EU countries. Column three shows the
top ten countries after the number of new R&D foreign investments per GDP.
Romania attracted the largest number of R&D foreign affiliates relative to its
economic size. Column four shows that Inner London attracted the largest number of
new R&D foreign affiliates.
Table 2 provides summary statistics of the origins of the firms in our sample by broad
geographical classification. 50.9 per cent of the firms in the sample originate from one
16 Regions classified as NUTS 2 regions. NUTS stands for “the Nomenclature of Territorial Units for
Statistics”, which is a geographic coding system developed by the EU to reference administrative regions within its countries. A detailed description of the regions classified as NUTS 2 is available from Eurostat (2007)
http://epp.eurostat.ec.europa.eu/cache/ITY_OFFPUB/KS-RA-07-020/EN/KS-RA-07-020-EN.PDF
17 Austria, Belgium, the Czech Republic, Denmark, Estonia, Finland, France, Germany, Greece,
Ireland, Italy, Latvia, Lithuania, the Netherlands, Poland, Portugal, Romania, the Slovak Republic, Spain, Sweden, the United Kingdom.
18
Eurostat’s database containing regional statistics is available from
http://epp.eurostat.ec.europa.eu/portal/page/portal/region_cities/regional_statistics/data/database
Information about Cambridge Econometrics is available from http://www.camecon.com
of the EU-15 countries19, Switzerland or Norway. As for individual countries the top
origin country is the United States accounting for 30.7 per cent followed by
Switzerland with 9.6 per cent of the number of new R&D foreign affiliates.
Table 3 presents summary statistics of the explanatory variables used in our empirical
analysis.
Table 3 about here
Regional characteristics vary in particular with respect to agglomeration economies
from foreign R&D activities, human capital and compensation per employee. Table 4
shows pair-wise correlations among all explanatory variables.
Table 4 about here
Total R&D expenditure intensity is highly correlated with business R&D expenditure
intensity (0.9678) which indicates a high share of business R&D expenditure in total
R&D expenditure. Patents intensity appear correlated with business R&D expenditure
intensity (0.6585) and with total R&D expenditure intensity (0.6447). To account for
these high correlations we will use patents intensity and R&D expenditure intensity in
separate regressions. We also check the sensitivity of our estimates to potential bias
from high correlations between market potential and compensation per employee
(0.5910), market potential and patents intensity (0.5931), compensation per employee
and patents intensity (0.5128).
19
4 Econometric Results
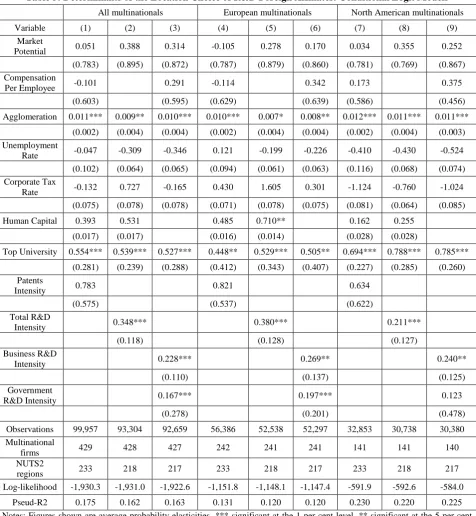
4.1 Conditional Logit Models
Table 5 shows the estimates of the conditional logit models. The first three columns
show the results obtained for newly established R&D activities by all multinational
firms over all regions. The first column shows the model with patent intensity as a
proxy for the innovation capacity of regions. Column two shows the estimates
obtained without compensation per employee and patent intensity which appear
correlated with market potential. In this case we use total R&D intensity to proxy the
innovation capacity of regions. In column three we use compensation per employee as
a proxy for human capital and use business and government R&D expenditure
intensity to proxy the knowledge base of regions. The figures reported are the average
probability elasticities (APE).20 The reported standard errors are clustered at
country-level. 21
Table 5 about here
It appears that on average, other things equal, the probability to locate R&D activities
of foreign affiliates across regions in the EU was associated positively with
agglomeration economies from foreign R&D activities. This result indicates that the
benefits of clustering R&D activity outweigh any local competition effects. This
variable is also an indicator of positive unobserved characteristics in a region as when
multinational firms locate in a region it can be taken as a signal by other firms of
20
The APEs in the conditional logit models for market potential, compensation per employee,
agglomeration and patent intensities are obtained as follows: ex x(1 1) J
β
= − where βx is the
estimated parameter for x and J is the number of regions in the choice set. APEs for unemployment rates, corporate tax rate, human capital and R&D expenditure intensities are evaluated at their mean value. The marginal effect for top university implies the change in the location probability in the case of a region having an university ranked in the world top 500 universities.
21 Following Moulton (1990) and Pepper (2002), in the estimated models we cluster standard errors at
favourable characteristics. Furthermore, this result suggests that agglomeration effects
are important over and above the spatial concentration of R&D activity generated by
demand-linkages (Head and Mayer, 2004) and are in line with the theoretical
predictions of the model developed by Eckholm and Hakkala (2007). The location
probability of foreign R&D activities increases with the presence of a top university
in the region, as well as the region’s R&D expenditure intensity. The effect of
business R&D expenditure intensity appears stronger in comparison to the effect of
government R&D expenditure intensity. The effect of the regional unemployment rate
is negative but insignificant indicating that the availability of labour or the presence of
labour market rigidities do not affect the attractiveness of regions to R&D foreign
affiliates.
The tax variable is not significant across all specifications. This result suggests that
the corporate tax rate in a country has no significant effect on the location of R&D
activities by multinationals in regions of that country over and above other
determinants of the location choice. Basile et al. (2008) and Spies (2010) also find an
insignificant effect of the corporate tax on the location choice of multinational firms.
Regional average compensation per employee and human capital appear also
insignificant. These results are consistent with Devereux and Griffith (1998).
The baseline model was estimated across all regions and firms. However it is possible
that heterogeneity among firms in the treatment of regional characteristics exists and
so firms may weigh regional characteristics differently. This difference in firm
behaviour will not be seen when they are grouped together. To examine this
possibility, the sample of foreign affiliates is divided by country of origin and we
separately.22 Columns 4-6 contain the estimates for European multinational firms
while columns 7-9 show the estimates for North American firms.23
Agglomeration spillovers from foreign R&D activities, the presence of a top ranked
university, total R&D expenditure intensity and business R&D expenditure intensity
were the main determinants of the location of R&D activities by European as well as
North American multinationals. The effects of agglomeration economies and
proximity to centres of research excellence were stronger in the case of North
American multinational firms. While government R&D expenditure intensity was
associated positively and significantly with the location probability of R&D activities
by European multinationals, it did not play an important role in the case of the North
American multinationals.
4.2 Nested Logit Models
As discussed in Section 2, estimating unbiased parameters with the conditional logit
model assumes that the IIA property holds. However, given potential spatial
correlation in unobservable factors, the alternative locations are unlikely to be
independent in a spatial choice framework. This implies that the IIA assumption may
not hold which would lead to biased estimates. We therefore test a number of
geographical structures to estimate nested logit models. We find that a country-based
structure was inconsistent with random utility maximization. Further, we identify a
model with a four-group nesting structure to be the most successful: South,
Anglo-Saxon, East and Central-North. The composition of this nesting structure is as
22 European multinational firms are those with a parent in the following countries: Austria, Belgium,
Bulgaria, Cyprus, Czech-Republic, Germany, Denmark, Spain, Finland, France, United Kingdom, Gibraltar, Greece, Ireland, Israel, Isle of Man, Italy, Liechtenstein, Luxembourg, Switzerland, Monaco, Netherlands, Norway, Poland, Portugal, Sweden. North American multinational firms are those with a parent in the US and Canada.
23 Data on industrial sectors and technology fields of the R&D activities is not available to us. Also,
follows: South: all NUTS 2 regions in Italy, Greece, Portugal and Spain;
Anglo-Saxon: all NUTS 2 regions in the United Kingdom and Ireland; East: all NUTS 2
regions in the Czech Republic, Estonia, Hungary, Lithuania, Latvia, Poland, Romania,
and the Slovak Republic; Central and North: all NUTS 2 regions in Austria, Belgium,
Denmark, Finland, France, Germany, the Netherlands and Sweden. The results from
the nested logit models using this four-group geographical structure are presented in
Table 6.
Table 6 about here
The IV parameters are all between zero and one, which indicates that the chosen
geographical structure is valid and that choices are geographically nested. Across all
specifications, the IV parameters for “South” are lower in comparison to the other
three nests suggesting that the regions in “South” are perceived as more closely
substitutable than the regions within the other three nests.
The Likelihood Ratio (LR) test rejects the null hypothesis of the IIA. Columns 1-3
show the results for all multinational firms, columns 4-6 for European multinational
firms and columns 7-9 for North American multinational firms. Figures shown are
marginal effects (average probability elasticities).24 Standard errors are clustered at
country level. The average probability elasticity for market potential is positive and
significant at ten percent in the model estimated for all multinationals without
compensation per employee and patent intensity and it is not significant in the other
eight models. Agglomeration economies from foreign R&D activities appear to be
24 The average probability elasticity with respect to the variable x in the nested logit models is
calculated as follows: x[ ( nk 1) 1]
x K
j j
J
e K
L
β
τ τ
=
∑
− + − where βxis the estimated parameter ofvariable x; L is the number of regions; K is the number of nests;
k
n
J is the number of regions in the
important within the four geographical structures for all multinational firms as well as
European and North American multinationals. Furthermore, the location choice of
R&D activities by multinationals was positively associated with the knowledge base
captured by human capital25, proximity to centres of research excellence, patents
intensity as well as total R&D expenditure intensity. The effect of proximity to
centres of research excellence was stronger in the case of North American
multinational firms. While business R&D expenditure intensity mattered in the case
of European as well as North American multinationals, government R&D expenditure
intensity played an important role only in the location choice of R&D activities of
European multinationals. It appears that on average, regional characteristics such as
labour costs, unemployment rates and the country corporate tax rate did not play a
significant role in the location choice of R&D activities by multinational firms over
and above other determinants.26 These results are in line with the findings of Thursby
and Thursby (2006) who conclude that, while important, the cost of research is not a
primary factor in the location choice of R&D activities by multinational firms.
5 Summary and Conclusions
In this paper we estimated the determinants of the location choice of new R&D
activities by multinational firms across regions in the European Union over the period
1999-2006. With respect to methodology improvements, in addition to conditional
logit models we estimated nested logit models to account for the fact that in relation
to many alternative location choices, conditional logit models might lead to biased
25 In the case of the North American multinationals, human capital was positive and significant in the
case of the model with patent intensity and positive but insignificant in the model without compensation per employee and patent intensity.
26 The APE for compensation per employee is positive and marginally significant for all multinationals
estimates if the location choices are not independent. In contrast to most existing
cross-country analyses, we consider regions within countries as location choices and
thus avoid aggregation bias in the estimates of the location choice determinants.
We find that in our spatial choice framework the independence of the location choices
does not hold. Consequently we base our conclusions on the estimates of determinants
of the location choice of R&D activities by multinationals obtained with the nested
logit models. We find evidence of a geographical structure in firm’s location choice
across the European Union. Our results suggest that on average, the probability of the
location of a representative R&D foreign affiliate in an EU region increases with
agglomeration economies from foreign R&D activities and the region’s knowledge
base measured by human capital, proximity to centres of research excellence, research
and innovation capacity. It appears that, over the analysed period, regional
characteristics such as market potential, compensation per employee and
unemployment rate, had no significant effect on the attractiveness of regions to R&D
foreign investment over and above other determinants. Some of these results might be
influenced by the fact that our data does not distinguish between research and
development activities. Our evidence also suggests that country level corporate tax
rates had no significant effect in fostering the attractiveness of regions to R&D
foreign investment over and above other determinants. This result might be explained
by the fact that the sensitivity of the location probability to taxation in a
country/region is higher in the case of a small number of location options (Barrios et
al., 2008). Also, multinationals locate foreign affiliates in more than one country and
they optimize the tax on a global base. A large number of European countries have
introduced R&D tax incentives to foster investment in R&D activities. Notable
incentives can foster as well as discourage international investment. Furthermore, the
benefits to firms of R&D tax incentives are strongly linked to the overall corporate tax
rates. While it is desirable to test the effects of these R&D tax incentives on the
location choice of foreign R&D activities, for the purpose of this paper, data on R&D
tax subsidies over 1990-2008 are available for only 12 of the 21 countries analysed in
this paper.
The determinants of the location choice of R&D foreign affiliates vary depending on
the country of origin of the foreign investor. The region’s innovation capacity
measured by patents intensity and business R&D expenditure intensity as well as the
presence of centres of academic research excellence were important for the location
choice of R&D activities by European as well as North American multinationals. In
comparison to European multinational firms, the effects of patents intensity and
proximity to centres of research excellence were stronger in the case of North
American multinational firms. These results suggest that in comparison to R&D
activities by European multinationals, the location of R&D activities of North
American multinationals in EU regions were more likely to aim at
knowledge-sourcing. While government R&D expenditure intensity mattered for the location
choice of R&D activities by European multinationals, it did not play a significant role
in the case of the location decisions for R&D activities by North American
multinationals.
Our research results suggest a number of policy implications. First, policy aiming to
increase the knowledge base of regions are likely to foster the attractiveness of
regions to R&D foreign investment. Second, positive externalities from clustering of
behaviour of foreign investors, differentiated policy depending on target partner
countries can increase the success of such policies.
Acknowledgements
We thank Marius Brülhart, Davide Castellani, Jim Markusen, Laura Resmini, Marc
Schiffbauer, the Editor, Martin Bell, two anonymous referees and participants at
research presentations at the European Trade Study Group Conference in Rome, the
Economic and Social Research Institute in Dublin, the Irish Economic Association
Conference in Belfast, the International Workshop on “Internationalisation of R&D”
in Ankara, the Conference on “Internationalisation of Innovation into Emerging
Markets” in London, the European Regional Science Association Congress in
Jönköping, the French Association of Economic Sciences Congress in Paris, the
International Workshop on “Global and Local Firm Linkages” at the Institute for
Applied Economic Research, Tübingen, and the International Workshop on “Recent
Issues in Economic Geography” in Leuven for useful comments and suggestions.
Financial support from the European Union’s RTD 6th Framework Programme
(Contract no. CIT5-028818) is gratefully acknowledged.
References
Abramovsky, L., Harrison, R., Simpson, H., 2007. University research and the location of business R&D. The Economic Journal 117, 114-141.
Abramovsky, L., Griffith, R., Macartney, G., Miller, H., 2008. The location of innovative activity in Europe. The Institute for Fiscal Studies Working Paper 08/10.
Almeida, P., 1996. Knowledge sourcing by foreign multinationals: patent citations analysis in the U.S. semiconductor industry. Strategic Management Journal, Winter Special Issue 17, 155-165.
Ambos, B., 2005. Foreign direct investment in industrial research and development: a study of German MNCs. Research Policy 34, 395-410.
Barrios, S., Huizinga, H., Laeven, L., Nicodème, G., 2008. International taxation and multinational firm location decisions. CEPR WP 7047.
Barry, F., Görg, H., Strobl, E., 2003. Foreign direct investment, agglomerations, and demonstration effects: an empirical investigation. Review of World Economics 139 (4), 583-600.
Basile, R., Castellani, D., Zanfei, A., 2003. National boundaries and the location of multinational firms in Europe: a nested logit analysis. EMS Working Papers, University of Urbino.
Basile, R., Castellani, D., Zanfei, A., 2008. Location choices of multinational firms in Europe: the role of EU cohesion policy. Journal of International Economics 74 (2), 328-340.
Becker, S.O., Ekholm, K., Jäckle, R., Muendler, M.A., 2005. Location choice and employment decisions: a comparison of German and Swedish multinationals. Review of World Economics 141 (4), 693-731.
Belderbos, R., Lykogianni, E., Veugelers, R., 2008. Strategic R&D location in European manufacturing industries. Review of World Economics 144 (2), 183-206.
Bénassy-Quéré, A., Fontagné, L. Lahrèche-Rèvil, A., 2000. Foreign direct investment and the prospects for tax co-ordination in Europe, CEPII Document de travail n.2000-06.
Bloom, N. R. Griffith, J. Van Reenen, 2002. Do R&D tax credits work? Evidence from a panel of countries 1979–199 , Journal of Public Economics, 85(1), 1-31
Cantwell, J., 1994. The relationship between international trade and international production. In: Greenway, D., Winters, L. (Eds.), Surveys in International Trade. Blackwell, Oxford.
Cantwell, J., Iammarino, S., 2000. Multinational corporations and the location of technological innovation in the UK regions. Regional Studies 34 (4), 317-332.
Crozet, M., Mayer, T., Mucchielli, J.L., 2004. How do firms agglomerate? A study of FDI in France. Regional Science and Urban Economics 34, 27-54.
Brülhart, M., Crozet, M., Koenig, P., 2004. Enlargement and the EU periphery: the impact of changing market potential. The World Economy 27 (6), 853-875.
Daniels, P., Lever, W., 1996. The Global Economy in Transition. Longman, Harlow.
Devereux, M.P., Griffith, R., 1998. Taxes and the location of production: evidence from a panel of US multinationals. Journal of Public Economics 68 (3), 335-367.
Dicken, P., 2004. Webs of enterprise: the geography of transnational production networks. In: Dicken, P. (Eds.), Global Shift: Reshaping the Global Economic Map in the 21st Century. SAGE Publications, London.
Dunning, J., 1981. International Production and the Multinational Enterprise. George Allen and Unwin, London.
Ekholm, K., Hakkala, K., 2007. Location of R&D and high-tech production by vertically integrated multinationals. Economic Journal 117, 512-543.
European Commission, 2008. A More Research –Intensive and Integrated European Research Area. Science, Technology and Competitiveness Key Figures Report 2008/2009. Office for Official Publications of the European Communities, Luxembourg.
Eurostat, 2007. Regions in the European Union. Nomenclature of territorial units for statistics. NUTS 2006/EU-27. 2007 edition. Office for Official Publications of the European Communities, Luxembourg
Florida, R., Kenney, M., 1994. The globalisation of Japanese R&D: the economic geography of Japanese R&D investment in the United States. Economic Geography 70 (4), 305- 323.
Florida, R., 1997. The globalization of R&D: results of survey of foreign affiliated R&D-laboratories in the USA. Research Policy 26 (1), 85-102.
Frost, T.S., 2001. The geographic sources of foreign subsidiaries’ innovations. Strategic Management Journal 22, 101-123.
Fujita, M., Krugman, P., Venables, A., 1999. The Spatial Economy: Cities, Regions and International Trade. MIT Press, Cambridge, MA.
Greene, W., Hensher, D., 2002. Specification and estimation of the nested logit model: alternative normalisations. Transportation Research Part B 36, 1-17.
Hakanson, L., Nobel, R., 1993. Foreign research and development in Swedish multinationals. Research Policy 22, 373-396.
Hall, B., J. Van Reenen, 2000. How effective are tax incentives for R&D? A review of the evidence, Research Policy, 29(4-5), 449-469
Harris,C., 1954. The market as a factor in the localization of industry in the United States. Annals of the Association of American Geographers 64, 315-348.
Hausman, J., McFadden, D., 1984. Specification tests for the multinomial logit model. Econometrica 52 (5), 1219-1240.
Haynes, K., Fotheingham, A., 1990. The impact of space on the application of discrete choice models. Review of Regional Studies 20 (2), 39-49.
Head, K., Mayer, T., 2004. Market potential and the location of Japanese investment in the European Union. The Review of Economics and Statistics 86 (4), 959-972.
Head, K., Ries, J., Swenson, D., 1999. Attracting foreign manufacturing: investment promotion and agglomeration. Regional Science and Urban Economics 29 (2), 197-218.
Heiss, F., 2002. Structural choice analysis with nested logit models. The Stata Journal 2 (3), 227-252.
Hunt, L., Boots, B., Kanaroglou, P., 2004. Spatial choice modelling: new opportunities to incorporate space into substitution patterns. Progress in Human Geography 28, 746-764.
International Monetary Fund, 1993. Balance of Payments Manual, 5th Edition. International Monetary Fund, Washington.
Ito, B., Wakasugi, R., 2007. What factors determine the mode of overseas R&D by multinationals? Empirical evidence. Research Policy 36, 1275-1287.
Iwasa, T., Odagiri, H., 2004. Overseas R&D, knowledge sourcing, and patenting: an empirical study of Japanese R&D investment in the US. Research Policy 33, 807-828.
Jaffe, A., Trajtenberg, M., Henderson, R., 1993. Geographic localization of knowledge spillovers as evidenced by patent citations. Quarterly Journal of Economics 108 (3), 577-598.
Krugman, P., 1980. Scale economics, product differentiation and the pattern of trade. American Economic Review 70 (5), 950-959.
Krugman, P., 1991. Geography and Trade. MIT Press, Cambridge, MA.
Kumar, N., 2001. Determinants of location of overseas R&D activity of multinational enterprises: the case of US and Japanese corporations. Research Policy 30, 159-174.
Le Bas, C., Sierra, C., 2002. Location versus home country advantages in R&D activities: some further results on multinationals’ location strategies. Research Policy 31, 589-609.
Markusen, J., 1995. The boundaries of multinational enterprises and the theory of international trade. Journal of Economic Perspectives 9 (2), 169-189.
Markusen, J., 2002. Multinational firms and the theory of international trade. MIT Press, Cambridge and London.
Mayer, T., Mejean, I., Nefussi, B., 2007. The location of domestic and foreign production affiliates by French multinational firms. Centre for Economic Policy Research Discussion Paper 6308.
McFadden, D., 1974. Conditional logit analysis of qualitative choice behaviour. In: Zarembka, P. (Eds.), Frontiers in Econometrics, Chap. 4. Academic Press, New York, pp. 105–142.
McFadden, D., 1984. Econometric analysis of qualitative response models. In: Griliches, Z., Intriligator, M.D. (Eds.), Handbook of Economics Volume ΙΙ. Elsevier Science Publishers BV.
Motta, M., 1992. Multinational firms and the tariff-jumping argument: a game theoretic analysis with some unconventional conclusions. European Economic Review 36 (8), 1557-1571.
Moulton, B., 1990. An illustration of a pitfall in estimating the effects of aggregate variables on micro units. The Review of Economics and Statistics 72 (2), 334-338.
OECD, 2002. OECD Science, technology and Industry Outlook 2002. OECD, Paris
OECD, 2007. OECD Science, Technology and Industry Scoreboard 2007. OECD, Paris.
OECD, 2009. OECD Science, Technology and Industry Scoreboard 2007. OECD, Paris.
OECD, 2008. The Internationalisation of Business R&D. Evidence, Impacts and Implications. OECD, Paris.
OECD, 2011. OECD Science, Technology and Industry Scoreboard 2011. OECD, Paris
Patel, P., Vega, M., 1999. Patterns of internationalisation of corporate technology: location vs. home country advantages. Research Policy 28, 145-155.
Pepper, J., 2002. Robust inferences from random clustered samples: an application using data from the panel study of income dynamics. Economic Letters 75, 341-345.
Sachwald, F., 2008. Location choice within global innovation networks: the case of Europe. Journal of Technology Transfer 33, 364-378.
Shimizutani, S., Todo, Y., 2008. What determines overseas R&D activities? The case of Japanese multinational firms. Research Policy 37, 530-544.
Spies, J. 2010. Network and border effects: where do foreign multinationals locate in Germany?. Regional Science and Urban Economics 40, 20-32.
Thursby, J., Thursby, M., 2006. Here or there? A survey on the factors in multinational R&D location. National Academies Press, Washington D.C.
UNCTAD, 2005. World Investment Report. Transnational Corporations and the Internationalization of R&D. United Nations, Geneva.
von Zedtwitz, M., Gassmann, O., 2002. Market versus technology drive in R&D internationalization: four different patterns of managing research and development. Research Policy 31 (4), 569-588.
Table 1: The location of new R&D foreign affiliates incorporated in the EU,
1999-2006
Data source: Amadeus database, Bureau van Dijk
Table 2: Country origin of new R&D foreign affiliates incorporated
in the EU, 1999-2006
Data source: Amadeus database, Bureau van Dijk
Top ten countries after the share in the total number of R&D foreign affiliates Country share in total R&D foreign affiliates (%) Ranking of countries after the number of R&D foreign affiliates per GDP
Top ten NUTS 2 Regions after the number of R&D foreign affiliates
United Kingdom 35.9 Romania Inner London
Germany 35.9 Estonia Oberbayern
Austria
4.9
Ireland Berkshire, Buckinghamshire and Oxfordshire
France 4.3 United Kingdom East Anglia
Romania 4.0 Austria Bucuresti – Ilfov
Ireland 2.7 Bulgaria Darmstadt
Sweden 2.5 Germany Dusseldorf
Italy 2.0 Denmark Koln
Denmark 1.8 Sweden Freiburg
Netherlands 1.8 Poland Hamburg
Origin of Firms by Area % of total number of R&D foreign
affiliates
EU 15 + Switzerland & Norway 50.9
North America 33.1
Asia & Australia 8.1
Rest of Europe 3.4
South & Central America 1.6
Middle East 1.6
[image:32.595.138.458.543.683.2]Table 3: Summary Statistics
Variable
Number of NUTS2 regions
Mean Std. Dev. Min. Max.
Market Potential 233 4.3 0.5 3.0 5.1 Compensation Per
Employee 233 21.3 10.1 1.5 43.9 Agglomeration 233 14.0 34.7 0.0 371.1 Unemployment Rate 233 9.3 5.0 2.5 28.0 Corporate Tax Rate 233 33.3 3.7 18.0 39.0 Human Capital 233 23.0 10.2 2.8 53.0 Top University 233 0.5 0.5 0 1 Patents Intensity 233 3.9 3.9 0.1 26.5 Total R&D Intensity 216 1.0 1.0 0.0 4.8 Business R&D
Intensity 216 0.8 0.9 0.0 4.2 Government R&D
Table 4: Correlations of explanatory variables
Market Potential
Compensation
Per Employee Agglomeration
Unemployment Rate
Corporate Tax Rate
Human Capital Market Potential 1
Compensation
Per Employee 0.5910 1
Agglomeration 0.1635 0.1534 1 Unemployment
Rate -0.3346 -0.0994 -0.1220 1 Corporate Tax
Rate 0.0111 0.0606 -0.0828 0.1684 1
Human Capital 0.2866 0.4380 0.3046 -0.0553 -0.2853 1 Top University 0.1907 0.3669 0.1997 -0.1950 -0.0243 0.3218 Patents Intensity 0.5931 0.5128 0.1277 -0.1758 -0.2119 0.3280 Total R&D
Intensity 0.3065 0.4374 0.1272 -0.2338 -0.1641 0.4150 Business R&D
Intensity 0.2939 0.4396 0.1154 -0.2570 -0.1801 0.3823 Government
R&D Intensity 0.1668 0.1693 0.0914 0.0150 0.0115 0.2791
Top
University Patents Intensity
Total R&D Intensity
Business R&D Intensity
Government R&D Intensity Top University 1
Patents Intensity 0.3576 1 Total R&D
Intensity 0.3500 0.6447 1 Business R&D
Intensity 0.3026 0.6584 0.9678 1 Government
Table 5: Determinants of the Location Choice of R&D Foreign Affiliates: Conditional Logit Models
All multinationals European multinationals North American multinationals Variable (1) (2) (3) (4) (5) (6) (7) (8) (9)
Market
Potential 0.051 0.388 0.314 -0.105 0.278 0.170 0.034 0.355 0.252 (0.783) (0.895) (0.872) (0.787) (0.879) (0.860) (0.781) (0.769) (0.867) Compensation
Per Employee -0.101 0.291 -0.114 0.342 0.173 0.375 (0.603) (0.595) (0.629) (0.639) (0.586) (0.456) Agglomeration 0.011*** 0.009** 0.010*** 0.010*** 0.007* 0.008** 0.012*** 0.011*** 0.011***
(0.002) (0.004) (0.004) (0.002) (0.004) (0.004) (0.002) (0.004) (0.003) Unemployment
Rate -0.047 -0.309 -0.346 0.121 -0.199 -0.226 -0.410 -0.430 -0.524 (0.102) (0.064) (0.065) (0.094) (0.061) (0.063) (0.116) (0.068) (0.074) Corporate Tax
Rate -0.132 0.727 -0.165 0.430 1.605 0.301 -1.124 -0.760 -1.024 (0.075) (0.078) (0.078) (0.071) (0.078) (0.075) (0.081) (0.064) (0.085) Human Capital 0.393 0.531 0.485 0.710** 0.162 0.255
(0.017) (0.017) (0.016) (0.014) (0.028) (0.028)
Top University 0.554*** 0.539*** 0.527*** 0.448** 0.529*** 0.505** 0.694*** 0.788*** 0.785*** (0.281) (0.239) (0.288) (0.412) (0.343) (0.407) (0.227) (0.285) (0.260) Patents
Intensity 0.783 0.821 0.634 (0.575) (0.537) (0.622) Total R&D
Intensity 0.348*** 0.380*** 0.211*** (0.118) (0.128) (0.127) Business R&D
Intensity 0.228*** 0.269** 0.240** (0.110) (0.137) (0.125) Government
R&D Intensity 0.167*** 0.197*** 0.123 (0.278) (0.201) (0.478) Observations 99,957 93,304 92,659 56,386 52,538 52,297 32,853 30,738 30,380 Multinational
firms 429 428 427 242 241 241 141 141 140 NUTS2
regions 233 218 217 233 218 217 233 218 217 Log-likelihood -1,930.3 -1,931.0 -1,922.6 -1,151.8 -1,148.1 -1,147.4 -591.9 -592.6 -584.0