COST EFFECTIVE SOLUTION FOR OPTIMAL PLACEMENT
AND SIZE OF MULTIPLE STATCOM USING PARTICLE
SWARM OPTIMIZATION
1K. KUMARASAMY, 2Dr.R. RAGHAVAN
1
Assistant Professor, Department of EEE, Vel Tech High Tech, Tamil Nadu, India -600 062
2
Professor, Department of EEE, EGSP Engineering College, Tamil Nadu, India.
E-mail: [email protected], [email protected]
ABSTRACT
The optimal placement of STATic synchronous COMpensator (STATCOM) for voltage stability improvement in power system is the important optimization problem. There are so many research works are carried out in the optimal placement of STATCOM to achieve the various objectives using Particle Swarm Optimization (PSO). In conventional optimization technique the weight-age of objective functions are chosen in such a way that all the objectives values are comparable in magnitude or weight-age given is based on the importance of the objectives. In this paper a cost effective objective function has been proposed and the optimisation using PSO optimizes the location and size of STATCOM devices as economical as possible. The Objective function incorporates important system parameters, namely, voltage profile, system losses, reactive compensation and loadability. The coefficients of the system parameters in the objective function are so chosen that they reflect real time cost or penalty value. Thus the objective function proposed is a cost effective objective function. The effectiveness of the proposed objective function is tested for IEEE-30 bus test system with multiple STATCOM devices. Optimization of various parameters so as to obtain improved voltage profile, minimal total system loss, minimal reactive power transfer and maximum stability limit have been achieved using PSO. This paper provides the details of the results obtained on the IEEE-30 bus test system, using PSO for multiple STATCOM application for voltage stability improvement and establishes the effectiveness of the proposed objective function.
Keywords: FACTS, STATCOM, Particle Swarm Optimization (PSO), Stability, Loadability.
1. INTRODUCTION
In power system operation and planning, voltage stability has become one of the main concerns to maintain system security. The modern power systems are facing increased power flow due to increasing demand and are difficult to control. Today, most power systems are operating near their steady-state stability limits, which may result in voltage instability. The rapid development of fast acting and self commutated power electronics converters, well known as FACTS controllers, introduced in 1988 by Hingorani [1] are useful in taking fast control actions to ensure security of power systems.
However, the operator can use various control devices like on load tap changers, generator excitations, Switchable Var Compensators (SVC) and also FACTS controllers like STATCOM, UPFC and IPFC to restore the system to normal conditions. These control variables are optimized
for the purpose of improving voltage profile of the system.
In their paper H. Omidi et.al [2] presented a technique to improve voltage stability margin of power system in contingency condition based on reactive power generation management of shunt capacitors along with active and reactive power generation management of each unit. B. Chang et.al [3] presented a procedure for application schemes for a coordinated control system of multiple FACTS controllers to enhance the voltage stability.
Effect of STATCOM, TCSC, SSSC and UPFC on static voltage stability in power systems has been studied in detail and reported in [4]. UPFC and STATCOM give slightly higher Maximum Loading Point and better voltage profiles compared to TCSC and SSSC. The effectiveness of the STATCOM to control the power system voltage was presented in [5]. M. A. Abids et al. [6] in their
paper summarized the details of various
ISSN: 1992-8645 www.jatit.org E-ISSN: 1817-3195
about 119 papers presented in the field of power system stability using STATCOM during 1990 to 2004.
Simple heuristic approaches are
traditionally applied for determining the location of FACTS devices in a small power system. However, more scientific and sophisticated methods are required for placing and sizing of FACTS devices in a larger power network [7].
Genetic algorithms have been successfully applied by Jong-Young Parkto etal [8] to determine optimal numbers and locations for capacitor installation in distribution system.
Particle Swarm Optimization (PSO) has been a powerful tool for power system optimization problems as early as 1995 [9]. The PSO mimics the behaviors of individuals in a swarm to maximize the survival of the species. In PSO, each individual decides based on its own experience Pbest as well as other individual’s experiences Gbest [10], [11].
Hirotaka Yeshida etal. [12] proposed a method to expand the original PSO to handle a mixed-integer nonlinear optimization problem (MINLP) and determine an on-line Volt/Var Control (VVC) strategy with continuous and discrete control variables.
Rashed et.al [13] present the application of Genetic Algorithm (GA) and Particle Swarm Optimization (PSO) techniques for finding out the optimal number, the optimal locations, and the optimal parameter settings of multiple Thyristor Controlled Series Compensator (TCSC) devices to achieve a maximum system loadability in the system with minimum installation cost of these devices.
Sakthivel et.al [14] proposes a PSO based optimal reactive power reserve management task incorporating only one type of FACTS device. Y. del Valle et.al [15-7] used PSO for optimal placement and sizing of STATCOM to improve just the voltage profile of buses.
Nasr Azadani et.al [16-17] proposed an approach for optimal placement of STATCOM by PSO in order to improve voltage profile, minimizing power system total losses and maximizing system loadability with respect to the size of STATCOM. The loadability limit (λ) is improved by STATCOM.
This paper is mainly concerned with the improvement of voltage stability by optimal sizing and allocation of a multiple STATCOM using PSO. The main feature of the proposed algorithm is, the fitness function or objective function of algorithm has included the cost of real power and STATCOM device. The cost effective results of the multiple
STATCOM are compared with results with conventional method. PV curve of weak buses are taken for analysing the voltage maintenance under different load conditions (for different values of λ).
2. PARTICLE SWARM OPTIMIZATION
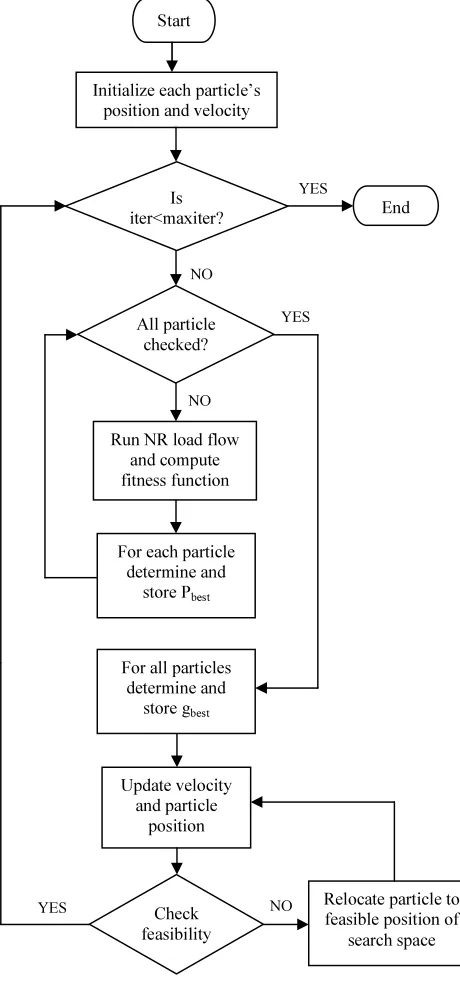
Particle swarm optimization is a novel optimization method developed by Kennedy and Eberhart [18]. It is a multi-agent search technique which traces its evolution to the emergent motion of a flock of birds searching for food. It uses a number of particles that constitute a swarm. Each particle traverses the search space looking for the global minimum (or maximum). At each iteration, each particle’s position is evaluated according to a predefined fitness function. Then the particle’s velocities are stochastically adjusted considering the historical best position of each particle itself and the neighborhood best position
The update of the particles is
accomplished by the following equation (1) which calculates a new velocity for each particle (potential
solution) based on its previous velocity (
v
id), theparticle's location at which the best fitness so far has been achieved (pbestid), and the population
global location (gbestid) at which the best fitness so
far has been achieved. Equation (2) updates each particle’s position in the solution hyperspace. Deception of velocity and position updates in PSO are shown in figure 1.
(t+1) t (t)
id id id 1 1 id id
(t)
2 2 id id
v
=
*v +C *rand ()*(pbest -x )
+C *rand ()*(gbest -x ) ,
w
(1)
(t + 1 ) (t) (t + 1 )
i d i d i d
x
= x
+ v
i = 1 , 2 , ..., n ,
d = 1 , 2 , ..., m
(2) where,
( t ) i d
v
: Velocity of particle i at iteration t; in d - dimensional space,
( t )
d , m i n i d d , m a x
v
≤
v
≤
v
(t) id
x
: Current position of particle i at iteration t,Wid : Inertia weight factor, t : Number of iterations,
rand1 ( ) , ran2( ): Random number between 0 and
1.
Figure.1. Deception Of Velocity And Position Updates In PSO.
The inertia weight is updated using equation (3)
iter-1 0 .9 0.8
m axiter-1
id
W
= − (3)
Where Wid is the inertia weight at particle i.
iter: is the iteration number(t).
Maxiter: is the maximum number of iterations.
3. IMPLEMENTATION OF PSO
ALGORITHM
In electric power systems, bus voltages are significantly affected by load variations and by network topology changes. The goal of the optimization is to obtain the best utilization of the existing power network and voltage profile under various load conditions. In this respect, the FACTS devices are located so as to
(i) minimize the voltage deviations in the system
(ii) minimize power system total loss
(iii) have the minimum possible STATCOM
sizes and
(iv) maximize loadability limit
It is a multi objective optimization problem and the problem is transformed into a single objective optimization problem.
The fitness function has four terms with individual criteria. The first part of the objective function concerns the voltage level. It is favorable that bus voltages be as close as possible to 1 p.u. Equation (4) shows the voltage deviation in all buses.
3 0
2
i= 1
(
V
- 1 )F
v=∑
i(4)
where i=1…30 is the number of buses and Vi is the
voltage of bus i.
The second term is related to power system total loss and minimizing it in power systems that are given by equations (5) and (6). PLk = Psending – Precieving (5)
FL = PL_total = Floss = 4 1
l k
1
P
∑
(6)
where Plk indicates the loss in line ending to buses l
and k, and FL = Floss represents the total loss of
power network and 1….41 is the no. of lines in the IEEE 30 bus system.
The third term is related to having the minimum possible STATCOM sizes considering the control of STATCOM that is given by (7)
3
j s
j= 1
= Q
F
∑
(7) where the number of STATCOM is 3 and Qj is the
value of STATCOM in Mvar.
From the power system static stability viewpoint, the maximum loadability of power system is extremely important and hence it plays an important role in our study too. Finally, the fourth issue is determining inverse of maximum loadability, given as follows:
c rit
1 M L =
λ
F
(8)Therefore, the objective function is given by (9):
F = ω1FV + ω2FL + ω3FS + ω4FML (9)
where, functions FV , FL , FS and FML are given by
(4), (6), and (7) and (8) respectively. The weight that multiplies each term of objective is adjusted to reflect the relative importance that each goal has with respect to the other. For conventional solution, it is decided to give equal importance to all objective terms, giving values of ω1= 1, ω2 =1/
(base case loss), ω3 = 1/(No. of STATCOM*250)
and ω4 = 1, so that the four terms in the fitness
function are comparable in magnitude. STATCOM size is limited to be between 0 MVAr and 250 MVAr. So denominator term for ω3 is taken as
number of STSTCOM devices X 250. Thus equal weight-age is given to all parameters in the objective function.
The equal weight-age given to all parameters is not the best always in practice. Sometimes it leads to more investment in reactive power compensation. To avoid this in the proposed algorithm the value of weight multiplier for each parameter is decided based on the real time cost of each parameter. ω2 is the weight multiplier for the
real power loss and it is taken as Rupees(Rs) 5crore per MW. It is the cost of thermal power generation. V(t+1)id
Vtid
X(t+1)id
gbestid
Pbestid
ISSN: 1992-8645 www.jatit.org E-ISSN: 1817-3195
ω3 is the weight multiplier for STATCOM size and
it is taken as Rs25 lakhs per MVAr. It is the cost of STATCOM unit. ω1 and ω4 are weight multiplier for
voltage deviation and loadability limit some penalty cost factor (10 crore and 5 crore respectively) has been chosen for them. Objective function with respective cost weight-age multipliers for the parameters is termed as cost effective objective function. Whenthe optimization problem is solved with cost objective function the investment in
reactive power is reduces.
The computational flow chart of PSO algorithm is shown in figure 2.
4. DISCUSSION OF RESULTS
The proposed algorithm is tested in IEEE 30 bus test system in the following two different ways and the cost effective results are compared with conventional method.
Case 1: When real and reactive power of load multiplied by Loading Factor LF.
Case 2: When real and reactive power of generation and load multiplied by loading factor LF.
First the optimal placement and size of STATCOM in such manner to obtain improved voltage profile, minimal total system loss, minimal reactive power transfer and maximization of the stability limit is found by PSO for case:1 with cost effective objective function. After find out cost effective solution for case:1 the STATCOM location was fixed for remaining conventional solution of case:1, cost effective solution of case:2 and conventional solution of case:2 to compare the solutions. For all the remaining cases the size of STATCOM only optimized using PSO and location was fixed as it is obtained in cost effective solution of case:1.
For all the case the loading factor is assumed L.F=1.6 and the number of STATCOM used is 3.
4.1. Case 1: When real and reactive power of load multiplied by loading factor LF.
Let the real and reactive power demand is
increased by the load factor 1.6 (Thus 1.6 time of base load). So real and reactive power of load given in the IEEE-30 bus system is multiplied by 1.6. With this load the optimal placement and size of STATCOM is optimized using PSO with the weight-age given for all objective based on their real time cost (proposed method) are tabulated in table II. With the fixed location the same case is solved by conventional method. The conventional results are tabulated in table I.
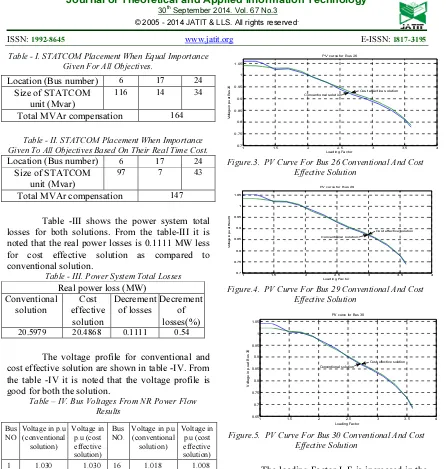
[image:4.595.323.553.186.677.2]From the table –I and II it is noted that the size of STATCOM or total reactive power compensation required (17 MVAR less as compared to conventional) is reduced by cost effective solution.
Figure.2. Flow Chart Of The Proposed Algorithm
NO NO
NO
YES
Initialize each particle’s position and velocity
Is iter<maxiter?
Start
End
All particle checked?
Run NR load flow and compute fitness function
For each particle determine and
store Pbest
For all particles determine and
store gbest
Relocate particle to feasible position of
search space Update velocity
and particle position
Check feasibility
YES
Table - I. STATCOM Placement When Equal Importance Given For All Objectives.
Location (Bus number) 6 17 24
Size of STATCOM unit (Mvar)
116 14 34
Total MVAr compensation 164
Table - II. STATCOM Placement When Importance Given To All Objectives Based On Their Real Time Cost.
Location (Bus number) 6 17 24
Size of STATCOM unit (Mvar)
97 7 43
Total MVAr compensation 147
Table -III shows the power system total losses for both solutions. From the table-III it is noted that the real power losses is 0.1111 MW less for cost effective solution as compared to conventional solution.
Table - III. Power System Total Losses
Real power loss (MW) Conventional solution Cost effective solution Decrement of losses Decrement of losses(%)
20.5979 20.4868 0.1111 0.54
[image:5.595.81.527.76.545.2]The voltage profile for conventional and cost effective solution are shown in table -IV. From the table -IV it is noted that the voltage profile is good for both the solution.
Table – IV. Bus Voltages From NR Power Flow Results
To analyze the voltage stability of the system the PV curve is drawn for [19] weak buses 26, 29 and 30.
1 1.5 2 2.5 3 3.5 4
0.7 0.75 0.8 0.85 0.9 0.95 1 1.05 Loading Factor V o lt a g e i n p .u a t B u s 2 6
PV curve for Bus 26
Conventional solution
Cost effective solution
Figure.3. PV Curve For Bus 26 Conventional And Cost Effective Solution
1 1.5 2 2.5 3 3.5 4
0.7 0.75 0.8 0.85 0.9 0.95 1 1.05 Loading Factor V o lt a g e i n p .u a t B u s 2 9
PV curve for Bus 29
Conventional solution
[image:5.595.323.520.386.503.2]Cost effective solution
Figure.4. PV Curve For Bus 29 Conventional And Cost Effective Solution
1 1.5 2 2.5 3 3.5 4 0.65 0.7 0.75 0.8 0.85 0.9 0.95 1 1.05 Loading Factor V o lt a g e i n p .u a t B u s 3 0
PV curve for Bus 30
Conventional solution
Cost effective solution
Figure.5. PV Curve For Bus 30 Conventional And Cost Effective Solution
The loading Factor L.F is increased in the order of 0.1 from Base load of 1.p.u. From the PV curves it is noted down that the stability limit is L.F=3.6 for conventional solution and cost effective solution. The system can withstand at-least with lower voltage up to these limits. If the load increases more than 3.6 the voltage is sharply decreases and system become unstable. It is known that from the fig 3, fig 4 and fig 5 the voltage at bus 26, bus 29 and bus 30 are maintained within permissible limit up to only L.F=2.4, LF=2.3 and LF=2.1 respectively for both conventional solution and cost effective solution. There after the voltage is reduced less than the permissible limit with increment of load, but the system is stable up to LF=3.6. It is the maximum stability limit for the system. There is no considerabledifference inthe stability limits for both cases.
Bus NO
Voltage in p.u (conventional solution) Voltage in p.u (cost effective solution) Bus NO.
Voltage in p.u (conventional solution) Voltage in p.u (cost effective solution)
1 1.030 1.030 16 1.018 1.008
2 1.020 1.010 17 1.022 1.008
3 1.008 1.000 18 0.991 0.984
4 1.003 0.993 19 0.989 0.981
5 0.980 0.970 20 0.996 0.988
6 1.013 1.001 21 1.011 1.004
7 0.986 0.974 22 1.014 1.007
8 1.000 0.990 23 1.005 1.004
9 1.025 1.015 24 1.021 1.024
10 1.025 1.015 25 1.007 1.005
11 1.020 1.010 26 0.978 0.976
12 1.026 1.021 27 1.013 1.007
13 1.020 1.020 28 1.007 0.995
14 1.007 1.002 29 0.979 0.974
[image:5.595.81.298.494.695.2]ISSN: 1992-8645 www.jatit.org E-ISSN: 1817-3195
4.2 Case 2: When real and reactive power of generation and load multiplied by loading factor LF.
In this case both generation and load demand is increased by the factor of LF = 1.6. The generator Q limit also allowed to increase 1.6 time of given limit. (This assumption is made for future expansion of power system ).With this assumption the size of STATCOM is found by PSO using conventional method and cost effective method are given in table- V and VI respectively. From the table V and VI it is noted that the size of STATCOM reduced by 15 MVAR using cost effective solution as compared to conventional solution.
Table - V. STATCOM Placement When Equal Importance Given For All Objectives.
Location (Bus number) 6 17 24
Size of STATCOM unit (Mvar)
65 11 35
Total MVAr compensation 111
Table - VI. STATCOM Placement When Importance Given To All Objectives Based On Their Real Time Cost.
Location (Bus number) 6 17 24
Size of STATCOM unit (Mvar)
42 19 35
Total MVAr compensation 96
The table VII shows the power system total losses for the case 2. The real power loss for the proposed method is 0.01268 MW less than the conventional solution.
Table - VII. Power System Total Losses
The voltage profile of both The voltage profile of both solution is given in table VIII. Both solutions are maintaining the good voltage profile.
Table – VIII. Bus Voltages From NR Power Flow Results
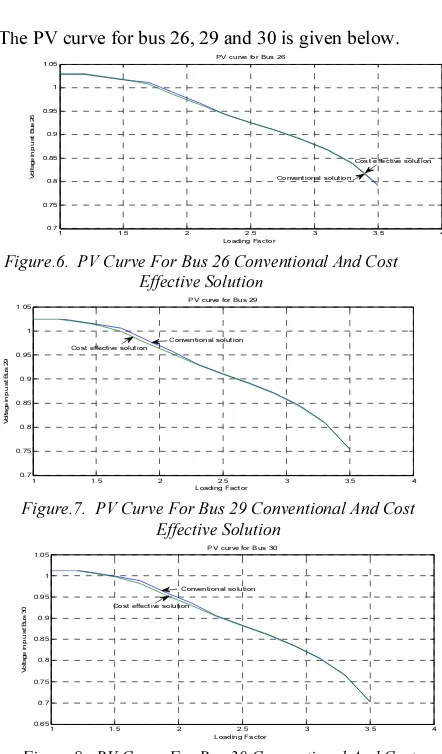
The PV curve for bus 26, 29 and 30 is given below.
1 1.5 2 2.5 3 3.5 4
0.7 0.75 0.8 0.85 0.9 0.95 1 1.05
Loading Factor
V
o
lt
a
g
e
i
n
p
.u
a
t
B
u
s
2
6
PV curve for Bus 26
Conventional solution
Cost effective solution
Figure.6. PV Curve For Bus 26 Conventional And Cost Effective Solution
1 1.5 2 2.5 3 3.5 4 0.7
0.75 0.8 0.85 0.9 0.95 1 1.05
Loading Factor
V
o
lt
a
g
e
i
n
p
.u
a
t
B
u
s
2
9
PV curve for Bus 29
Cost effective solution
Conventional solution
Figure.7. PV Curve For Bus 29 Conventional And Cost Effective Solution
1 1.5 2 2.5 3 3.5 4
0.65 0.7 0.75 0.8 0.85 0.9 0.95 1 1.05
Loading Factor
V
o
lt
a
g
e
i
n
p
.u
a
t
B
u
s
3
0
PV curve for Bus 30
[image:6.595.307.528.349.726.2]Conventional solution Cost effective solution
Figure.8. PV Curve For Bus 30 Conventional And Cost Effective Solution
Real power loss (MW) Conventional
solution
Cost effective
solution
Decrement of losses
Decrement of losses(%)
9.27679 9.26411 0.01268 0.14
Bus NO
Voltage in p.u (conventional
solution)
Voltage in p.u (cost effective solution)
Bus NO.
Voltage in p.u (conventional solution)
Voltage in p.u (cost effective solution)
1 1.030 1.030 16 1.012 1.018
2 1.030 1.030 17 1.015 1.025
3 1.013 1.012 18 0.986 0.989
4 1.009 1.007 19 0.984 0.987
5 1.010 1.010 20 0.991 0.995
6 1.016 1.012 21 1.007 1.011
7 1.000 0.998 22 1.010 1.014
8 1.010 1.010 23 1.001 1.004
9 1.020 1.022 24 1.019 1.022
10 1.020 1.025 25 1.006 1.007
11 1.010 1.010 26 0.977 0.978
12 1.022 1.023 27 1.013 1.012
13 1.010 1.010 28 1.011 1.008
14 1.003 1.005 29 0.979 0.979
From the PV curves it is note down that the stability limits of the bus 26, 29 and 30 are LF=3.5 for both conventional solution and cost effective solution. The system is stable up to these limits at least with lower voltage. If the load increases more than 3.5 the voltage magnitude sharply decreases and system become unstable. It is known that from the fig 6, fig 7 and fig 8 the voltage at bus 26, bus 29 and bus 30 are maintained within permissible limits up to only L.F=2.2, LF=2.1 and LF=2.0 respectively for both conventional solution and cost effective solution. There after the voltage is reduced less than the permissible limit with increment of load, but the system is stable up to LF=3.5. It is the maximum stability limit for the system. There is no considerable difference in the stability limits for both cases.
[image:7.595.72.294.346.478.2]Comparison Of Objective Values Table – IX. Objective Values
The table-IX shows the actual value of the objective functions. From the table it is noted that the voltage deviation, real power loss, and STATCOM size are better than conventional solution. The stability limit is equal for both cases.
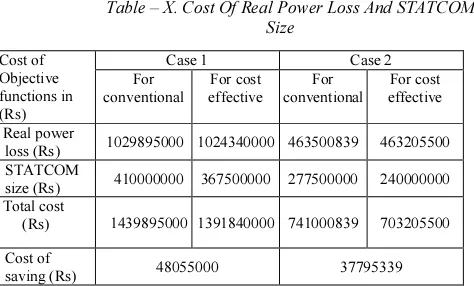
Table – X. Cost Of Real Power Loss And STATCOM Size
The real power losses and STATCOM sizes give in table-IX are multiplied by their respective cost (Rupees 5 crore and 25 lakhs ) and
tabulated in table-X. From the table the cost of saving for case :1 is Rs48055000 and the cost of saving for case :2 is Rs37795339. So proposed method found the optimal solution as economically as possible.
5. CONCLUSION
An objective function that incorporates real time costs in the optimization process has been proposed in this paper. The parameters considered in the optimization process include voltage profile,
system losses, reactive compensation and
loadability. The solutions obtained for IEEE 30bus test system have proved amply the cost effectiveness of the proposed methodology. A clear improvement of performance with respect to the voltage deviation, total losses and loadability limit, through optimal placement and sizing of STATCOM in power system has been established.
In the case 1; the results are obtained when the load is increased by 1.6 times than the base load uniformly. Under this load condition the optimal size and placement of STATCOM using cost effective solution reduces the MVAr size of STATCOM and losses effectively as compared to the conventional solution. The voltage profile and stability limit are more or less same for both method of solution.
In the case 2; distributed generation is considered. When the demand is increased the generation is also increased proportionately. Because of the distributed generation system the line losses are naturally less for this case. However the optimal size and placement of STATCOM using cost effective solution reduces the Mvar size of STATCOM and losses effectively.
In In both cases studied the increment of load or generation is assumed to be uniform in all the busses. But in practical case it need not necessarily be uniform. However the algorithm can find optimal solution for any kind of distribution of load and generation. Further the proposed cost objective function is improving the performance of the system with less investment in STATCOM.
REFRENCES:
[1] N.G. Hingorani, and L. Gyugyi,
"Understanding FACTS;Concepts and
Technology of Flexible AC
TransmissionSystems," IEEE Press, New York, 2000
Objective functions
Case 1 Case 2
For conventional
For cost effective
For conventional
For cost effective Voltage
deviation (p.u)
0.0951588 0.0910177 0.0829611 0.0809623
Real power
loss (MW) 20.5979 20.4868 9.27679 9.26411
STATCOM
size(MVAr) 164 147 111 96
Maximum loadability limit
3.6 3.6 3.5 3.5
Cost of Objective functions in (Rs)
Case 1 Case 2
For conventional
For cost effective
For conventional
For cost effective
Real power
loss (Rs) 1029895000 1024340000 463500839 463205500
STATCOM
size (Rs) 410000000 367500000 277500000 240000000
Total cost
(Rs) 1439895000 1391840000 741000839 703205500
Cost of
[image:7.595.49.286.559.702.2]ISSN: 1992-8645 www.jatit.org E-ISSN: 1817-3195
[2] H. Omidi, B. Mozafari, A. Parastar and M.A.
Khaburi,“Voltage Stability Margin
Improvement using Shunt Capacitors and
Active and Reactive Power
Management,”proceeding of IEEE Electrical Power & Energy Conference 2009
[3] Byunghoon Chang, Byongjun Lee, and Joe H. Chow, “A Novel Operation Strategies for Shunt-Type FACTS Controllers in the KEPCO
System,” IEEE TRANSACTIONS ON
POWER SYSTEMS, VOL. 24, NO. 3, AUGUST 2009
[4] Mehrdad Ahmadi Kamarposhti and Hamid Lesani, “Effects of STATCOM, TCSC, SSSC and UPFC on static voltage stability,” Springer-Verlag 2010
[5] H. F. Wang, H. Li, and H. Chen, “Application of Cel Immune Response Modelling to Power System Voltage Control by STATCOM”, IEE Proc.-Gener. Transmi. Distib., 149(1)(2002), pp. 102–107.
[6] M. A. Abido, “Power system stability enhancement using facts controllers: a review,” The Arabian Journal for Science and Engineering, Volume 34, Number 2B April 2009.
[7] Y. del Valle, J. C. Hernandez, G.K. Venayagamoorthy, and R.G Harley,“Optimal STATCOM Sizing and Placement Using Particle Swarm Optimization,” Accepted by the IEEE PES Transmission and Distribution Conference and Exposition Latin America 2006, Caracas, Venezuela, 2006.
[8] Young Park, Jin-Man Sohn, and Jong-Keun Park, “Optimal Capacitor Allocation in a Distribution System Considering Operation Costs,” IEEE TRANSACTIONS ON POWER SYSTEMS, VOL. 24, NO. 1, FEBRUARY 2009 pp. 462-468
[9] J. Kennedy, R. Eberhart, “Particle swarm
optimization” Proceedings of IEEE
International Conference on Neural Networks (lCNN’95), vol. IV, pp. 1942-1948, Perth. Australia. 1995.
[10] H. Yoshida, K. Kawata, Y. Fukuyama, S. Takayama, Y.Nakanishi,”A particle swarm optimization for reactive power and voltage
control considering voltage security
assessment” IEEE Trans, Power Systems, vol. 15(4). pp. 1232-1239, Nov 2000.
[11] M. Clerc, J. Kennedy, “The particle swarm explosion, stability and convergence in a
multidimensional complex space”, IEEE
Trans, Evolutionary Computation, vol. 6(1),
pp. 58-73, Feb 2002.
[12] Hirotaka Yoshida Yoshikazu Fukuyama, Kenichi Kawata Shinichi Takayama, Yosuke Nakanishi, “A Particle Swarm Optimization for
Reactive Power and Voltage Control
Considering Voltage Security Assessment,” IEEE Trans. on Power Systems, Vol.15, No.4, pp.1232 1239, November 2001.
[13] G. I. Rashed, H. I. Shaheen, S. J. Cheng, “Optimal Location and Parameter Settings of Multiple TCSCs for Increasing Power System
Loadability Based on GA and PSO
Techniques,” Third International Conference on Natural Computation (ICNC 2007)
[14] S.Sakthivel and D.Mary “Particle Swarm Optimization Algorithm for Voltage Stability Enhancement by Optimal Reactive Power Reserve Management with Multiple TCSCs,” International Journal of Computer Applications (0975 – 8887) Volume 11– No.3, December 2010
[15] Del Valle Y, Hernandez JC, Venayagamoorthy GK and Harley RG, “ Multiple STATCOM allocation and sizing using particle swarm optimization,” 2006 power system conference and exposition (PSCE 2006)
[16] E. Nasr Azadani S. H. Hosseinian and P. Hasanpor “Optimal placement of multiple STATCOM for voltagestability margin enhancement using particle swarm optimization,” Springer-Verlag 2008.
[17] E. Nasr Azadani S. H. Hosseinian M.Janati and P.Hasanpor “Optimal Placement of Multiple STATCOM,” conference proceeding IEEE 2008.
[18] Kennedy J, Eberhart R (1995) Particle swarm optimization. In: Proceedings of IEEE international conference on neural networks (lCNN’95), vol IV. Perth, pp 1942–1948. [19] Kumarasamy K, Dr. R. Raghavan, “Particle