OPTIMIZING AND COORDINATING THE DYNAMIC
CONFIGURATION OF PORTS’
COLLECTION-DISTRIBUTION TRANSPORTATION CAPACITY
HAIHONG YU
Assoc. Prof., Maritime School of Ningbo University, Ningbo 315211, China
E-mail: [email protected]
ABSTRACT
The collection-distribution transportation capacity has great significance for operation efficiency of a port. Facing with the changing demand of containers transport, ports are having an important decision problem of optimally configuring the collection-distribution transportation capacity of ports with a view of long term and dynamic, which is good for ports to maintain high operation efficiency and reduce idle waste of transportation resources. Through the analysis of a port supply chain consisted of a port, a freight forwarder and a transport fleet, the article constructs a multi-period dynamic optimization model to discuss the optimal strategy of the collection-distribution capacity configuration. Besides, the article analyzes the coordination problem of this dynamic strategy of capacity configuration. The results show that the optimal configuration strategy is a function which includes three parts: 1) basic configuration amount; 2) the derived amount by demand; 3) the amount affected by period. The optimal dynamic strategy is not affected by direct transport operating cost but trucks holding cost. In addition, we obtain the conclusions that present wholesale price freight charge mode between transport fleet and forwarder can not achieve coordination. What we need is to change this wholesales price mode and to implement a new freight charge mode called “service plus capacity” mode.
Keywords:Ports, Collection-Distribution Transportation, Capacity Configuration, Dynamic Optimization, Coordination
1.
INTRODUCTIONThe core issue that the paper analyzes is the optimal configuration of the port collection- distribution transportation capacity at different times to achieve the maximum benefits in the whole port developing periods with the changing container logistics demand. Compared with general issues of port collection-distribution transportation, the question discussed in this paper has two characteristics: one is the dynamic characteristic, that is what we seek is a series of optimal decisions in different port developing periods; the other is the supply chain characteristic, namely, the analyses of integrate optimization, structure optimization and coordination are from the perspective of port supply chain.
From the view of actual development, dynamic optimal configuration of the port collection-distribution capacity plays an important role in improving the port competitiveness. First of all, the core competence of the port is no longer only reflected in the port internal resources and operational efficiency, as the competition intensifies
configuration of the port collection-distribution capacity can avoid the internal cost during this process. Thirdly, the port system needs to be upgraded from static optimization to dynamic optimization, that is, the optimization of the port system cannot only be the optimization in a certain period, but the long-term and comprehensive optimization based on the consideration of all development periods and a series optimized strategy solutions. The dynamic optimization configuration strategy of the port collection-distribution capacity can just reach these requirements. In addition, the
dynamic optimization configuration of the
collection-distribution transportation capacity would also provide ideas and directions for the port supply chain improvement. During the period of port upgrading and updating, the current situation of the port-oriented supply chain system not being settled, the port business extension along the supply chain being limited, the lack of logistic service integration and the dispersion and independent of the collection-distribution transportation fleets, has weakened the port’s influence and control to the collection-distribution transport operation. In reality, the conflict of information between port operation and fleet leads to the resources misallocation and resource-wasting. This causes the operation efficiency loss of the port supply chain. Hence further attention and solution to the ubiquitous misallocation issue of the collection-distribution transportation capacity of port supply chain system is quite needed.
The dynamic configuration of the port collection-distribution transportation capacity is an issue of dynamic optimization. For the development of a port, it is suitable to make yearly strategy to leave out the seasonal fluctuations in each year. And for the fleet, it is also reasonable to consider adjusting the capacity of the fleet annually. As a result, year, a kind of time unit, is selected and used in this paper. In the long-term development of a port, the optimization of the collection-distribution capacity configuration is annually analyzed in this paper.
There is big difference in the types of cargo and collection-distribution transportation among different ports. In order to clearly reflect the ideas of the dynamic optimization of the collection-distribution capacity, this paper chooses containerized cargo and truck transportation to simplify the analysis. The dynamic optimization thinking of the collection-distribution transportation of containerized cargo can be applied to both bulk cargo and liquid and gaseous goods, and train or other modes of transportation.
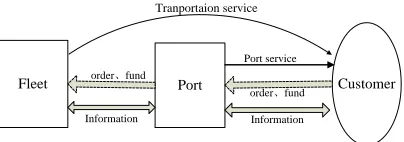
The basis of the study on the dynamic configuration of the port collection-distribution transportation capacity is an operation system of the port supply chain. From the perspective of operation process theory, a succinct and efficient port supply chain structure includes customer, port and fleet, and the operation procedure is as shown in Figure 1.
Customer Port
Fleet
Tranportaion service
order、fund
Information
Port service
[image:2.612.318.520.194.265.2]order、fund Information
Figure 1 : The port supply chain structure in theory
The supply chain shown in Figure 1 is essentially a kind of service supply chain, namely, the core product of the supply chain is intangible service, not physical products. The figure shows that the client has the demand of the port logistic service, and the port, which is the core enterprise, provides the port operation services and outsources the collection-distribution transportation business to the fleet. In this supply chain, port and fleet do the trade directly and have the communication foundation to achieve optimal configuration.
[image:2.612.317.519.515.585.2]However, the situation is quite different in the real port supply chain. It is because there is another member—freight forwarder existed in the real operation of port supply chains as the international logistics business is complicated and professional. Figure 2 shows the port supply chain structure and the operation procedure in the actual operation.
Customer
Freight forwarder
Fleet
Transportaion service
Information Order, fund
Information Order, fund
Agency service Information Order, fund
Port
Port service
Figure 2 : The port supply chain structure in reality
this reason, the conflict between the transaction relationship and the operational relationship, which reflects the actual flaws of the real port supply chain structure, makes the possibility of efficiency loss of the port supply chain.
Furthermore, there are two optimization perspectives for the dynamic optimization issue of the port collection-distribution capacity configu-ration; one is the perspective of benefits maximization of the entire port supply chain, another one is the benefits maximization of the collection-distribution transportation fleet. The configuration of the collection-distribution trans-portation capacity is oriented by the fleet’s benefits maximization as it is fleets who make the decisions of the capacity configuration. However, the individual optimal strategy is not the optimization of the whole supply chain. This will cause the benefits loss of the supply chain. Therefore, further research is needed to ensure the optimal configuration of both the fleet and the whole supply chain; that is to guarantee that the supply chain achieves the optimization allocation of the collection-distribution transportation. This paper first studies on the dynamic optimal strategy of the collection-distribution transportation capacity configuration from the perspective of whole supply chain, then analyses the requirements of achieving the coordination.
Many scholars both at home and abroad have made a lot of research on the optimization of the port collection-distribution transportation system. Most of the scholars did static analysis of the optimization issue from the aspects of network optimization and transportation planning in a certain development period. However the dynamic analyses in this field are need to be supplemented. The domestic research emphasized more on the network and node construction of the port collection-distribution transportation and the management of the port collection-distribution transportation planning. Liang(2012) described the influence of port node strategy and user routing strategy to the collecting-distributing network structure in the supply chain and built the optimization model of the port collection-distribution system by the bi-level programming. Ma (2012) allocated the cargo flow in the port collection-distribution system by using the system optimization of the equilibrium method and got an optimal flow allocation by the Logic modal. Wang and Jiang (2008) did research on the optimal strategy of the inland collection-distribution transportation network of the regional port and built
the bi-level programming model of the inland collecting and distributing centre construction and user routing selection based on the port logistic system. Jin (2007) selected Shanghai Port as the research objective, analyzed the flow distribution of different collecting and distributing transportation mode and built the distribution system modal of Shanghai Port container collection-distribution system. Ma (2009) did the research on the land collection-distribution capacity and allocation, and drew the conclusion that the collection-distribution transportation capacity of the port is not designed based on the port throughput exactly, but less or more than the demand of the throughput. And besides, she proposed to raise the percentage of the rail collection-distribution transportation in the land collection-distribution transportation. Zang (2011) discussed the optimization of collection-distribution transportation network of the port and based on the reality established the linear programming model with the present transportation infrastructure constraints. Dong(2007) used the node extension method to define and describe the transshipment and set up a model based on generalized cost of the different cargoes and modals.
However, the overseas research on the port collection-distribution transportation usually has a specific port cluster as the research objective, studying the facility of the port collection-distribution transportation, port logistic system planning and the implementation strategy, analyzing the development of the port multimodal transportation (Notteboom, 2005). Beuthe (2001) built demand allocation modal of the port cargo based on the combination of different cargo and different transportation path. Spiss and Florian (1989) built the cargo allocation modal based on the transportation condition of node and multi-path for the dynamic allocation issue of traffic flow in the transportation networks. Peter Nikamp (2004) provided theoretical basis for the internal coordination mechanism of the port collection-distribution transportation system by using the discrete modal and neuron modal to do the capacity forecast and optimizing of the cargo transportation networks.
benefits. The coordination conditions are discussed accordingly. The conclusions and the future research are mentioned in Section 4.
2.
THE DYNAMIC OPTIMIZATION ANALYSIS2.1 The Model
Based on the structure of Fig.2, we set up a simplified supply chain frame: a forwarder, a container port and a container fleet which services
only for the port. The port chargesppper TEU by
rendering inward and outward port maneuvering
services. The subscript prepresents port. All the
collection-distribution transportation of the port is undertaken by the fleet, and the fleet charges
F
p per TEU per mile from the forwarder. The unit
benefit the forwarder make isRfor each container.
Over the period of time from 0 to T , the
container handling demand the port faces
isD t( )TEU for each specific time of t and the
average transportation distance of each container
is M miles, thus the total collection-distribution
transportation demand the fleet faces isM* ( )D t
(mile*TEU). According to the research results of Shanghai port container demand evolution analysis by Zhang (2007), the form of exponential function is the most precise model to forecast the container demand of the Chinese ports in Yangtze River Delta area. So we assume that
( ) bt (1)
D t =ae
among which ,a bare the relevant parameters.
At the beginning of the period, namelyt=0, the
transportation capacity of the fleet isF0. In the next
every period, the fleet determines the optimal
capacity y t( ) to maximize its own benefits. During
one period, the turnover of each truck is φ ,
therefore the total freight transportation capacity
during one period isφy t( ). The holding cost of
capacity y t( )isc y tm ( ) and the unit operating cost
is co per TEU per kilometer. For a specific actual
demandD t( ), the total operating cost (exclusive of
holding cost ) of the fleet will bec Mo * ( )D t .
If the fleet capacity exceeds the actual demand, i.e. overconfiguration, the fleet can finish all the collection-distribution transportation tasks by itself while there exists capacity waste. Otherwise, the fleet capacity is less than the actual demand, and then the fleet has to hire additional trucks from
other fleets at a higher price to finish the tasks. Thus both over and less configuration can cause efficiency loss. This efficiency loss is represented by the following cost expression:
2
( ( )D t y t( )) (2)
α −φ
in whichα is the coefficient of the function.
In every period, the fleet regulates the transportation capacity by increasing or reducing trucks. Such regulation also will come at an extra cost, such as vehicle investment cost, personnel training cost and the expenses of truck reselling and
drivers disbanding, etc. In the period oft , the
amount of transportation capacity regulation equals
to y t'( ), and we use the following expression to
represent the extra costs:
' 2
( ( )) (3)y t
β
This cost function ensures that any directional change of capacity will generate a positive cost.
Here βis another coefficient.
Whether the transportation capacity of the fleet is sufficient or not would influence the operating efficiency of the port. Specifically, if there are more than enough trucks waiting for tasks, the operation efficiency of container yards will be increased by means of decreasing waiting time or choosing more efficient trucks. Conversely, the operation process of the container yard may stagnate so as to wait for trucks. For this reason, the total operating cost will increase. So the gap between the actual demand and the fleet transportation capacity could bring the port an additional cost, which is expressed as follows:
( ( )D t y t( )) (4)
γ −φ
Theγ is the coefficient. And when the actual
demand is over the fleet transportation capacity, the value of expression (4) is positive. Otherwise, it would be negative, which means that the overwaiting trucks can increase the port operating efficiency and therefore decrease the operation cost of the port.
Based on the above port supply chain model, we need to seek for the optimal strategy of the collection-distribution capacity configuration,
namely the specific state function of y t( ) which
could tell us how to adjust the container transportation capacity in different periods so as to
achieve the benefits maximization during 0 to T.
and the objective is to maximize the total profits during period 0 to T.
0
( ( )) T[ ] (5)
MaximizeΠ y t =
∫
π dtin which
2 ' 2
( ) ( ) ( ) ( )
( ( ) ( )) ( ( )) ( ( ) ( ))
p F m o
R p p M D t c y t Mc D t
D t y t y t D t y t
π
α φ β γ φ
= + + − −
− − − − −
and ( ) bt
D t =ae .
The corresponding boundary constraint conditions are as follows:
0
(0)
(6)
( ) T
y F
y T F
=
=
2.2 Model Solving
We can use the traditional variation method to
solve this model. After taking the derivation of π
with respect to '
, ,
y y t respectively, we get:
2
2 bt 2 ( )
y ae cm y t
π
=αφ
− −αφ
+γφ
,'
'
2 ( )
y y t
π = β ,
' ' 2 y y
π = β,
' 0 yy
π = , π =ty' 0
Thus, the Euler equation of this model is as follows:
'' 2
2βy t( )−2αφaebt+cm+2αφ y t( )−γφ=0 (7) Then come to the general solution:
1 2 2
2 2
( ) cos( ) sin( )+
2
(8) m
bt c
y t c t c t
ae b
γφ
α α
φ φ
β β αφ
αφ
β αφ
−
= +
+ +
where the
1, 2
c c are willful constants.
In the actual decision, the terminalT, the initial
capacity
0
F and the final capacity FT can be
determinated. So we could easily use two boundary
conditions to figure out
c
1andc2, then come thedecided solution for this dynamic model.
The function (8) is the optimal capacity of
container transportation in different periods t, and
by taking its derivation with respect to t we can get
the adjustment strategy of container transportation capacity y t'( )
:
'
2 1
2 2
( ) cos( ) sin( )
+ bt (9)
y t c t c t
b ae b
α α α α
φ φ φ φ
β β β β
αφ
β αφ
= −
+
where the variables of
c
1 and c2 areundetermined constants.
2.3 Parameters Influences And Management Insights
According to the optimal dynamic configuration strategy which is indicated by the state equation (8),
the price
p
P andpFhave no influence on capacityconfiguring. That means the profit reallocation between port and the fleet by price change does not influence the optimal capacity configuration either. This characteristic makes the supply chain members have the maximum flexibility to adjust profits allocation to coincide with each bargaining power. Of course this feature is resulted from the
assumption that during the periods from 0 to T all
demands would be meet, which indicates the total revenue is fixed when the demand and price are determined.
Viewed from the cost parameters, we could find
the operating costcodoes not appear in the state
equationy t( ), however the holding cost cm does.
This tells us that the transportation capacity configuration is not affected by the operating cost but inversely affected by the trucks holding
costcmwith the influence coefficient of 2
1 2αφ
− .
For the real management decisions, managers may pay closer attention to reducing the trucks maintenance cost in order to increase the volume of the optimal transportation capacity, which will indirectly improve the operation efficiency of the port.
The equation of optimal transportation capacity configuration can be divided into three parts: 1) Basic configuration amount; 2) the derived amount
by demand; 3) the amount affected by period t.
They are respectively expressed as 2
2 m c γφ
αφ −
,
2 2
bt ae b
αφ
β +αφ , c1cos(t ) c2sin(t )
α α
φ φ
β + β .
Among them the basic configuration amount is fixed because it doesn’t change with time or demand. What’s more, we see that the trucks
means that the optimal periodical adjustment
strategy
y t
'( )
is unaffected by the cm. The amountderived by demand is a positively related linear function of market need in each period, and the
coefficient is 2 2
b αφ
β +αφ . The amount affected by
period is a nonlinear function of time, and from the view of a long period, it shows as a kind of wavy curve.
α φ
β is an important and meaningful coefficient,
where α
β represents the ratio of the weight of
transportation capacity mismatching to the weight
of capacity changing cost. Here α 0
β > . And φ is
such a coefficient which indicates the average times of reuse of each truck during one period, so
definitely φ≥1 . The coefficient of φ α
β
determines the curve form of the optimal capacity
configuration strategy functiony t( ) in significant
measure. The greater the coefficientφ is, the more
frequently the curve of y t( ) fluctuates. Similarly,
the greater the coefficient α is or the smaller the
β is, the more frequently the curve of y t( ) waves.
More frequent wave means more difficulties the managers will face. As a result, for a certain port area, we need to pay closer attention to optimizing management of the container fleet if the
coefficients φ, αare in high numerical value.
3.
COORDINATION ANALYSISThe dynamic optimization configuring strategy mentioned above is obtained from the view of maximizing the benefits of the whole supply chain. A problem we faced in reality is that it is the fleet who makes the trucks configuration decisions, which means he determines the capacity adjustment only to optimize his own benefits not the whole supply chain’s if it is a dispersed decision-making supply chain. Therefore, the effective dynamic optimization configuring strategy in realty is based on fleet’s benefits optimization which is quite different from the strategy of function (8). What’s more, the fleet’s decision will inevitably make the whole supply chain lose profits and production efficiency. We need to raise a strategy to make the fleet’s decision also fit for the requirement of the
whole supply chain’s optimization, which is the coordination problem discussed in this section.
3.1 The Model Based On Fleet’s Optimization Similarly we seek for an optimal capacity
configuration strategy z t( ) from the fleet
perspective, which helps the fleet excellently adjust his transportation capacity in each period to gain
his maximum profits during period 0 to T. In this
case the objective function changes to: (the
subscript F means fleet)
0
( ( )) T[ ] (10)
F F
MaximizeΠ z t =
∫
π dtWhere the profit function of fleetπF is
2 ' 2
* ( ) ( ) ( )
( ( ) ( )) ( ( )) (11) F p M D tF c z tm Mc D to
D t z t z t
π
α φ β
= − −
− − −
and the boundary constraints still remain
0
(0) ( ) T z F z T F
=
=
Among the function (11) the demand function is
the same as before, i.e. ( )D t =aebt. However, the
fleet profit function πFhas a big difference with π.
The profit function of fleet will no longer
includes the revenue of port p D tp ( ) and nor an
effect −γ( ( )D t −φy t( ))on container yard operation efficiency caused by the differences between the transportation capacity and the demand. But all the parts concerning the fleet’s revenue and cost are
remained which include fleet revenue p MF * ( )D t ,
the holding cost c y tm ( ) , the operating cost
* o ( )
M c D t and the capacity adjustment cost
' 2
( ( ))y t
β , and the cost derived from mismatching
of the capacity and demand as well, i.e.
2
( ( )D t y t( ))
α −φ .
3.2 The Solution To Model Of Fleet Optimization
Analogously, we use variation method solve this dynamic optimization model. We take the
derivation of
π
F with respect to ', ,
z z t respectively
and we get:
2
2 bt 2 ( )
F
m
ae c z t
z
π αφ αφ
∂
= − −
∂ ,
'
' 2 ( )
F z t
z
π β
∂ =
∂ ,
' ' 2
F
z z
π β
∂ =
∂ ∂ , ' 0
F
z z
π
∂ =
∂ ∂ , ' 0
F
t z
π
∂ =
So the Euler equation of this model is:
'' 2
2βz t( )−2αφaebt+cm+2αφ z t( )=0 (12)
Then we can obtain the general solution:
1 2 2
2 2
( ) cos( ) sin( )
2
(13)
m
bt
c
z t c t c t
ae b
α α
φ φ
β β αφ
αφ
β αφ
= + −
+ +
Where
c
1 and c2 could be arbitrary constantwhich may be determined by two boundary constraint conditions in specific decision problem.
3.3 Coordination Condition Analysis
Because the boundary conditions of
( )
z t and y t( ) are same, if the form of function
( )
z t is the same as function y t( ), we can say the
dynamic capacity configuration strategy is coordinated. That is to say, the fleet’s optimal transportation capacity adjustment strategy makes the whole supply chain reach its maximum profits.
Compared with y t( ), there lacks the expression
2 2
γφ
αφ inz t( ). In order to let 2
2 γφ
αφ appear in z t( ),
we should add the expressionγφz t( ) into the profit
function of fleet πF. We could achieve this aim by
changing the present charging contract mode. Specifically the traditional contract charging mode –charging according to the wholesale price with the charge unit of per TEU per kilometer– cannot achieve the coordination of dynamic optimization strategy. A new charge mode called “service plus capacity” deserves attention because it meets our requirement mentioned just now. With this mode the revenue function of the fleet is as follows:
* ( ) ( ) (14)
N
p M D t +γφz t
where p MN * ( )D t represents the revenue by
offering transportation service and γφz t( ) by
maintaining the transportation capacity z t( ).
[image:7.612.95.299.83.216.2]From the view of reality, a feasible way to implement “service plus capacity” charge mode is to change the current port supply chain structure under which the forwarder pays to the fleet directly into a more effective structure like that described in figure 1. The port becomes the core enterprise of the supply chain and the fleet is the supplier of the port. In this way the port has a direct transaction with the fleet, therefore he could bring the “service
plus capacity” charge mode into force, which is beneficial to himself and to the whole supply chain as well since this mode will coordinate the supply chain. Besides, the forwarder becomes the customer only of the port and he provides many agency services to the ultimate customers called shipper or consignor. Under this circumstance, the port outsources the transportation business to the fleet and then pays him according to the “service plus capacity” charge mode showed by expression (14). By this means, we could achieve the coordination and maximize the profits of port supply chain.
4.
CONCLUDING REMARKSIn modern port logistics system, the collection-distribution transport operation is one of the bottlenecks in ports production and has the great significance for the efficiency of ports. However nowadays most collection-distribution transport fleets make operating decisions independently from the ports production requirements nor the long term benefits optimization. With the changing demand of
containers transportation for ports, the
configuration of collection-distribution transport capacity will affect the system efficiency of the whole port supply chain and the weak configuration definitely will lead to unnecessary costs.
Port production is an operation link next to collection-distribution transport operation in port supply chains. By constructing a multi-periods dynamic optimization model, we gain the optimal configuration strategy, from the view of optimizing whole supply chain, is a function which includes three parts: 1) basic configuration amount; 2) the derived amount by demand; 3) the amount affected
by period t
.
Function (8) gives us a clearexpression. It shows that the transportation capacity configuration is not affected by the direct operating
cost co but affected by the trucks holding
costcminversely. To managers, it means reducing
the trucks holding cost is more effective to improve the amount of optimal capacity. The greater the
trucks turnover coefficientφ is, or similarly, the
greater the capacity mismatching cost weight
coefficient α is, or the smaller the capacity
changing cost weight coefficient β is, the more
frequently the curve of y t( ) fluctuates, which
In real operation, as a general rule we cannot achieve such optimal capacity configuration as function (8) because the fleet is the actual virtual decision-maker and he will definitely configure his transport capacity in the light of his own benefits optimization not of the whole supply chain’s profits. The optimal capacity configuration strategy based on fleets’ benefits optimization is shown as function (13) which is quite different from function (8). It tells us that the dynamic capacity configuration strategies of port supply chains could not be coordinated without management intervening. Namely, the capacity decision made by the fleet cannot optimize the whole supply chain’s benefits. To avoid such efficiency loss, we could use the new freight charge mode called “service plus capacity” instead of present wholesale price charge mode based on the charge unit of per TEU per Kilometer. Such “service plus capacity” mode could be implemented by using the payment function of expression (14). If so, we could achieve the coordination and maximize the profits of the whole port supply chain from the view of long term performance.
ACKNOWLEDGEMENTS:
This work was supported by the National Social Science Foundation of China (No. 09CJY072) and the Subject Fund of Ningbo University (No. XKL11D2095). The author is very grateful for the anonymous referees’ constructive comments and suggestions.
REFRENCES:
[1] E. Notteboom, J-P Rodrigue, “Port
Regionalization: Towards a New Phase in Port
Development”[J] . Maritime Policy and
Management, 2005(32)3: 297~313.
[2] Michel Beuthe. “Freight transportation demand
elasticity's: a geographic multimodal
transpiration network analysis” [J].
Transportation Research Port E,2001(37):
253-266.
[3] H. Spiess, M. Florian, “Optimal strategies: A
new assignment model for transit networks” [J] Transportation Research Part B:
Methodological, 1989(23)2: 83~102.
[4] Peter Nikamp. “Comparative modeling
european of interregional transport applications
to multimodal freight transport”[J]. European
Journal of Operational Research,2004,155:
584-602.
[5] Chuanxu Wang, Liangkui Jiang. “Bi-level
Programming Based Optimization on Regional Port Inland Transportation Network”[J], Journal of Industrial Engineering and
Engineering Management. 2008(22)4: 67~71.
[6] Zhiwei Jin, “Strategies to Develop Collection
and Distribution Transportation Capacity of
Containers for Shanghai Port”[J] , China Ports,
2007(11): 25~27.
[7] Yun Liang, “Study on Optimization for
Collection and Distribution Network in Port
Logistics Based on Supply Chain”[D], Beijing
Jiaotong University, 2012.
[8] Yujiao Ma, “Research on Relevant Tissue of
Optimization of Collecting and Distributing
System in Port Logistics”[D], Beijing Jiaotong
University, 2012.
[9] Baige Zang, “The Optimal Model for Inland
Collection and Distribution Network of the
Container Port”[D], Dalian Maritime
University, 2011.
[10] Jieshuang Dong, “Optimal model of collection
and distribution system for the ports”[J]. Journal of University of Shanghai for Science
and Technology, 2007, 29(5):453-456.
[11] Lei Ma, “Research on Land
Collector-distributor Capacity and Configuration of
Ports”[D],Beijing Jiaotong University, 2009.
[12] Hao Zhang, “Forecasting Method of Port
Container Throughput Based on Optimal Linear Composite Prediction Model”[J], Journal of Wuhan University of Technology
(Transportation Science & Engineering), 2007