CLASSIC APRIORI: IMPLEMENTATION OF MODIFIED
APRIORI ALGORITHM IN MATLAB FOR PADDY CROPS
DISEASE PREDICTION USING DATA MINING
TECHNIQUES
1
S.A.RAMESH KUMAR,2Dr. K.RAMESH KUMAR
1Research Scholar, Department of Information Technology,Hindustan University,Chennai, ,Tamilnadu
2Associate Professor, Department of Information Technology, Hindustan University,Chennai, Tamilnadu
E-mail: [email protected]
ABSTRACT
Automation of essential processes in agriculture is becoming widespread, especially when fast action is required. However, some processes that could greatly benefit from some degree of automation have such difficult characteristics, that even small improvements pose a great challenge. This is the case of paddy disease diagnosis, a problem of great economic, social and ecological interest. Difficult problems like this often require a interdisciplinary approach to be tackled properly, as multifaceted issues can greatly benefit from the inclusion of different perspectives. In this context, this paper presents the most recent advances in research subjects such as data mining algorithm applied to paddy disease diagnosis, and give the solution, and discusses how those advances may be combined to support future developments towards more effective diagnosis tools. The paper finishes suggesting a possible solution to increase the degree of automation of paddy disease diagnosis tools.
Keywords: Classification, Association Set Rules, K-Nearest Neighbor, Apriori Algorithm Artificial Neural
1. INTRODUCTION
The use of automation in agriculture is not new, and as the cost of technology plummets, its use becomes increasingly widespread. However, the technical challenges vary greatly depending on the problem to be tackled. While some simpler automation systems, like timed irrigation, have been solved long ago, others require a much higher level of sophistication in order to become feasible. This is the case of automated disease diagnosis, and particularly so for paddy diseases.
Fast and reliable diagnosis of diseases is essential if the problem is to be handled properly, no matter if we are dealing with a person, an animal, or a plant. The best way to achieve that is by having a specialist readily available to assess the situation and to suggest some line of action. However, this is not always possible, especially in remote places. This is particularly true in the case of agriculture, as those are often located in places far from urban centers.
There are basically three approaches that can be used to overcome this problem. All three employ technological tools, but they possess different
degrees of sophistication and automation, as shown below:
- Remote diagnosis system: in this type of approach, the person interested in obtaining a
diagnosis sends information through some
communication channel (usually internet or telephone), and such an information is analyzed by a human specialist, who sends a diagnosis (or a request for more information) back to that person. Because it has a low level of automation, this approach tends to be time demanding. On the other hand, the involvement of a human specialist improves the chances of a correct diagnosis. This option should be preferred when there are no reliable methods with a higher degree of automation, which still is the case for the vast majority of cases.
disease, until the system has enough information to provide a diagnosis.
This may be considered a semi-automatic diagnosis method, as the computer program depends on a number of human inputs in order to work properly. The higher degree of automation with respect to the previous approach means that it will be faster. Another advantage of this kind of system over the remote one is that it is usually cheaper to maintain. On the other hand, the quality of the diagnosis will be only as good as the inference engine and the knowledge base employed in the system, and design flaws may lead to error. Since the system depends on human input to reach a diagnosis, and such an input is usually provided by a non-expert, this may also give rise to incorrect outputs. A discussion about this kind of tool, together with a brief description of some of the most relevant systems proposed so far.
- Image-based automatic systems: this kind of
system explores color and morphological
characteristics of an image of the symptoms to infer the disease. Since there is no human interaction, this kind of approach tends to be very fast. Moreover, such a high degree of autonomy means that a system like this may be used to monitor vast areas without the need for humans to go to the field. This implies that a really reliable image-based system may be a much more advantageous option in comparison with the other two approaches.
The problem is that achieving such a reliability is very challenging, being the main bottleneck for the dissemination of this kind of system. Despite the challenges involved, automatic diagnosis systems are becoming common in several areas of agriculture and medicine, but the difficulties involved in agriculture have prevented any method with focus on paddy to be proposed so far. To the author’s knowledge, the only work that has some relation with this kind of approach was proposed by (PARK; OH; HAN, 2007), which has the objective of providing a diagnosis by identifying pathogens in microscopic images. A deeper discussion about image-based automatic diagnosis systems.
Some disease diagnosis problems have already achieved a high degree of automation. In the case of paddy diseases, however, the successes have been limited to a handful of expert systems, most of them designed to deal with a single species and a limited set of diseases. This is due to the very difficult characteristics surrounding the problem,
such as the large variety of species, the symptoms heterogeneity, the difficulties involved in gathering data in the field. The use of digital imaging is particularly challenging: according to (ZION, 2012), "the sensing technology has to overcome limited visibility, temporal and spatial variations in lighting, varying distances and relative orientations between cameras and objects, motion and density of the monitored targets, and even lack of physical stability." Those challenges suggest that an interdisciplinary approach may be needed in order to increase the degree of automation in diagnosis. It is important to emphasize that a fully automated system for disease diagnosis in paddy would probably require very sophisticated artificial intelligence, capable of autonomously performing analysis based on images, biopsy samples, water samples, etc. Such a technology is far beyond what is available today.
In this context, the objective of this manuscript is to discuss some possible ways to gradually increase the automation of the process, by analyzing how the most current advances in areas such as expert systems for disease diagnosis in aquaculture,image-based disease diagnosis in agriculture (especially paddy), could be combined into a more effective diagnosis tool.
2. DATA MINING FUNCTIONALITIES
Functionalities of data mining are as follows-
- Characterization
Data characterization is a summarization of the general characteristics or features of objects in a target class of data. Relevant data to a user-specified class are collected by a database query and run through a summarization module to extract the essence of the data at different level of abstractions.
- Discrimination
Data discrimination is a comparison of the general features of target class data objects with the general features of objects from one or a set of contrasting class. Discrimination descriptions expressed in rule form are referred to as discriminant rules.
2.1 Association Analysis
on threshold called support and confidence. Association analysis is commonly used for market basket analysis. The discovery of association rule can help retailers to develop marketing strategies by gaining into which items are frequently purchase together.
For example- age (X,”20-29”)^F_income (X,”10-20k”) => dropout (X, “Yes”) [Support= 2%, confidence=60%]
Rule implies that 2%(support) are 20-29 year of age with an family income of 10-20k generally drop their study and 60% probability(confidence) that a student in this age and income group will withdraw from their study.
2.2 Classification and Prediction
Classification analyzes a set of training data and builds a model for each class based on the features in the data. This model is used to classify new objects and also known as supervised learning. Derived model may be represented in various forms, such as classification (IF- THEN) rules, decision trees, and neural network etc. A decision tree is a flow–chart like tree structure where each node denotes a test on an attribute value and each branch represents an outcome of the test. A neural network is a collection of linear threshold units that can be trained to distinguish objects of different classes. Classification can be used to predicting the class label of data objects. Classification predicts categorical labels (or discrete values), prediction models continuous- valued function.
2.3 Clustering
Clustering is an unsupervised learning, in which the class labels of the training samples are not known. Cluster is a collection of data objects that are similar to on one another. Similarity can be expressed by distance functions, specified by use experts. A good clustering method produces high quality clusters to ensure that inter- cluster (object of different class) similarity is low and the intra-cluster (object in a same class) similarity is high.
2.4 Evolution and Deviation Analysis
Evolution and deviation analysis pertain to the study, trend of object whose behavior changes over time. Evolution analysis models evolutionary trends in data, whereas deviation analysis, considers
differences between measured values and expected values.
3. OBJECTIVE OF THE STUDY
Data mining is the process of extracting patterns from the data and it is an automated extraction of hidden predictive information from large databases. The main aim of the proposed Classic Apriori Algorithm(MAA) is to maintain a good health in between the paddy are based on the performance provided by those crops by using association rule mining (ARM). Its objectives are to increase paddy plant health. Often, information related to paddy name, disease,Symptoms are analyzed by means of simulations, predictions and classification of customers.
• There are two main characteristics of plant
disease detection using machine-learning methods that must be achieved, they are: speed and accuracy. Hence there is a scope for working on development of innovative, efficient & fast interpreting algorithms which will help plant scientist in detecting disease.
• Work can be done for automatically
estimating the severity of the detected disease.
• The main outcome of this research is an
android based software tool to find and cure paddy diseases for farmers
• This work proposes two databases which
contain paddy disease syndromes images and treatment experiences which can further extendable.
• To identify the concepts and techniques
using ARM to improve the efficiency and effectiveness in a data mining environment
• To design and develop a software
prototype to prove the above concepts
• To test a prototype
3. MOTIVATION OF THE RESEARCH
As mentioned earlier, data mining has been widely used to solve various kinds of discovering a set of
association rules problems in numerous
more active research in order to find efficient approaches to address them, and the outcome of the research is still unsatisfactory.
• The ultimate goal of association rule is to
discriminate new rule data into the most likely of the specific predictive models, based on the induction model generated by the classifier. However, the association rule problem has become very difficult and computationally infeasible when the number of possible different combinations of variables are so high.
4. RELATED WORK
Z.Xue et al (2003) proposed Bayesian shape model (BSM) to find contour points in the face. A full-face model consisting of the contour points is designed to describe the face patch, using which the normalization of the extracted face patch can be performed efficiently. In BSM, the prototype of the face contour can be adjusted adaptively according to its prior distribution. Moreover, an affine invariant internal energy term is introduced to describe the local shape deformations between the prototype contour in the shape domain and the deformable contour in the image domain. The face patch is extracted and normalized using the piece-wise affine triangle warping algorithm[5].
A.Camarago et al (2009) proposed color
transformation method. This method converting the RGB image of the disease infected plant or leaf, into the H, I3a and I3b color transformations. The I3a and I3b transformations are developed from a modification of the original image in to color transformation to meet the requirements of the plant disease data set. The transformed image is then segmented by analyzing the distribution of intensities in a histogram. The threshold cut-off value is determined according to their position in the histogram. This technique is particularly useful when the target in the image data set is one with a large distribution of intensities [2].
S.L.S. Abdullah et al (2012) proposed improved
thresholding based technique for image
segmentation. Different illuminations may produce different color intensity of the object surface and thus lead to inaccurate segmented images and traditional methods were unable to produce good
quality segmented. Therefore, an improved
thresholding based segmentation integrated with an inverse technique (TsTN) that was able to partition
natural images correctly. The analysis results showed that TsTN has the ability to produce good quality segmented images for dark images. Furthermore, this segmentation technique was proven to be more accurate than the traditional thresholding and clustering techniques [1].
A.K Das et al (2012) proposed SVM and Bayes’ classifier to classify the diseases of rice plant leaf. An automated system has been developed to classify the leaf brown spot and the leaf blast diseases of rice plant based on the morphological changes of the plants caused by the diseases. Otsu method is used to isolate the infected region from the background. Radial distribution of the hue from the center to the boundary of the spot images has been used as features to classify the diseases by Bayes’ and SVM Classifier [3].
R.Lu et al (2013) proposed Support Vector Machine for classification and Otsu method for segmentation. This method automatically adjusts the classification hyper plane calculated by using linear SVM and requires minimum training and time. It also avoids the problems caused by variations in the lighting condition and color of the fruit. Disadvantage of this method is segmentation is not accurate [6]
Classification Rules
5.. RESULT AND DISCUSSION
Table 1. Result Of Classification Of Uninfected And Diseased Leaves
Image Type Success Rate (%)
Normal Paddy leaf Image 92
Brown Spot Image 97.5
[image:5.595.78.504.250.687.2]Blast Paddy Image 86
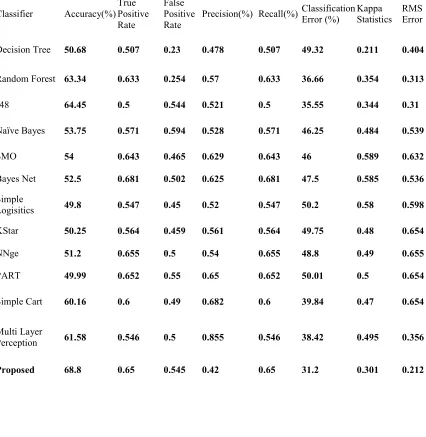
Table 2: Comparison Of Classification Error Of Algorithms
Classifier Accuracy(%)
True Positive Rate
False Positive Rate
Precision(%) Recall(%) Classification
Error (%)
Kappa Statistics
RMS Error
Decision Tree 50.68 0.507 0.23 0.478 0.507 49.32 0.211 0.404
Random Forest 63.34 0.633 0.254 0.57 0.633 36.66 0.354 0.313
J48 64.45 0.5 0.544 0.521 0.5 35.55 0.344 0.31
Naïve Bayes 53.75 0.571 0.594 0.528 0.571 46.25 0.484 0.539
SMO 54 0.643 0.465 0.629 0.643 46 0.589 0.632
Bayes Net 52.5 0.681 0.502 0.625 0.681 47.5 0.585 0.536
Simple
Logisitics 49.8 0.547 0.45 0.52 0.547 50.2 0.58 0.598
KStar 50.25 0.564 0.459 0.561 0.564 49.75 0.48 0.654
NNge 51.2 0.655 0.5 0.54 0.655 48.8 0.49 0.655
PART 49.99 0.652 0.55 0.65 0.652 50.01 0.5 0.654
Simple Cart 60.16 0.6 0.49 0.682 0.6 39.84 0.47 0.654
Multi Layer
Perception 61.58 0.546 0.5 0.855 0.546 38.42 0.495 0.356
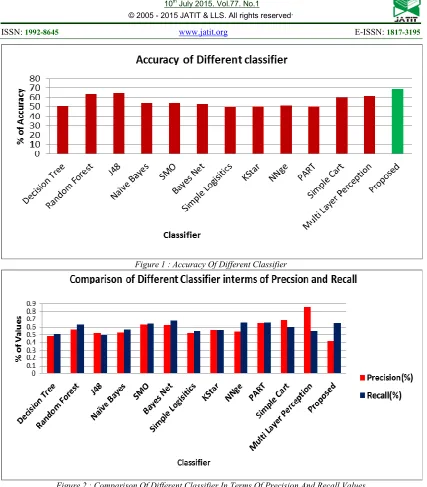
[image:6.595.87.514.83.570.2]
Figure 1 : Accuracy Of Different Classifier
Figure 2 : Comparison Of Different Classifier In Terms Of Precision And Recall Values
6. CONCLUSION
In the work, an automated system has been developed for detecting different types of paddy crop diseases. In the first stage, uninfected and the diseased leaves are classified based on the number of peaks in the histogram. Miss classification may occur due to shadow effect and color distortion of aging leaves. To compare the other, our classic apriori algorithm is better performance.
REFERENCES:
[1] Ashok Kumar. D,Kannathasan. N, “A Survey on
Data Mining and Pattern Recognition
Techniques for Soil Data Mining” IJCSI International Journal of Computer Science Issues, Vol. 8, Issue 3, No. 1, May 2011 ISSN (Online): 1694-0814.
[3] Darcy Miller, Jaki McCarthy, Audra Zakzeski, “A Fresh Approach to Agricultural Statistics: Data Mining and Remote Sensing” National Agricultural Statistics Service 3251 Old Lee Highway, Fairfax, VA 22030 - JSM 2009. [4] Kamalak Kannan. P,Hemalatha. H, “Agro
Genius: An Emergent Expert System for Querying Agricultural Clarification Using Data Mining Technique” International Journal of Engineering and Science ISBN: 2319-6483, ISSN: 2278-4721, Vol. 1, Issue 11 December 2012.
[5]Leisa J. Armstrong, Dean Diepeveen and Rowan Maddern, “The application of data mining techniques to characterize agricultural soil profiles”Volume 70,pages 85-100. Australian
Computer Society, Inc. Darlinghurst,
Australia, ISBN-978-1-920682-51-4.
[6] Lingxian Zhang, Xinxing Li, “The corn disease remote diagnostic system in China” Journal of Food, Agriculture & Environment Vol.10 (1): 617- 620. 2012.
[7] Ramesh Vamanan and K.Ramar, “Classification of Agricultural Land Soils A Data Mining Approach” International Journal on Computer Science and Engineering (IJCSE)-2012. [8] Sally Jo Cunningham and Geoffrey Holmes,
“Developing innovative applications in
agriculture using data mining”. Department of Computer Science, University of Waikato, Hamilton, New Zealand.
[9] Quinlan, J.R. C4.5: Programs for machine
learning. Morgan Kaufmann, SanMateo,
1993,CA.
[10] Wang, Y. and Witten, I.H. “Induction of model
trees for predicting continuousclasses.”
Proceedings of the Poster Papers of the
European Conference on MachineLearning,
Prague, 128-137,1997.
[11] Witten, Ian H., and Frank, Eibe (1999) Data Mining: Practical machine Learning Toolsand
Techniques with Java Implementations.
Morgan Kaufmann, San Francisco.
[12] KURNIAWATI, N. N. et al. Investigation on image processing techniques for diagnosing
paddy diseases. In: 2009 International
Conference of Soft Computing and Pattern Recognition. [S.l.: s.n.], 2009. p. 272– 277.
[13] Al Bashish, D.; BRAIK, M.; BANI-AHMAD,
S. A framework for detection and
classification of plant leaf and stem diseases. In: 2010 International Conference on Signal and Image Processing. [S.l.: s.n.],2010. p. 113–118.
[14] BARBEDO, J. Digital image processing techniques for detecting, quantifying and classifying plant diseases. SpringerPlus, v. 2, n. 660, December 2013.
[15] CAMARGO, A.; SMITH, J. S. Image pattern classification for the identification of disease causing agents in plants. Computers and Electronics in Agriculture, v. 66, n. 2, p. 121– 125, maio 2009.
[16] KURNIAWATI, N. N. et al. Investigation on image processing techniques for diagnosing
paddy diseases. In: 2009 International
Conference of Soft Computing and Pattern Recognition. [S.l.: s.n.], 2009. p. 272– 277. [17] MEUNKAEWJINDA, A. et al. Grape leaf
disease detection from color imagery using
hybrid intelligent system. In: 2008 5th
International Conference on Electrical
Engineering/Electronics, Computer,
Telecommunications and Information
Technology. Krabi: [s.n.], 2008. p. 513–516. [18] PHADIKAR, S.; SIL, J. Rice disease
identification using pattern recognition
techniques. In: 2008 11th International
Conference on Computer and Information Technology. [S.l.: s.n.], 2008. p. 420–423. [19] PUGOY, R.; MARIANO, V. Automated rice
leaf disease detection using color image
analysis. In: 3rd International Conference on
Digital Image Processing. [S.l.: s.n.], 2011. v. 8009, p. F1 – F7.
[20] PYDIPATI, R.; BURKS, T.; LEE, W. Statistical and neural network classifiers for citrus disease detection using machine vision. Transactions of the ASAE, v. 48, n. 5, p. 2007–2014, 2005.
[21] PYDIPATI, R.; BURKS, T.; LEE, W. Identification of citrus disease using color texture features and discriminant analysis. Computers and Electronics in Agriculture, v. 52, n. 1-2, p. 49–59, June 2006.
[22] WANG, H. et al. Application of neural networks to image recognition of plant
diseases. In: Proceedings of the 2012
International Conference on Systems and Informatics (ICSAI). [S.l.: s.n.], 2012. p. 2159–2164.
[23] XU, G. et al. Use of leaf color images to identify nitrogen and potassium deficient
tomatoes. Pattern Recognition Letters, v. 32,
n. 11, p. 1584–1590, ago. 2011.
2008 Congress on Image and Signal Processing. [S.l.: s.n.], 2008. p. 262–267. [25] R. K. Webster, In: Rice Blast Disease
Identification Guide. Davis, Dept. of Plant Pathology, University of California, 2000 [26] H. Sato, I. Ando, H. Hirabayash, Y. Takeuchi,
S. Arase, J. Kihara, H. Kato,T. Imbe, and H. Nemoto, “QTL Analysis of Brown Spot Resistance in Rice(Oryza Sativa,” Breeding Science, vol. 58, pp. 93-96, 2008.
[27] H. L. Khatibl, F. Hawels, H. Hamdi, and N. L. Mowelhi. “Spectral Characteristics Curves of Rice Plants Infected by Blast,” IEEE Geoscience and Remote Sensing Symposium, vol. 2, pp. 526-528, 1993.
[28] T. Kobayashi, E. Kanda, K. Kitada, K. Ishiguro, and Y. Torigoe, “Detection of Rice Panicle Blast with Multispectral Radiometer and the Potential of Using Airborne Multispectral Scanners,” Phytopathology, vol. 91, pp.316-323, 2001.
[29 P. J. Pinter, Jr. J. L. Hatfield, J. S. Schepers, E. M. Barnes, M. S. Moran, C. S. T. Daughtry, and D. R. Upchurch, “Remote Sensing for
Crop Management,” Photogrammetric
Engineering and Remote Sensing, vol. 69, pp. 647-664, 2003.
[30] S.A. Ramesh Kumar and K. Ramesh Kumar, “ Middle-East Journal of Scientific Research”, A Novel and High Speed Technique for Paddy Crops Disease Prediction in Wireless
Tele-Agriculture Using Data Mining