PARAMETER OPTIMIZATION OF PROPORTIONAL
INTEGRAL CONTROLLER IN THREE-PHASE FOUR-WIRE
GRID-CONNECTED INVERTER USING ANT COLONY
OPTIMIZATION
1,2
SUSATYO HANDOKO, 1SASONGKO P. HADI, 1SUHARYANTO, 1EKA FIRMANSYAH 1Department of Electrical Engineering and Information Technology, UGM, Yogyakarta, Indonesia
2
Department of Electrical Engineering, Diponegoro University, Semarang, Indonesia
E-mail: susatyo_s3_09@mail.ugm.ac.id, sasongko@te.ugm.ac.id, suharyanto@ugm.ac.id,
eka.firmansyah@ugm.ac.id
ABSTRACT
This paper presents the parameter optimization of proportional integral (PI) controller in four-leg inverter for DG application when installed in a three-phase four-wire distribution system. The inverter can be utilized as power converter to inject power generated from renewable source to the grid and as shunt active power filter to compensate load current harmonics, load reactive power demand, and current unbalance. To achieve those functions, a reference current needs to be determined. In this study, DC voltage regulator used PI controller to generate the peak value of reference grid current. Optimal tuning of PI gain was required to obtain the best performance of PI controller. An algorithm based on the ant colony optimization (ACO) method was used to optimize the PI parameters. The objective function of optimization was to minimize the integral time absolute error (ITAE) of dc-link voltage and average total harmonic distortion of grid currents (THDiave). The usefulness of the approach was demonstrated by a simulation.
Keywords:Grid-Connected Inverter, PI Controller, ACO, ITAE, THDi
1. INTRODUCTION
For many years, fossil fuels have been the primary source of the energy and supply about 75 percent of total global energy demand. The increase of world energy demand, air pollution, global warming, and extinction of fossil fuels have made it necessary to consider renewable sources as a future energy solution. In recent years, the interest in using renewable energy for power generation in many countries has rapidly increased.
DG sources such as wind, photovoltaic (PV), micro turbines and fuel cells are being connected rapidly to the electricity network. Most of DG units are interfaced with the utility through power electronics, which facilitate the operation and control of DGs. Many control strategies for grid-connected inverter have now been introduced [1]-[7]. Some of them use four-leg inverter [5]-[1]-[7]. A number of different control strategies have been introduced over the last few years such as: predictive controls [1], [2], hysteresis controls [3], [7], and power balance controls [4]-[6]. A method to select the bandwidth of hysteresis band optimally
has also been presented [3]. The power balance strategy is one of control techniques, which are used to control the injected power in the inverter for DG application [4]-[6].
In the grid connected mode, it is important to regulate the output current and to improve the dynamic response of the grid. The appropriate parameters of controller enable to enhance the system stability and achieve ideal dynamic response characteristics. However, studying on how to select the parameters is deemed essential.
are designed optimally to improve the stability
response of the microgrid [12].
In this paper, an optimal method for tuning the PI parameters in DC voltage regulator of grid-connected inverter system is presented. Recently, ant colony algorithm is applied in various fields, such as power grid planning, control system parameter optimizing and constrained load flow problem. This paper proposed the ant colony algorithm to tune the PI controllers at a specific operating point and system parameters to enhance the performance. The DG unit here was represented by constant dc current source. In addition, the ITAE index and THDi index were applied to respectively evaluate the dynamic responses and harmonics. The ITAE and THDi indexes were used as the performance indexes for objective function (OF) of the optimization program.
2. SYSTEM CONFIGURATION
[image:2.595.92.290.425.615.2]The structure of three-phase four-wire grid-connected inverter for DG application is presented in Figure 1. This figure shows the configuration of grid-connected inverter in which a voltage source inverter acts as a key element of a DG system.
Figure 1: System Configuration
The inverter delivered power from renewable energy source (RES) to grid and solved the quality problem. The four-leg inverter was used to compensate the neutral current of network. This inverter was coupled at the point of common coupling (PCC) via coupling inductance. The switching pulses for the gate drives of inverter were generated by hysteresis current controller. In this system, current source was used to represent the
RES. On the other side, the RES might be an AC source with rectifier.
The control scheme comprised three main components: DC voltage regulator, phase-locked loop and hysteresis current controller. DC voltage regulator was applied to regulate the exchange of active power between RES and grid. Meanwhile, phase-locked loop (PLL) was to track the phase of voltage and hysteresis current controller was used to generate the switching pulses of IGBT.
2.1 DC Voltage Regulator
The DC voltage was regulated to be constant. Through this DC voltage regulator, the power flow in the grid system was regulated. A PI controller was implemented in DC voltage regulator to generate a reference peak current for grid. The dc-link voltage error was obtained by:
Vdc(err) = Vdc(ref) - Vdc (1)
[image:2.595.309.501.456.503.2]This error was given to a PI regulator to maintain a constant dc-link voltage. The output of DC voltage regulator was current Im, - a peak value of reference current flowing in the grid. This current was then be synchronized with the grid voltage through PLL. Figure 2 presents the block diagram of DC voltage regulator.
Figure 2: Block Diagram of DC Voltage Regulator
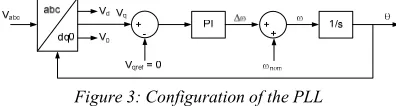
2.2 Phase-Locked Loop
The phase-locked loop (PLL) technique has been used as a common way of recovering the phase and frequency information in electrical systems. In this study, it was used to generate the current references synchronized with the grid voltages. Figure 3 shows the basic configuration of the PLL system.
Figure 3: Configuration of the PLL
[image:2.595.307.505.632.685.2]voltage angular frequency ω that after integration
provided the grid voltage phase θ. In this system, the grid voltage can be expressed as:
( ) T
m abc V v + − = 3 2 cos 3 2 cos cos
. θ θ π θ π (2)
where vabc = [va vb vc]T. Equation (2) can be expressed in a synchronousreference frame as:
( )
abcdq T v
v 0= θ). (3)
where vdq0 = [vd vq v0]T and T(θˆ ) denotes the matrix given by:
+ − + − = 2 1 2 1 2 1 3 2 ˆ sin 3 2 ˆ sin ˆ sin 3 2 ˆ cos 3 2 ˆ cos ˆ cos . 3 2 ) ˆ
( θ θ π θ π
π θ π θ θ θ
T (4)
The instantaneous values of reference three-phase grid currents were then computed as
) cos( . * θ m a I
I = (5)
) 120 cos( . * o m b I
I = θ− (6)
) 240 cos( . * o m c I
I = θ− (7)
The reference current for the grid neutral current was considered as zero and expressed as
0
*
=
nI
(8)2.3 Hysteresis Current Controller
In addition to its function as a power converter to inject power to the system, inverter also acts as a shunt active power filter. Hysteresis current controller acts to generate the switching pulses of IGBT. The actual currents are compared with their reference currents with a predefined hysteresis band. The switching pattern of IGBT can be explained as:
If (Ia* - Ia) = +hb, then upper switch S1 will be ON and lower switch S4 will be OFF in the phase “a” leg of inverter.
If (Ia* - Ia) = -hb, then upper switch S1 will be OFF and lower switch S4 will be ON in the phase “a” leg of inverter.
where hb is the width of hysteresis band. Similarly, switching pulses for other three legs can be derived.
3. PARAMETER OPTIMIZATION
Parameters Kp and Ki in DC voltage regulator are the optimized parameters. Selecting the best value for these parameters bring some significant effects on controller operation. The selection of these parameters is varied in ways such as trial and error method, Ziegler-Nichols, or intelligent systems. Ant colony optimization (ACO) algorithm is one of the intelligent systems that can be applied to the controller and searches for the optimal values of gains.
3.1 Ant Colony Optimization (ACO) Algorithm
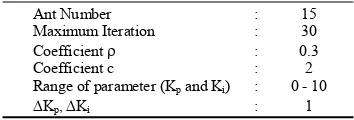
[image:3.595.316.493.406.466.2]The method of ant colony optimization (ACO) is inspired by the behavior of real ants in finding paths from the colony to the food. The route is taken as optimization parameters Kp and Ki. The number of routes is a parameter entered at the beginning of the simulation. The initial values of variables used for the algorithm are determined by trial and error as shown in Table 1.
Table 1: Initial Values of Parameter in ACO
Ant Number : 15
Maximum Iteration : 30
Coefficient ρ : 0.3
Coefficient c : 2
Range of parameter (Kp and Ki) : 0 - 10
∆Kp, ∆Ki : 1
3.2 Objective Function
Heuristic methods such as genetics algorithm, particle swarm optimization (PSO), and ACO use objective function for the optimization process. This paper used integral time absolute error (ITAE) of dc-link voltage and average THD of grid currents (THDiave) as the objective function to obtain the optimal parameters of the PI controller Kp dan Ki in DC voltage regulator. THDiave was the average of THDi phase a, phase b, and phase c. Objective function (OF) for this optimization is presented below.
OF = Min(C1 x ITAE + C2 x THDiave) (9)
where
∫
∫
= −= t dcref dc
t
r t tdt V V t tdt
e ITAE
0 ( ) 0 . ) ( . ) ( 3 c b a ave THDi THDi THDi
THDi = + +
C1, C2 = constant
It is possible to change the importance of some criteria and events in optimization problem. The value of the constant C1 and C2 decides which event is more important from a control design point of view, and which criteria in a particular event should be emphasized. The values of Kp and Ki for which the corresponding objective function is minimum were taken as the optimized gain values.
4. SIMULATION RESULTS AND ANALYSIS
[image:4.595.309.501.249.423.2]Simulations studies were performed to predict the performance of the proposed method. The parameters selected for simulation studies are presented in Table 2.
Table 2: System Parameters 3-phase Supply (r.m.s) : Vg=380 V, 50 Hz
Source Inductance : Lg=1 mH
DC-Link Capacitance & Voltage : Cdc=3 mF, Vdc=750V
Coupling Inductance : Lsh=2 mH
The load used for generating harmonics and imbalance was composed of: a) a three-phase full wave diode rectifier feeding an RL network consisting of R1 = 10 Ω and L1 = 10 mH, b) a three-phase balanced load consisted of RA = RB = RC = 5 Ω and LA = LB = LC = 5 mH, and c) a single phase load in phase A consisted of RAN = 15 Ω and LAN = 10 mH.
Hysteresis Current Controller
Load
DC Voltage Regulator
PLL
RES CDC
3 Phase
Source PCC
Inverter Current Sensors
Voltage Sensors
Voltage Sensor Vdc(ref)
Lf
[image:4.595.94.283.327.367.2]Lg
Figure 4: Simulation Block
Figure 4 shows the simulation block of the designed system. A four-leg current was controlled to achieve balanced sinusoidal grid currents with unity power factor. Ant colony optimization algorithm was simulated in Matlab M-File.
4.1 Results
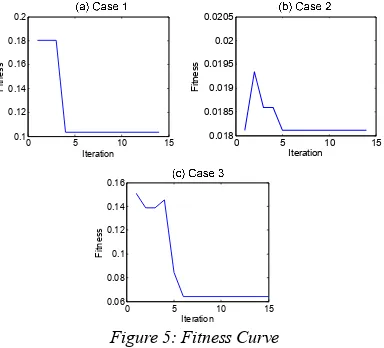
Three case studies including case 1 (C1 = 1, C2 = 0), case 2 (C1 = 0, C2 = 1), and case 3 (C1 = C2 = 0.5) have been studied in this research. The system was turned on at t = 0 s and simulation ran until t = 0.2 s. Figure 5 shows the fitness curve for case 1, case 2, and case 3. Optimization calculations for case 1 and case 2 achieved convergent on the 14th iteration while case 3 was on the 15th iteration.
0 5 10 15
0.1 0.12 0.14 0.16 0.18 0.2
Iteration
F
it
n
e
s
s
0 5 10 15
0.018 0.0185 0.019 0.0195 0.02 0.0205
Iteration
F
itn
e
s
s
0 5 10 15
0.06 0.08 0.1 0.12 0.14 0.16
Iteration
F
itn
e
s
s
Figure 5: Fitness Curve
[image:4.595.93.289.489.668.2]Table 3 presents the comparison of the value of system indexes. Optimization for case 1 and case 3 produced the comparable parameter values (Kp and Ki). As seen Table 3, the ITAE for case 2 (0.3274) was about three times higher compared to the one in case 1 (0.1033). However THDi value was almost equal for both cases. Because the weight given to ITAE and THDi in case 3 was equal (C1 = C2 = 0.5), the result of optimization for case 3 was then closer to the result for case 1.
Table 3: Comparison of Indexes Parameter
and indexes
Non optimized
Optimized
Case 1 Case 2 Case 3
Kp 5 2 1 2
Ki 5 6 10 6
ITAE 0.8871 0.1033 0.3274 0.1033 THDiave 0.0401 0.0247 0.0181 0.0247
Iteration - 14 14 15
4.2 Analysis
[image:4.595.305.508.569.671.2]s in which switching pulses of IGBT were blocked [image:5.595.309.505.309.398.2]
making the inverter not working; (b) tB = 0.1 - 0.2 s in which the inverter functioned but without any power injection from RES. This made the inverter only functioning as an active power filter; and (c) tC = 0.2 - 0.3 s in which the inverter worked and RES injected power to grid, thus inverter played two functions both as a converter to inject power and as an active power filter.
Figure 6 shows the waveforms for Kp = 5 and Ki = 5 (non optimized case). Figure 6(a) shows that load currents were unbalanced and non sinusoidal. When t = 0 - 0.1 s, the inverter did not function, thus making the grid currents unbalanced and non sinusoidal. At t = 0.1 s, average THDi of grid currents was at 9.623 %.
(a) Load Currents
(b) Grid Currents
(c) Inverter Currents
(d) DC Voltage
Ia Ib Ic In
Iga Igb Igc Ign
IinvaIinvb Iinvc Iinvn A
A
A
V
A
A
[image:5.595.91.289.328.570.2]A
Figure 6: Waveforms for Kp = 5 and Ki = 5
(non Optimized Case)
As shown in Figure 6(c), the inverter starts working to compensate load current harmonic, load reactive power, and current unbalance at t = 0.1 s. In Figure 6(a), the load currents (Ia, Ib, Ic) are non-sinusoidal and neutral current (In) flowing due to nonlinearities load. By contrast, the grid currents (Iga, Igb, Igc) as shown in Fig. 6(b) remain sinusoidal. There is no current in the grid neutral current (Ign). Fig. 6(c), meanwhile, shows inverter currents (Iinva, Iinvb, Iinvc, Iinvn). The load neutral current (In) will be supplied through the fourth leg of inverter.
Figure 6(d) shows that DC voltage decreased for 0.1 – 0.12 s, but after t = 0.12 s, this voltage increased to a voltage about 800 V and
subsequently turned slowly into 750 V. At t = 0.2 s, the DC voltage was 787.3 V. For t = 0.1 – 0.2 s, grid current to be balanced and THDiave decreased. At t = 0.2 s, THDiave of grid currents was at 3.703 %. At t = 0.2 s, RES started injecting power. Figure 6(b) shows that the grid currents slightly decreased after t = 0.2 s. As shown in Figure 6(d), DC voltage did not change significantly at t = 0.2 s. Average THD of grid current was at 4.103 % at 0.3 s.
Figure 7 shows the grid voltage and current in phase showing the achievement of unity power factor (UPF). It is then proven that inverter could be used to compensate load reactive power demand. Power factor (PF) prior to compensation at 0.95 came to be at 0.99 after compensation.
Figure 7: Grid Voltage, Grid Current, and Load Current
(a) Load Currents
(b) Grid Currents
(c) Inverter Currents
(d) DC Voltage
Ia Ib Ic In
Iga Igb Igc Ign
IinvaIinvb Iinvc Iinvn A
A
A
V
A
A
[image:5.595.306.507.422.661.2]A
Figure 8: Waveforms for Kp = 2 and Ki = 6
(Optimized Case 1 and Case 3)
inverter started functioning, DC voltage
immediately increased to above 750 V and quickly dropped back to 750 V. As shown in Figure 8(b), grid current slightly decreased at 0.2 s because RES started injecting power. Figure 8(d) shows that DC voltage also slightly increased as RES started injecting power.
Figure 9 shows the waveforms for Kp = 1 and Ki = 10 (optimized - case 2). For these parameters, the THDiave was the lowest when compared with the case without any optimization (Kp = 5 and Ki = 5) and optimization case 1 and case 3 (Kp = 2 and Ki = 6). THDiave was at 1.662 % at 0.2 s and at 1.990 % at 0.3 s. As shown in Figure 9(d), DC voltage slightly increased when the inverter started working at t = 0.1 s and when RES started injecting power at t = 0.2 s. DC voltage was 745.7 V at t = 0.2 s and 755.1 V at 0.3 s.
(a) Load Currents
(b) Grid Currents
(c) Inverter Currents
(d) DC Voltage
Ia Ib Ic In
Iga Igb Igc Ign
Iinva Iinvb Iinvc Iinvn A
A
A
V
A
A
[image:6.595.304.509.122.266.2]A
Figure 9: Waveforms for Kp = 1 and Ki = 10
(Optimized Case 2)
The resume of simulation results are listed in Table 4, showing THDiave and DC voltage at t = 0.1, 0.2, and 0.3 seconds.
These results indicated that the best harmonic was obtained from optimization case 2. For the response of DC voltage, optimization produced a better performance compared to the one minus optimization. At t = 0.2 s, the DC voltage in case 1 and case 3 (751.9 V) was closest to the reference DC voltage (750 V). However at t = 0.3 s, the DC voltage for all optimization cases discussed were almost equal.
Table 4: Resume of Simulation Results
Result Non
optimized
Optimized Case 1 Case 2 Case 3
THDiave (%)
t = 0.1 s 9.623 9.623 9.623 9.623 t = 0.2 s 3.703 2.208 1.662 2.208 t = 0.3 s 4.103 2.427 1.990 2.427 Vdc (V)
t = 0.1 s 684.6 684.6 684.6 684.6 t = 0.2 s 787.3 751.9 745.7 751.9 t = 0.3 s 774.8 755.9 755.1 755.9
5. CONCLUSION
This paper has presented the parameter optimization of PI controller of grid-connected inverter for DG application to enhance the power quality at PCC. The inverter was utilized to inject power generated from RES to PCC and operated as a shunt active power filter.
The optimization of PI parameters could be used to improve dynamic response and THDi. In this case, parameters Kp and Ki obtained by minimizing ITAE were different from the one obtained by minimizing THDi.
Optimization by means of ACO required a quite long time. However, when compared with other heuristic methods such as genetic algorithms and PSO, this algorithm was still faster. In future, the research will continue with the optimization of
grid-connected inverter parameters for DG
application based on fuzzy logic control.
REFERENCES:
[1] Espi, J.M., Castello, J., García-Gil, R., Garcera, G., Figueres, E., ”An Adaptive Robust Predictive Current Control for Three-Phase Grid-Connected Inverters“, IEEE Transactions
on Industrial Electronics, Vol. 58, No. 8, 2011,
pp. 3537-3548.
[2] Fanbo He, Zhengming Zhao, Ting Lu, Liqiang Yuan, “Predictive DC Voltage Control for Three-phase Grid-connected PV Inverters Based on Energy Balance Modeling”, 2ndIEEE International Symposium on Power Electronics
for Distributed Generation Systems (PEDG),
June 16-18, 2010, pp. 516-519.
[image:6.595.89.288.350.593.2]Renewable Energy (ICPERE), July 3-5, 2012,
pp. 1-8.
[4] Singh, B., Shahani, D.T., Verma, A.K., “Power Balance Theory Based Control of Grid
Interfaced Solar Photovoltaic Power
Generating System with Improved Power Quality“, IEEE International Conference on Power Electronics, Drives and Energy Systems
(PEDES), December 18-19, 2012, pp. 1-7.
[5] Singh, M., Khadkikar, V., Chandra, A., Varma, R.K., “Grid Interconnection of Renewable Energy Sources at the Distribution Level with Power-Ouality Improvement Features”, IEEE
Transactions on Power Delivery, Vol. 26, No.
1, 2011, pp. 307-315.
[6] Ilavarasi, V., Rajan, C.C.A., “Power Quality Improvement in Grid connected System using Four Leg VSI”, International Conference on
Advances in Engineering, Science and
Management, March 30-31, 2012, pp. 540-546.
[7] Xiaoyong Zhang, Jun Wang, Chuan Li,
“Three-Phase Four-Leg Inverter Based on Voltage Hysteresis Control“, International
Conference on Electrical and Control
Engineering (ICECE), June 25-27, 2010, pp.
4482-4485.
[8] Singh, R., Singh, A.K., Kumar, P.,
“Comparison of three evolutionary algorithms for harmonic mitigation using SAPF”, 6th IEEE International Conference on Industrial
and Information Systems (ICIIS), August
18-19, 2011, pp. 392-397.
[9] Yiguang Chen, Xin Gu, Yonghuan Shen,
Shengzhi Xing, “Optimization of Active Power Filter System PI Parameters Based on
Improved Ant Colony Algorithm”,
Proceedings of the 2006 IEEE International
Conference on Mechatronics and Automation,
June 25-28, 2006, pp. 2189-2193.
[10]Yao Shujun, Hu Yanan, Bao Mingran, Han Minxiao, “Parameter optimization of PI controller in PV inverter”, 2nd IET Renewable
Power Generation Conference (RPG),
September 9-11, 2013, pp. 1-4.
[11]Al-Saedi, W., Lachowicz, S.W., Habibi, D., “An optimal current control strategy for a
three-phase grid-connected photovoltaic
system using Particle Swarm Optimization”,
IEEE Power Engineering and Automation
Conference (PEAM), September 8-9, 2011, pp.
286-290.
[12]Hassan, M.A., Abido, M.A., “Dynamic
performance improvement of an inverter-based grid-connected microgrid”, International Conference on Renewable Energy Research
and Applications (ICRERA), October 20-23,