INTRODUCTION
Mammalian embryonic development is characterized by an initial pre-implantation phase that serves to prepare the embryo to attach to the uterine wall. This involves the formation of a blastocyst, a hollow structure consisting of an outside cell layer that accommodates an eccentrically located inner cell mass (ICM). The outside layer, or trophectoderm (TE), establishes the connection to the uterus, whereas the ICM gives rise to the fetus and additional extra-embryonic tissues.
The mechanisms of morphogenesis and patterning of the blastocyst have been addressed in many studies during the last decades (Rossant, 2004; Rossant and Tam, 2004), but conclusive models for these processes are still lacking. Three models currently exist. The pre-patterning model suggests that blastocyst patterning and morphogenesis can already be anticipated at the egg stage (Zernicka-Goetz, 2002; Gardner and Davies, 2003; Gardner, 2007). A certain cleavage pattern may establish differences in the developmental potential of 4-cell stage blastomeres, possibly through an epigenetic mechanism (Piotrowska-Nitsche et al., 2005; Piotrowska-Nitsche and Zernicka-Goetz, 2005; Torres-Padilla et al., 2007). However, no reproducible molecular organization of the egg with relevance to lineage segregation in the blastocyst has been identified thus far. The regulative model suggests that differences between blastomeres with relevance for lineage divergence appear after compaction (8-cell), consistent with the highly regulative nature of the early mouse embryo (Johnson and McConnell, 2004). It has been suggested that the TE and ICM are specified on the basis
of the blastomeres’ positions [inside-outside hypothesis (Tarkowski and Wroblewska, 1967)], so that those on the outside will form TE, and those on the inside ICM. Epithelial maturation may be involved in the specification process (Johnson and Ziomek, 1981; Plusa et al., 2005; Vinot et al., 2005). Epithelialization and/or microtubule reorganization at compaction results in an apical-basal organization of the cells along the radial axis, and cleavage perpendicular to this axis may give rise to two distinct daughter cells: a polar cell on the outside and an apolar cell on the inside (Johnson and Ziomek, 1981; Houliston et al., 1989; Yamanaka et al., 2006). Evidence suggesting that morphogenesis of the blastocyst is not pre-determined (Alarcon and Marikawa, 2003; Chroscicka et al., 2004; Louvet-Vallee et al., 2005; Motosugi et al., 2005; Kurotaki et al., 2007) supports the regulative model. Eccentric positioning of the blastocyst cavity, driven by mechanical constraints during cavity expansion, specifies its embryonic-abembryonic axis (Alarcon and Marikawa, 2003; Motosugi et al., 2005; Kurotaki et al., 2007). The third, so-called cryptic pre-formation model suggests that cleavage patterns influence the future allocation of cells within the blastocyst and thereby their fate (Graham, 1971). Although both blastomeres at the 2-cell stage contribute to the inside and outside population at morula and blastocyst stage, a preference of the descendants of the earlier dividing cell to locate on the inside has been observed (Surani and Barton, 1984). This model forms a bridge between the other two models, since it appreciates the highly regulative nature of the mouse embryo while also accommodating the influence of the history of a cell on its fate.
The TE versus ICM population has been proposed to be regulated by the POU-domain transcription factor Oct4 (also known as Pou5f1 – Mouse Genome Informatics) (Okamoto et al., 1990; Rosner et al., 1990; Scholer et al., 1990) and the caudal-like transcription factor Cdx2 (Beck et al., 1995; Strumpf et al., 2005), with slight differences between inside and outside cells in Oct4 and Cdx2 protein levels that are amplified through reciprocal inhibition to give a mutually exclusive pattern of Cdx2 on the outside and Oct4 in the inside (Niwa et al., 2005). Although Cdx2 was thought to be the key
Stochastic patterning in the mouse pre-implantation embryo
Jens-Erik Dietrich* and Takashi Hiiragi*,†Mouse pre-implantation development gives rise to the blastocyst, which is made up of at least three distinct cell types: the
trophectoderm (TE) that surrounds a cavity, and an inner cell mass (ICM) comprising the primitive endoderm (PE) and epiblast (EPI). However, the underlying mechanisms involved in patterning the cleavage-stage embryo are still unresolved. By analyzing the distribution of the transcription factors Oct4 (Pou5f1), Cdx2 and Nanog at precisely defined stages in pre-implantation
development, we were able to identify critical events leading to the divergence of TE, EPI and PE lineages. We found that Oct4 is present in all cells until late blastocyst, gradually disappearing from the TE thereafter. The expression patterns of both Cdx2 and Nanog exhibit two specific phases, culminating in their restriction to TE and EPI, respectively. In the first phase, starting after compaction, blastomeres show highly variable Cdx2 and Nanog protein levels. Importantly, the variability in Nanog levels is
independent of position within the morula, whereas Cdx2 variability may originate from asymmetric cell divisions at the 8-cell stage in a non-stereotypic way. Furthermore, there is initially no reciprocal relationship between Cdx2 and Oct4 or between Cdx2 and Nanog protein levels. In the second phase, a definite pattern is established, possibly by a sorting process that accommodates intrinsic and extrinsic cues. Based on these results, we propose a model in which early embryonic mouse patterning includes stochastic processes, consistent with the highly regulative capacity of the embryo. This may represent a feature unique to early mammalian development.
KEY WORDS: Embryonic patterning, Lineage specification, Mouse pre-implantation embryos
Development 134, 4219-4231 (2007) doi:10.1242/dev.003798
Max-Planck Institute of Immunobiology, Department of Developmental Biology, Freiburg i. Br., Germany.
*Present address: Max-Planck Institute for Molecular Biomedicine, Mammalian Development Laboratory, Münster, Germany
†Author for correspondence (e-mail: hiiragi@mpi-muenster.mpg.de)
Accepted 31 August 2007
D
E
V
E
LO
P
M
E
N
4220
molecule for the TE lineage, this protein appears to be dispensable for TE specification, since Cdx2–/–embryos form an expanded blastocyst including the TE but fail to maintain TE function (Strumpf et al., 2005; Tolkunova et al., 2006) (A. Tomilin, personal communication). Epiblast (EPI) and primitive endoderm (PE) are marked by the homeodomain protein Nanog (Chambers et al., 2003; Mitsui et al., 2003; Strumpf et al., 2005; Chazaud et al., 2006) and the transcription factor Gata6, respectively (Chazaud et al., 2006). Establishment of the reciprocal pattern within the ICM is mediated through the Grb2-Mapk signaling pathway (Chazaud et al., 2006). How initial differences among cells of the ICM are established is not known.
Thus, the mechanism(s) that initiates molecular differences between blastomeres and the ultimate lineage specification in the pre-implantation embryo remains unclear. To address the question of how embryonic patterns are established in early mouse development at the molecular level, we analyzed Oct4, Cdx2 and Nanog protein distribution at precisely defined stages from compaction until late blastocyst stage, a critical time period for the initial lineage segregation. Based on our identification of characteristic events involved in establishing molecular differences among individual cells, we propose a model for patterning in the early mouse embryo that may include stochastic processes.
MATERIALS AND METHODS
Embryo collection, synchronization and staging
Zygotes were recovered from superovulated (C57BL/6xC3H) F1 female mice mated with (C57BL/6xC3H or C57BL/6xDBA/2) F1 male mice 18-22 hours after injection of human chorionic gonadotropin (hCG, 5 IU). After brief treatment with hyaluronidase (300 U/ml), zygotes were washed with H-KSOM-AA (KSOM with amino acids and 21 mM Hepes) several times and cultured in a microdrop of H-KSOM-AA covered with mineral oil (Acros Organics, Fair Lawn, NJ) in 6.3% CO2at 37°C. Embryos were
synchronized at the onset of compaction by selecting and grouping them using a stereomicroscope every hour starting from 60 hours until 70 hours after hCG (hp-hCG) injection. Following in vitro culture, embryos were fixed for immunohistochemistry every 5 hours starting from the onset of compaction (0 hours) until 55 hours post-compaction (hp-c) as described below (Fig. 1).
Control embryos developed in vivo were isolated at 70 (n=9 for Cdx2 and Nanog, n=5 for Oct4; about 10 hp-c), 90 (n=4 for Cdx2 and Nanog, n=3 for Oct4; about 30 hp-c) and 115 (n=6 for Cdx2 and Nanog; about 55 c) hp-hCG.
Immunohistochemistry
Embryos were washed in PBS and fixed in 4% paraformaldehyde (PFA; Sigma, P6148) in PBS for 10-15 minutes at room temperature. For single blastomere and denuded embryo stainings 1-3% bovine serum albumin (BSA; Sigma, A9647) was added to all solutions except PFA. After washing with 0.1% Tween 20 (Sigma, P7949) in PBS (PBS-T), embryos were
permeabilized in 0.25% Triton X-100 (Sigma, T8787) in PBS for 30 minutes at room temperature, washed in PBS-T, blocked with 3% BSA in PBS-T (blocking solution), and incubated with the following primary antibodies for 1 hour at room temperature in blocking solution: mouse monoclonal anti-Oct4 (Santa Cruz Biotechnology, sc-5279, 1:100 dilution); rabbit polyclonal anti-Cdx2 (Beck et al., 1995) (kindly provided by A. Tomilin, Max-Planck Institute for Immunobiology, Freiburg, Germany; 1:100 dilution) or mouse monoclonal anti-Cdx2 (BioGenex, MU392-UC, 1:100-200 dilution); rabbit polyclonal anti-Nanog antibody (kindly provided by S. Yamanaka, Institute for Frontier Medical Sciences, Kyoto University, Japan; 1:400 dilution). Nanog expression pattern was confirmed using goat anti-mouse Nanog (R&D Systems, AF2729; 0.4 g/ ml) on embryos fixed at 80 hp-hCG (data not shown). After washing in blocking solution, embryos were incubated with the following secondary antibodies for 1 hour at room temperature: Alexa Fluor 488 goat anti-rabbit (Molecular Probes, A11034, 1:100 dilution), Alexa Fluor 546 goat anti-mouse (Molecular Probes, A11030, 1:100 dilution) or Alexa-Fluor 488 donkey anti-goat (Molecular Probes, A11055, 1:100 dilution) in blocking solution. In addition, 0.9 U/100 l Alexa Fluor 633 phalloidin (Molecular Probes, A22284) was added to the secondary antibody solution to visualize cell membranes and 10 M 4,6-diamidino-2-phenylindole dilactate (DAPI; Molecular Probes, D3571) to stain DNA.
Microscopy and image analysis
Embryos were washed in blocking solution followed by PBS and placed in a drop of PBS on a glass-bottom dish (WillCo Wells, GWSt-5040) covered with mineral oil. Laser scanning microscopy was performed using a Zeiss LSM 510, with optical sections obtained every 1 m. Auto z-brightness correction was used to adjust fluorescence along the z-axis. Unmodified images were analyzed using IMARIS imaging software version 4.2-5.5 (Bitplane AG). Nuclei were segmented in 3D reconstructions based on DAPI staining with the isosurface or spot tool (5-10 m, depending on nucleus size). In the case of isolated blastomeres, nuclei were segmented using the spot tool and region growing function. The number of cells staining positive for Cdx2, Nanog or Oct4 was evaluated visually (0 and 5 hp-c) or by segmentation (IMARIS software) based on the respective staining (10-55 hp-c). Only blastomeres with more intense nuclear than cytoplasmic staining were considered positive. Protein levels were analyzed from unmodified data sets as mean fluorescence intensities within segments. DAPI ratios were used to minimize error caused by staining and LSM. Data were normalized with respect to background levels, defined as the average of the mean fluorescence intensities of 3-5 randomly chosen cytoplasmic spots divided by the average of all mean DAPI fluorescence intensities within defined segments. To minimize variation based on tissue depths, only nuclei within the central 2/4 along the z-axis were included in the fluorescence intensity analysis until 45 hp-c; at 55 hp-c, all cells were included in the analysis to allow inclusion of the whole ICM. The images shown in some of the figures were modified using a low-pass filter (Kernel size 3⫻3⫻3; Zeiss LSM Image Examiner 4.0.0.91) and contrast enhancement (Adobe Photoshop CS or CS2) or gauss filter (Kernel size 3; Axiovision Ver. 4.5) and brightness (Adobe Photoshop CS or CS2). QuickTime movies were made using ImageReady (Adobe, San Jose, CA).
RESEARCH ARTICLE Development 134 (23)
0 5 10 15 20 25 30 35 40 45 50 55hp-compaction
E2.5 E3.5 E4.5
60 70hp-hCG
bI bII blastocyst III cavitation
compaction
[image:2.612.51.447.56.198.2]morula
Fig. 1. Strategy for
synchronizing pre-implantation embryos at compaction and the timing of morphogenetic events during the analyzed period. Embryos were selected at the onset of compaction (about 60 to 70 hp-hCG; 0 hp-compaction). Groups of embryos were fixed every 5 hours, through morula and blastocyst stages bI to III, until 55 hp-compaction, corresponding to embryonic days (E) 2.5 to 4.5.
D
E
V
E
LO
P
M
E
N
Blastomere dissociation
Blastomere dissociation was performed at the 8-cell stage before compaction at 60-65 hp-hCG directly after oviduct flush. To separate blastomeres, the zona pellucida was removed by incubating embryos for 2.5 minutes in pronase at 37°C, followed by washing in H-KSOM. Embryos were then transferred to calcium- and magnesium-free (–CM) KSOM medium for about 10 minutes. Pipetting embryos up and down within the –CM KSOM with a narrow glass pipette dissociated blastomeres. After dissociation, blastomeres were kept in KSOM until fixation at 70 (n=5), 78 (n=11) or 90 (n=5) hp-hCG.
In some experiments, to prevent compaction after division, blastomeres were inspected every 2 hours and re-separated until fixation at 78 hp-hCG (n=5). Control blastomeres were not re-separated (n=5).
Cell-cell adhesion was also inhibited by antibodies against E-cadherin. Embryos were flushed from oviducts at E1.5 (before 8-cell stage), washed in H-KSOM and then immediately cultured in KSOM with anti-E-cadherin antibody or without antibody for a control. Compaction was reversibly inhibited using mouse monoclonal antibodies ECCD-1 and DECMA-1 [kindly provided by M. Takeichi (Riken, Center for Developmental Biology, Kobe, Japan) and R. Kemler (Max-Planck Institute for Immunobiology, Freiburg, Germany), respectively], both directed against the extracellular portion of E-cadherin. Both antibodies inhibited compaction to a comparable degree (DECMA-1 at a concentration of 1-2 g/ ml; ECCD-1 at a concentration of 3 mg/ ml), and DECMA-1 was used in all subsequent experiments. Time-lapse recordings showed that after experimental inhibition of compaction for about 10 hours (until 75 hp-hCG) with 1 g/ ml DECMA-1 the temporal pattern of development after washing in H-KSOM was comparable to that of untreated embryos after compaction (see Fig. S2A and Movie 3 in the supplementary material; n=39/40, control
n=16/16). Full-term development was confirmed by transfer of embryos to oviducts after washing in H-KSOM at about 90 hp-hCG as described below. Patterning of embryos treated with 1.5 g/ ml DECMA-1 was assessed by antibody staining of embryos fixed at 80 hp-hCG (see Fig. S2B in the supplementary material; n=3, control n=2). Patterning of developmentally delayed blastocysts was examined after treatment with 1 and 1.5 g/ ml DECMA-1, subsequent washing in KSOM at 78 hp-hCG and fixation at 96 hp-hCG (n=7 embryos). The Nanog and Cdx2 patterns of these embryos were the same as in untreated embryos (data not shown).
Time-lapse recording of the embryos
Time-lapse recordings were started at 75 hp-hCG. Temperature was maintained by a Tempcontrol 37–2 digital (Carl Zeiss, Oberkochen, Germany) at 37.5°C in a plastic chamber incubator XL (Zeiss) and a heatable mounting frame M-H (Zeiss), attached to a Zeiss Axiovert 200M with Narishige manipulators. Zeiss AxioVision Ver. 4.5 software was used for the acquisition of the time-lapse images. The halogen lamp was set below 2.4 V to minimize the embryos’ exposure to light. Embryos were recorded every 30 minutes for up to 72 hours. The time-lapse movies were converted to QuickTime movies using ImageReady (Adobe).
Embryo transfer
Embryos were transferred into the oviduct of E0.5 pseudopregnant NMRI females mated to vasectomized NMRI males as described (Nagy et al., 2003). Live born mice were obtained from oviduct transfers of untreated embryos (n=4/16 transferred embryos) and embryos treated with DECMA-1 at a concentration of DECMA-1-DECMA-1.5 g/ ml (n=6/49 transferred embryos).
RESULTS
Timing of blastocyst morphogenesis and lineage segregation
We assessed allocation of lineages in relation to blastocyst morphogenesis at precisely defined stages using embryos synchronized by selection at the onset of compaction (based on stereomicroscopic observation, 8±2 cells, n=17; Figs 1, 2). Groups of embryos were fixed and analyzed every 5 hours until 55 hp-c (104±10 cells, n=9). Because it has been suggested that fate is specified according to position, with outside cells forming TE and inside cells forming ICM (Tarkowski and Wroblewska, 1967), we determined the position of blastomeres within the conceptus in consecutive optical sections using actin staining with phalloidin to label membranes. ‘Inside’ cells are defined here as those lacking any contact with the outer surface of the embryo, whereas ‘outside’ cells have such contact (white arrowheads in Figs 3-5 point to examples of inside blastomeres; green arrowheads mark outside blastomeres of special interest; see also Movies 1 and 2 in the supplementary material, including consecutive optical sections of embryos). The first inside cells appeared at 10 hp-c (15±2 total cells, n=18, Fig. 2) (Barlow et al., 1972). In 13 of 18 embryos at this stage, all blastomeres still had contact to the outside, although some with only a small portion of their surface (Fig. 3, Fig. 5A, asterisks). The number of inside cells increased continuously, and at 25 hp-c, nine cells on average were inside (9±2 inside cells, 34±4 total cells, n=17; Fig. 2).
Establishment of the blastocyst is characterized by formation and positioning of a cavity. The first small cavities were detectable stereomicroscopically at 15 hp-c (20±5 cells, n=13), increasing in size continuously thereafter and reaching blastocyst stage III by 30 hp-c [59±3 cells, n=11; for classification see Motosugi et al. (Motosugi et al., 2005)]. The late blastocyst is organized to accommodate the first lineages, marked by the restricted expression of transcription factors such as Oct4 (EPI and PE), Nanog (EPI) and Cdx2 (TE). Oct4 was present in all cells until 35 hp-c (58±6 cells, n=12; n=6 for Oct4), declining gradually in the TE, so that by 55 hp-c only the ICM showed intense Oct4 staining
0 32 64 96 128 160
0 5 10 15 20 25 30 35 40 45 50 55
n
umber of b
lastomeres
hours post-compaction
[image:3.612.53.346.560.738.2]total cells Oct4+ Cdx2+ Nanog+ inside cells total cells in vivo
Fig. 2. Protein expression in blastomeres post-compaction.Average number of blastomeres that were positive for Oct4 (light blue), Cdx2 (pink) and Nanog (green) in relation to the total cell number (black) and the number of the inside population (dark blue) as a function of time after compaction. As a reference, the average number of blastomeres of in vivo developed embryos is provided (crosses) at 10, 30 and 55 hp-c. Error bars indicate s.d.
D
E
V
E
LO
P
M
E
N
4222
(n=4; Fig. 2, Fig. 3A). After compaction, embryos exhibit intense cytoplasmic Cdx2 staining, occasionally making it difficult to distinguish between cytoplasmic and nuclear staining. It is unclear whether the cytoplasmic staining represents specific Cdx2 signal or background (Strumpf et al., 2005). Only the cases in which nuclear staining was clearly distinguishable from cytoplasmic staining were considered positive in this study. Cdx2 was absent (n=9/13) or detectable only at low levels at 0 hp-c (n=4/13, Fig. 3B). Nuclear staining increased during the following hours, and, by 10 hp-c, all cells of some embryos (n=7/19) were Cdx2 positive (Cdx2+) and on average 12 of 16 cells showed clear nuclear Cdx2 staining (n=19 embryos, Fig. 3B). By 25 hp-c only cells located on the outside were strongly Cdx2+ (n=13 embryos, Fig. 3B). Nanog was present in all blastomeres until 35 hp-c (n=3/6 embryos, and on average 98.5±2% of all non-mitotic cells were Nanog+; Fig. 2, Fig. 3C), whereas by 55 hp-c, high levels of Nanog were restricted to a cluster of cells embedded in the ICM, presumably the EPI (n=5 embryos; Fig. 3C).
Cdx2 initiates expression with variability
At 10 hp-c most or all blastomeres were Cdx2+. Interestingly, comparison of Cdx2 fluorescence intensities in individual nuclei using DNA staining as a reference value revealed wide variation, with some nuclei intensely labeled and others only slightly above cytoplasmic levels (Fig. 3B, Fig. 5A). Similarly, Strumpf et al. found expression of Cdx2mRNA starting from the 8-cell stage and nuclear Cdx2 protein in a subset of 16-cell morulae (Strumpf et al., 2005). Another study, however, reported localized expression of Cdx2 in the cytoplasm of oocytes and zygotes, and asymmetric segregation of Cdx2 in the nucleus of only half of the blastomeres generated during the subsequent cell divisions (Deb et al., 2006). We cannot reproduce these observations with two Cdx2 antibodies, one of which has been used in all three groups (Strumpf et al., 2005; Deb et al., 2006), but instead find upregulation of Cdx2 in all 8-cell blastomeres (see also isolated 1/8 blastomere study below). Indeed, the report of Deb et al. has been recently retracted (Kennedy, 2006; Roberts et al., 2007).
[image:4.612.53.565.60.453.2]RESEARCH ARTICLE Development 134 (23)
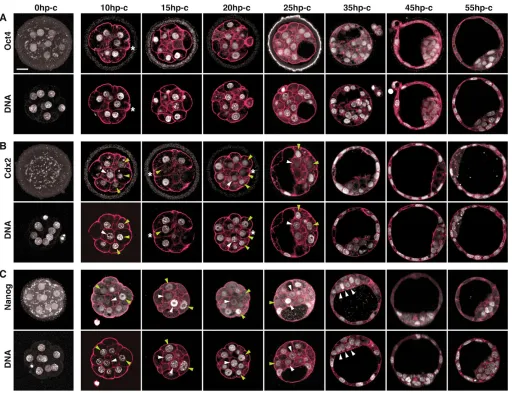
Fig. 3. Patterning of the pre-implantation embryo progresses through an initial phase of high variability.Oct4 (A), Cdx2 (B) and Nanog (C) distribution at defined stages of development. For every embryo, the counterstained DNA is shown in the row below. White and green arrowheads indicate nuclei of interest of inside and outside cells, respectively. Actin (red) marks the cell membranes. Asterisks indicate blastomeres with only minimal contact to the outside. Images are single optical sections, except for those at 0 hp-c, being maximum intensity projections. Scale bar: 20 m.
D
E
V
E
LO
P
M
E
N
With the appearance of inside cells, there is a preference for strongly Cdx2+ cells to be located on the outside (Fig. 3B, Fig. 4A, Fig. 5A) (Niwa et al., 2005; Strumpf et al., 2005). Nevertheless, single blastomeres with high Cdx2 levels were found in the inside until 20 hp-c (Fig. 3B 10 and 20 hp-c, Fig. 4A 15 hp-c, Fig. 5A 15 and 20 hp-c; and see Fig. S1B in the supplementary material, 70hp-hCG, white arrowheads), whereas some cells on the outside showed low-level Cdx2 staining (Fig.
3B 10-20 hp-c, Fig. 4A 15 and 20 hp-c, Fig. 5A 15 and 20 hp-c and see Fig. S1B in the supplementary material, 70hp-hCG, green arrowheads). This ‘position-independent’ variability was restricted to a period from 10 to 20 hp-c. By 25 hp-c, no inside cells with high Cdx2 were found (n=13 embryos), but single cells on the outside occasionally had low levels of Cdx2 (in n=6/13 embryos, Fig. 3B 25 hp-c). By 35 hp-c, all cells located on the outside were strongly Cdx2+ and those on the inside were Cdx2-Fig. 4. Cdx2 levels are variable and initially without correlation to Oct4.(A) Cdx2 and Oct4 distribution within the same embryo at defined stages of development. For every embryo the counterstained DNA is shown in the row below. White and green arrowheads indicate nuclei of interest of inside and outside cells, respectively. Actin (red) marks the cell membranes. All images are single optical sections. Scale bar is 20 m. (B) Scatter plots showing the normalized mean fluorescence intensity of Cdx2 relative to Oct4 for individual blastomeres. Each dot represents one blastomere; different colors represent different embryos. Red lines mark the background fluorescence level.
D
E
V
E
LO
P
M
E
N
[image:5.612.52.549.54.562.2]4224
negative (Cdx2–; n=6 embryos, Fig. 3B, Fig. 4A, Fig. 5A). These findings reveal high variability of Cdx2 levels in the nuclei of blastomeres after compaction.
Nanog expression exhibits a phase of random variability and mosaicism
The Nanog expression pattern also exhibits a phase of variability (Fig. 3C 10-35 hp-c, Fig. 5A 10-45 hp-c). By 40 hp-c (75±4 cells,
n=2), the late blastocyst is a mosaic of Nanog+ and Nanog– cells
(Fig. 3C) (Chazaud et al., 2006; Kurimoto et al., 2006). This mosaicism has been shown to be independent of position within the ICM (Chazaud et al., 2006). Because we observed strong variability in Nanog expression even at 10 hp-c (n=15 embryos), we tested for a possible relationship between Nanog expression in each blastomere and its position in the morula, i.e. inside versus outside. However, Nanog variability appeared to be independent of the position of the individual blastomeres within the conceptus (Fig. 3C 10-35 hp-c, green and white arrowheads). Furthermore,
[image:6.612.53.550.58.558.2]RESEARCH ARTICLE Development 134 (23)
Fig. 5. Cdx2 and Nanog variability are not correlated.(A) Cdx2 and Nanog at defined stages of development. For every embryo the counterstained DNA is shown in the row below. White and green arrowheads indicate nuclei of interest of inside and outside cells, respectively. Actin (red) marks the cell membranes. Asterisks indicate blastomeres with only minimal contact to the outside. All images are single optical sections. Scale bar: 20 m. (B) Scatter plots showing the normalized mean fluorescence intensity of Cdx2 relative to Nanog in individual blastomeres. Each dot represents one blastomere; different colors represent different embryos. Red lines mark the background fluorescence level.
D
E
V
E
LO
P
M
E
N
when the mosaic is established, Nanog is not restricted to the ICM. Until 35 hp-c (bIII), cells on the outside strongly expressed Nanog (Fig. 3C 25 and 35 hp-c, Fig. 5A 25 and 35 hp-c and see Fig. S1C in the supplementary material), and at 45 hp-c, a subset of TE cells was Nanog+ (in n=10/13 embryos, Fig. 5A). Only at 55 hp-c was a high Nanog expression restricted to a cluster of cells within the ICM, presumably the epiblast (Fig. 3C, Fig. 5A,
n=5 embryos).
Cdx2 levels initially show no correlation to Oct4 It has been proposed that reciprocal inhibition between Oct4 and Cdx2 segregates TE and ICM fate (Niwa et al., 2005). Analysis of Oct4 and Cdx2 expression within the same embryo, however (Fig. 4A; see Movie 1 in the supplementary material) revealed strong Oct4 expression in nuclei of all blastomeres (Fig. 4A, 15-45 hp-c), independent of high variability in Cdx2 expression (Fig. 4A, 15 and 20 hp-c). Moreover, comparison of normalized mean fluorescence intensities of Oct4 and Cdx2 within individual nuclei at different times post-compaction (Fig. 4B; see Materials and methods) revealed slow nuclear Cdx2 accumulation above cytoplasmic levels [(t)=15 hours] but no evidence of a reciprocal relationship between Cdx2 and Oct4 levels at 15 hp-c (note the ‘irregular cloud’ in the scatter plot for this time; n=3). At 25 hp-c, a separation of Cdx2+ and Cdx2– populations was detectable, but both populations retained high levels of Oct4 (n=4). At 30 hp-c, Cdx2+ cells had slightly lower levels of Oct4 than did the Cdx2– population (n=4;
n=5 at 35 hp-c). However, most Cdx2+ cells had a strong Oct4 signal until 45 hp-c (n=2). By 55 hp-c, Oct4 expression was strongly reduced in Cdx2+ cells (n=4). These data demonstrate that Cdx2 accumulates and is maintained despite high levels of Oct4, and that Cdx2 variability is established independent of Oct4 levels. Oct4 is weakly suppressed in the TE 45 hours after the onset of Cdx2 expression.
Cdx2 and Nanog variabilities show no correlation Because of the variability of Cdx2 and Nanog expression, we investigated the possibility of a relationship between their expression patterns. Analysis of Cdx2 and Nanog within the same embryo (Fig. 5A; see Movie 2 in the supplementary material) revealed some nuclei that exhibited reciprocal levels, whereas others showed high levels of both proteins. Comparison of normalized mean fluorescence intensities of Nanog and Cdx2 within nuclei at different times post-compaction (Fig. 5B) revealed increased nuclear Cdx2 above cytoplasmic levels by10 hp-c (n=4), in contrast to the much slower increase in Cdx2 in the Oct4/Cdx2 plot (Fig. 4B). The difference in times until detectable Cdx2 had accumulated probably reflects the different sensitivities of the Cdx2 antibodies used (rabbit polyclonal antibody for the analyses in Fig. 3B 0, 10, 20, 25 and 45 hp-c, and Fig. 4; and mouse monoclonal antibody for those in Fig. 3B 15, 35 and 55 hp-c, and Fig. 5; see Materials and methods). By 15 hp-c, the Cdx2/Nanog plot (Fig. 5B) formed an ‘irregular cloud’ (n=6); by 25 hp-c, separation of Cdx2+ and Cdx2– populations was observed, independent of high Nanog levels in some cells of both populations (n=5, n=4 at 35 hp-c, n=3 at 45 hp-c, n=5 at 55 hp-c). These findings indicate the mutual independence of Cdx2 and Nanog expression variability, and show the co-existence of Cdx2 and Nanog within the same nucleus until the late blastocyst (Fig. 5B).
Patterning of in vivo developed embryos
To examine whether culturing embryos ex vivo affects the patterning process we analyzed total cell numbers and the expression of Oct4, Cdx2 and Nanog in freshly collected embryos
at three timepoints (Fig. 2 and see Fig. S1 in the supplementary material). Seventy hp-hCG represents morula stage (n=9 embryos for Cdx2/Nanog, n=5 embryos for Oct4), 90 hp-hCG early blastocyst (n=4 embryos for Cdx2/Nanog, n=3 embryos for Oct4) and 115 hp-hCG late blastocyst (n=6 embryos for Cdx2/ Nanog). According to our synchronization scheme we compared the condition of 70 hp-hCG to 10 hp-c, 90 hp-hCG to 30 hp-c and 115 hp-hCG to 55 hp-c. At 70 hp-hCG embryos consisted of 16 cells (n=2 embryos), at 90 hp-hCG of 68±10.75 (n=7 embryos) and at 115 hp-hCG of 155±12.60 cells (n=6 embryos), suggesting that in vivo embryos develop slightly faster than in culture (Fig. 2). At 70 hp-hCG Oct4 was expressed at high levels by all cells (see Fig. S1A in the supplementary material), while Cdx2 and Nanog levels were highly variable among blastomeres (see Fig. S1B,C in the supplementary material). High levels of Cdx2 were found preferentially in outside cells, but in a few cases inside cells had higher levels than outside cells (n=2/9 embryos; see Fig. S1B in the supplementary material). Nanog was independent of position in the morula. At 90 hp-hCG Oct4 was expressed in both the TE and ICM (see Fig. S1A in the supplementary material). In some embryos Oct4 was slightly weaker in the TE than in the ICM (n=2/3 embryos). Cdx2 was restricted to outside cells (see Fig. S1B in the supplementary material, 90 hp-hCG). Nanog was highly variable, with some cells expressing high levels and others very low levels. Highly Nanog+ cells were present in both the ICM and TE (see Fig. S1C, 90 hp-hCG in the supplementary material). At 115 hp-hCG Cdx2 was restricted to the TE (see Fig. S1B in the supplementary material). Nanog was expressed at high levels by a population located within the ICM, presumably the EPI. In some embryos a small number of TE cells had detectable Nanog levels (n=5/6; see Fig. S1C in the supplementary material, 115 hp-hCG).
These data show that in vitro culture, despite delaying late blastocyst development, does not alter the patterning process. Both in vivo and ex vivo developing embryos exhibit the same characteristic patterning features.
Asymmetric cell divisions at the 8-cell stage may underlie Cdx2 variability
The late morula comprises an inside cell population with low Cdx2 levels and a strongly Cdx2+ outside TE that initiates cavitation. These morphogenetic processes are preceded by cellular polarization at the 8-cell stage. Cellular polarization is known to be dependent on two pathways: cell-cell adhesion via E-cadherin (Kemler et al., 1977; Yoshida and Takeichi, 1982; Larue et al., 1994) and reorganization of the microtubule network (Houliston et al., 1989; Maro et al., 1991). Owing to the increasing cell-cell adhesion, the time point of cellular polarization is called compaction. To understand the emergence of variability in Cdx2 and Nanog protein levels among blastomeres we tested a possible role of cellular polarization. For this we dissociated 8-cell embryos before compaction (Fig. 6). Each 1/8 blastomere was then allowed to develop (Tarkowski and Wroblewska, 1967; Graham and Lehtonen, 1979; Johnson and Ziomek, 1981) until 70 hp-hCG (n=5 embryos, 40 blastomeres; Fig. 6A), 78 hp-hCG (n=11 embryos, 87 blastomeres; Fig. 6B) or 90 hp-hCG (n=5 embryos, 40 blastomeres; Fig. 6C).
At 70 hp-hCG many blastomeres had divided once to give rise to a 2/16 doublet (n=36/40, n=5 embryos; Fig. 6A). Fourteen of 36 doublets appeared to have equally sized sister blastomeres (Fig. 6A1, empty rhombus), while the other 22 were unequal in size (Fig. 6A2, filled circle) (Johnson and Ziomek, 1983). After cytokinesis, cell-cell adhesion between the sister blastomeres quickly increased,
D
E
V
E
LO
P
M
E
N
4226
as if they were undergoing compaction (Fig. 6B). At 78 hp-hCG 85/87 blastomeres had divided once; 25 of 85 appeared symmetric (Fig. 6B1, empty rhombus), 12 were slightly asymmetric (Fig. 6B2,
empty circle) and 48 2/16 doublets had formed characteristic structures in which one cell partially or completely engulfed the sister blastomere (Fig. 6B3-4, filled circle) (Johnson and Ziomek,
[image:8.612.53.561.61.566.2]RESEARCH ARTICLE Development 134 (23)
Fig. 6. Variability of Cdx2, but not Nanog, may be generated by asymmetric cell divisions at the 8-cell stage.(A,B) Cdx2 and Nanog patterning of blastomeres isolated at the 8-cell stage and analyzed at 70 (A) and 78 (B) hp-hCG. (C) Scatter plot illustrating the normalized mean fluorescence intensity of Cdx2 (left panels) and Nanog (right panels) in sister blastomeres at 70 (C1) and 78 (C2) hp-hCG. The ‘smaller’ (at 70 hp-hCG) or ‘inside’ (at 78 hp-hCG) cell is plotted on the x-axis, the ‘bigger’ or ‘outside’ one on the y-axis. A filled circle represents a doublet with clear asymmetry; an empty circle represents a doublet with slight asymmetry; an empty rhombus represents symmetric doublets. Each symbol represents a 2/16 doublet; different colors represent different embryos. Red lines mark the background fluorescence level. (D) Cdx2 and Nanog patterning at 90 hp-hCG in blastomeres isolated at the 8-cell stage. (E) Cdx2 and Nanog patterning of blastomeres isolated at 8-cell and re-isolated at the 16-cell stage. A cross marks an apolar cell; black triangle, a polar cell; asterisk, eccentric localization of the nucleus; arrowhead, the pole of intense actin staining in polar cells. DNA staining provides a reference value. Actin (red) marks the cell membranes. All images are single optical sections. Scale bar: 20 m. (F) Scatter plot illustrating the Cdx2 variance in relation to Nanog levels of polar (filled triangles) and apolar (crosses) cells. Each symbol represents one blastomere. Black lines and dotted lines represent the average protein levels of polar cells and apolar cells, respectively. Error bars indicate s.d.
D
E
V
E
LO
P
M
E
N
1983). To compare quantitatively Cdx2 and Nanog levels of two daughter blastomeres we plotted the pair representing the mean fluorescence intensity of the bigger one on the y-axis and that of the smaller one on the x-axis for 70 hp-hCG (Fig. 6C1), or the swallowing blastomere along the y-axis, and that of the swallowed one on the x-axis for 78 hp-hCG (Fig. 6C2; symmetric pairs were randomly attributed to the x- or y-axis). The swallowing and swallowed blastomeres may well correspond to ‘outside’ and ‘inside’ cells of an intact embryo, respectively (Johnson and Ziomek, 1983). Therefore we will refer to them as such from now on. Each symbol represents one doublet, each color one embryo. Four doublets were excluded from the analysis at 78 hp-hCG because blastomeres were mitotic. The red dotted line marks equal fluorescence levels of sister blastomeres. For Cdx2, the positions of the empty rhombi (symmetric doublets) are variable with many lying close to the dotted (i.e. equal) line (n=12/13 at 70 hp-hCG, Fig. 6C1;
n=15/25 at 78 hp-hCG, Fig. 6C2), suggesting that after symmetric division, Cdx2 levels are similar in sister blastomeres. Empty circles (slightly asymmetric doublets) show no obvious trend for higher Cdx2 levels in either one of the sister blastomeres (n=12). Most filled circles (asymmetric doublets) are positioned away from the line toward higher Cdx2 in the ‘outside’ cell (n=12/22 at 70 hp-hCG;
n=40/46 at 78 hp-hCG). These data suggest that following cleavage a substantial number of sister blastomeres acquired different Cdx2 levels, with bigger cells having higher, and smaller cells lower, Cdx2 levels (Fig. 6A2,C1). At 78 hp-hCG the ‘outside’ blastomere had higher Cdx2 levels than the ‘inside’ one (Fig. 6B2-4,C2). Variability of the Nanog levels among sister blastomeres was small and without correlation to asymmetric cell division from 8- to 16-cell stage (Fig. 6C1-2), or that of Cdx2 levels (Fig. 6A,B).
At 90 hp-hCG all blastomeres had divided twice to give rise to 4/32 quadruplets (n=40/40 structures, n=5 embryos; Fig. 6D). The isolated blastomeres formed one of three distinct structure types (summarized in Fig. 6D4) (Johnson et al., 1986): type I, 4/32 quadruplet with three ‘outside’ cells surrounding one ‘inside’ cell (n=23/40, Fig. 6D1); type II, 4/32 quadruplet with two ‘outside’ cells surrounding two ‘inside’ cells (n=6/40, Fig. 6D2); type III, 4/32 quadruplet with four ‘outside’ cells, which all had strong Cdx2 signal (n=7/40, Fig. 6D3). Four of 40 quadruplets were not unequivocally attributable to type I, II or III. ‘Outside’ cells had high Cdx2 levels, whereas the ‘inside’ cells had weak signals. It is important to note that the composition of the type of quadruplets derived from different embryos was highly variable (Fig. 6D4; see Discussion).
Taken together, these data suggest that isolated blastomeres attempt to continue blastocyst morphogenesis and embryonic patterning in the same temporal and spatial manner as intact embryos. Intriguingly, the timing of cleavage, compaction, molecular patterning, inside/outside segregation, as well as cavitation was comparable to that observed for non-manipulated embryos (Figs 2-5). Thus, most, and of some embryos all, 1/8 blastomeres are able to recapitulate the segregation into a Cdx2– inside and Cdx2+ outside population that is able to initiate cavitation. Furthermore, these data demonstrate a correlation between asymmetric cell divisions at 8-cell stage and the generation of variability in Cdx2, but not in Nanog protein levels.
The role of cell-cell contacts and cell cycle progression in embryonic patterning
To test the role of cell-cell contacts on the patterning process we re-separated 2/16 doublets immediately following cleavage so that the blastomeres were cultured essentially in the absence of cell-to-cell
contacts until fixation at 78 hp-hCG (n=3 embryos, Fig. 6E). The 1/16 blastomeres were variable in size and 23/31 cells apparently had polar characteristics (Fig. 6E, filled triangle), with one of the poles having more intense actin staining (i.e. microvilli of the apical membrane) and the nucleus at the opposite pole (Fig. 6E, arrowhead and asterisk, respectively). The remaining eight blastomeres appeared apolar (Fig. 6E, cross). The normalized mean fluorescence intensity of Cdx2 was significantly higher in polar cells (11.6±3.6 arbitrary units (a.u.); Fig. 6F, black line), compared to apolar cells (6.9±2.5 a.u.; Student’s t-test P=0.002; Fig. 6F, black dotted line). Nanog levels were similar in both populations (5.0±1.7 a.u. for polar cells, black line, 4.5±1.2 a.u. for apolar cells, black dotted line; Student’s t-test P=0.437; Fig. 6F). This suggests that Cdx2 levels of polar and apolar cells remain different when blastomeres are kept isolated until the 16-cell stage and that continuous cell-cell contact is not necessary to maintain variability.
Compaction can also be reversibly inhibited by antibodies directed against the extracellular domain of E-cadherin (see Fig. S2A in the supplementary material; see Materials and methods for details) (Johnson et al., 1979; Damsky et al., 1983; Richa et al., 1985; Vestweber and Kemler, 1985). Indeed, embryos treated with those antibodies for a certain period were able to form hatching blastocysts in vitro (see Fig. S2A and Movie 3 in the supplementary material; see Materials and methods) and to give rise to live-born mice after transfer into a foster mother (n=6/49). The number of blastomeres in embryos inhibited until 90 hp-hCG in 1-1.5 g/ml was about 16 (16±1, n=14; 49±4 for control, n=2). This suggests that culturing embryos in the presence of anti-E-cadherin antibodies delayed cell-cycle progression. Furthermore, levels of Cdx2 and Nanog protein remained low when compaction was inhibited with 1.5 g/l DECMA-1 for 15 hours (until 80 hp-hCG, n=3; control n=2; see Fig. S2B in the supplementary material), suggesting that cell cycle progression and/or E-cadherin mediated cell-to-cell contacts are necessary for upregulation of Cdx2 and Nanog expression.
DISCUSSION
Oct4 does not reflect the patterning phases
To gain insight into the molecular basis of early mouse embryo development, we assessed embryonic patterning, reflected by Oct4, Cdx2 and Nanog protein expression, at defined stages from compaction until late blastocyst.
The mode of Oct4 restriction to a subset of cells differs significantly from that of Cdx2 and Nanog. Oct4 never exhibits the phase of variability that characterizes Cdx2 and Nanog before becoming restricted to the ICM. Thus, Oct4 does not reflect the patterning phases seen through Cdx2 and Nanog. Since Oct4 is necessary to impart pluripotency in the early embryo (Nichols et al., 1998), this protein might be present in all blastomeres until the first lineages are irreversibly determined at blastocyst stage (Rossant, 1975; Rossant, 2004). This notion contrasts with the recent proposal that reciprocal inhibition between Oct4 and Cdx2 enhances blastomere differences and determines TE (Niwa et al., 2005). Oct4 protein is present in all blastomeres long after (more than 20 hours) Cdx2 is restricted, and it is not until then that Oct4 expression is low in Cdx2+ cells. Thus, Oct4 levels do not affect Cdx2 accumulation and maintenance, suggesting that even if reciprocal inhibition between Oct4 and Cdx2 functions during in vivo patterning, additional regulatory mechanisms must be involved in its regulation (Tolkunova et al., 2006). Nevertheless, the proposed reciprocal inhibition pathway could function in the downregulation of Oct4 in Cdx2+ TE after the actual patterning
process.
D
E
V
E
LO
P
M
E
N
4228
Cdx2 variability reflects formation of an inside population
Cdx2 and Nanog exhibit two distinct patterning phases that eventually lead to their restricted expression. In the first phase, molecular differences between blastomeres are generated, and in the second phase, a relationship between molecular signature and position within the embryo is established.
Upregulation of nuclear Cdx2 and establishment of variability among blastomeres precede the appearance of the first inside cells (Fig. 2). Before Cdx2 is restricted to the outside population at 25 hp-c, Cdx2 expression is low in a subset of outside blastomeres and high in some inside cells, although highly Cdx2-positive cells are preferentially located on the outside. Inhibition of compaction with specific anti-E-cadherin antibodies suggests that E-cadherin mediated cell-to-cell contacts and/or cell cycle progression past the16-cell stage is required for correct patterning.
Descendants of isolated 1/8 blastomeres undergo a compaction-like event, many differentiate into an inside and outside population, and all initiate cavitation. In these blastocyst-like structures Cdx2 signal is high in the outside and low in the inside population, whereas Nanog levels appeared random. Importantly, all 1/8 blastomeres of at least some embryos are able to undergo these processes. Thus, the descendants of 1/8 blastomeres self-organize into blastocyst-like structures.
Our data from isolated blastomeres further suggest that differences in Cdx2 levels among blastomeres at morula stage may be generated by asymmetric cell divisions of the 8- to 16-cell stage
transition. The mechanism controlling the symmetric or asymmetric division is unclear. Interestingly, we found that the number of asymmetric divisions in isolated blastomeres varies from embryo to embryo. Similarly, the number of inside cells of intact 16-cell embryos is highly variable. Asymmetric divisions might be regulated by extrinsic cues, such that, for example, cleavage patterns during the 1- to 8-cell stages influence cleavage orientation of the subsequent divisions. But it is unclear whether this occurs in an organized way as previously suggested (Piotrowska-Nitsche and Zernicka-Goetz, 2005; Zernicka-Goetz, 2005), since cleavage plane specification during the first cell division is not predetermined (Hiiragi and Solter, 2004) and mitotic spindle orientation of the second cell division appears random (Louvet-Vallee et al., 2005). Cleavage orientation of the third division may depend simply on mechanical constraints imposed on the dividing cells, thus resulting in a stochastic cleavage pattern that may explain the variability in the number of asymmetric divisions among embryos and the presence of Cdx2– cells on the outside of the early morula.
Stochastic establishment of Nanog variability The mechanism leading to Nanog variability and a complete expression mosaic is unclear. As may be the case for Cdx2, a cleavage pattern could be involved in its generation. Within the ICM, the cleavage pattern has been proposed to generate two cell populations, one cytokeratin filament-positive and the other, negative (Chisholm and Houliston, 1987; Yamanaka et al., 2006). Apolar cells that are generated during the 8- to 16-cell transition, but
RESEARCH ARTICLE Development 134 (23)
0 5 10 15 20 25 30 35 40 45 50 55 hp-compaction
E2.5 E3.5 E4.5
Oct3/4
Cdx2
Nanog
60 70 hp-hCG
bI bII bIII cavitation
sorted
sorted (TE) variable
uniform variable
mosaic sorted
uniform sorted
[image:10.612.51.510.59.354.2]8 ~16 ~32 ~64 ~96 ~104 cells
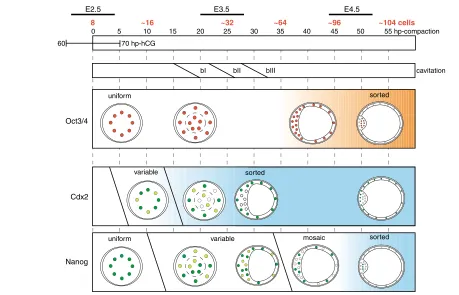
Fig. 7. A summary scheme of the temporal and spatial expression patterns and the proposed model for autonomous establishment of asymmetries in the pre-implantation mouse embryo.Oct4 (red) is present at high levels in all blastomeres until 45 hp-c, gradually declining in the trophectoderm (orange gradient represents the degree of ICM restriction, with darker being more restricted). Cdx2 and Nanog reflect two patterning phases, including initiation of variability among blastomeres after compaction and subsequent sorting (dark green represents strong expression, light green weak expression and empty circles absence of nuclear Cdx2 or Nanog; blue gradient represents the degree of restriction, with darker being more restricted; see text for details).
D
E
V
E
LO
P
M
E
N
not those generated in the 16- to 32-cell transition, lack filaments. EPI versus PE segregation within the ICM has been shown to involve enhancement of Gata6 (Koutsourakis et al., 1999) and repression of Nanog signaling through the Grb2-Mapk pathway (Chazaud et al., 2006). These mechanisms may cooperate to establish the Nanog mosaic.
Another study proposed that Nanog expression is regulated by histone arginine methylation (Torres-Padilla et al., 2007). This study suggested that 4-cell-stage embryos that follow a specific second cleavage pattern, exhibit differential H3R26 methylation among the blastomeres. Furthermore, they concluded that blastomeres with higher H3R26 methylation levels predominantly contribute to the ICM. Our data, however, show that molecular differences in Nanog levels are established independently of blastomere position in the morula. It will, therefore, be important to analyze H3R26me levels at the morula stage, to see whether they correlate to position or to Nanog levels.
The functional role of Nanog is not fully understood, although it is required to maintain pluripotency in the epiblast lineage (Chambers et al., 2003; Mitsui et al., 2003). Thus, it was an unexpected finding that Nanog is expressed not only in the ICM of the blastocyst, but also in some cells of the TE. Furthermore, Nanog levels neither show a relationship with asymmetric cell divisions from the 8- to 16-cell stage, nor with Cdx2 levels. Although it is possible that an epigenetic mechanism as described above or as yet unknown factors direct lineage segregation in an ordered fashion, the position-independence, as well as the initial independence from Cdx2 levels and from a first round of asymmetric cell division favor stochastic generation of variability in Nanog levels (Novick and Weiner, 1957; Spudich and Koshland, Jr, 1976; Ko, 1992; McAdams and Arkin, 1997; Sigal et al., 2006).
Patterning and morphogenesis: sorting mechanisms
In a second patterning phase, a definite relationship with blastocyst morphology is established. This could be achieved in two ways. First, the emerging molecular signature defines the properties of the cells and enables them to change position (Smith, 2005) with respect to internal and external cues. Cells would then find their final position based on characteristics that might involve, for example, specific cellular adhesion properties (Kimber et al., 1982). Such a sorting mechanism circumvents the necessity for readjusting molecular signatures. Subtle changes in cell-to-cell contacts could relocate a blastomere to an inside or an outside position. Movement of outside blastomeres to the inside has been reported (Fleming, 1987). At 10 hp-c (about 16 cells) we detected the first cell that is truly buried within the conceptus (Graham and Lehtonen, 1979) and several blastomeres with only a small portion of their membrane in contact with the outside. The latter cells could be either completely engulfed internally or extend their outside contact area. A previous study found that two to seven blastomeres (on average 5.22 cells) were located on the inside of 16-cell stage embryos (Fleming, 1987). The discrepancy with respect to our study may be due to different experimental approaches and definition used in identifying the positions of the cells. The requirement for only small changes in cell-to-cell contacts to completely change the position of a cell with respect to inside versus outside might explain why such a movement has not been observed thus far (Kelly, 1979). However, recent analysis by nucleus tracing in 3D time-lapse recordings revealed a highly dynamic behavior of blastomeres, especially associated with cell divisions, within the developing conceptus (Kurotaki et al., 2007). We speculate that such a sorting through positional change
may depend on global differences in the molecular signature of a cell, including adhesion properties, which could be reflected by Cdx2 levels. During the process of blastomere engulfment in the morula interior, cells with high Cdx2 would then tend to remain on the outside, whereas those with lower Cdx2 would move to the inside.
Secondly, cell position may dictate its fate (Tarkowski and Wroblewska, 1967). In that case, readjustment of molecular characteristics with respect to positional influence would be required. Alternatively, expression of Cdx2 changes over time and is stabilized in cells in the correct position.
In the case of EPI versus PE divergence, it seems that positional change establishes the relationship between position and molecular signature. Based on lineage tracing analysis, Chazaud et al. (Chazaud et al., 2006) have suggested that cells of the E3.5 ICM are determined as EPI or PE, independent of position. The same study provided support for the sorting hypothesis from time-lapse observations, which revealed dynamic behavior of cells within the early embryo (Chazaud et al., 2006). Another study consistently identified the presence of two populations within the E3.5 ICM that are distinct on a global molecular level (Kurimoto et al., 2006). These data imply that these cells adopt the correct position after acquiring molecular differences in the case of EPI and PE sorting. Currently, the change in position, the change in gene expression, or both mechanisms in cooperation remain plausible to explain the second patterning phase by sorting. Definite proof awaits the availability of reporter lines that allow time-lapse-based lineage tracing during the patterning process.
Autonomous emergence of asymmetries in the early mouse embryo
Based on molecular data on TE versus ICM and EPI versus PE segregation, as well as experimental manipulation of pre-implantation development, we propose a two-phase model of patterning of the blastocyst (Fig. 7). In a first phase, molecular differences between blastomeres are established. In the case of Cdx2, variability may be generated through asymmetric cell division of polar 8-cell blastomeres. Since the number of asymmetric divisions varied from embryo to embryo under manipulated conditions, it will be interesting to understand in greater detail what controls asymmetric divisions at that stage. The mechanism generating Nanog variability remains unclear. Interestingly, anterior-posterior axis asymmetry of the post-implantation embryo may be established stochastically at the blastocyst stage (Takaoka et al., 2006). Expression of the TGF-family member Lefty1(Meno et al., 1996) was detected in a few cells of the ICM at E3.5, but no correlation between Lefty1-expressing cells and their position within the blastocyst was identified. Definite pattern formation in relation to embryo morphology is achieved in a second phase in which a sorting mechanism establishes a relationship between the molecular signature of a blastomere and its position within the conceptus. This model is consistent with the highly regulative capacity of the early mouse embryo until late blastocyst stage (Rossant and Lis, 1979; Rossant and Vijh, 1980): the fate of blastomeres is not determined irreversibly until blastocyst morphogenesis is completed. Thus, we conclude that the first lineages may emerge after the 8-cell stage, possibly due to stochastic processes and/or asymmetric cell divisions. The morula-stage mouse embryo would be highly heterogeneous with respect to the molecular profile, and regularities in relation to morphology emerge later. From an evolutionary standpoint, these features may be unique to the pre-implantation stage of mammalian species (O’Farrell et al., 2004; Motosugi et al., 2005).
D
E
V
E
LO
P
M
E
N
4230
We thank D. Solter, A. Tomilin, Z. Polanski, C. Graham, R. Cassada, M. Hoffman, O. Basak and A. Tsumura for very helpful discussions and comments on the manuscript; T. Fujimori for sharing unpublished data; P. Kindle for assistance with confocal microscopy analysis and T. Bass for technical assistance. We are grateful to R. Kemler, S. Yamanaka and M. Takeichi for providing antibodies. This work was partially supported by Deutsche Forschungsgemeinschaft Schwerpunktprogramme and the Lalor Foundation (to T.H.). The authors have declared that no competing interests exist.
Supplementary material
Supplementary material for this article is available at http://dev.biologists.org/cgi/content/full/134/23/4219/DC1
References
Alarcon, V. B. and Marikawa, Y.(2003). Deviation of the blastocyst axis from the first cleavage plane does not affect the quality of mouse postimplantation development.Biol. Reprod.69, 1208-1212.
Barlow, P., Owen, D. A. and Graham, C.(1972). DNA synthesis in the preimplantation mouse embryo. J. Embryol. Exp. Morphol.27, 431-445.
Beck, F., Erler, T., Russell, A. and James, R.(1995). Expression of Cdx-2 in the mouse embryo and placenta: possible role in patterning of the extra-embryonic membranes. Dev. Dyn.204, 219-227.
Chambers, I., Colby, D., Robertson, M., Nichols, J., Lee, S., Tweedie, S. and Smith, A.(2003). Functional expression cloning of Nanog, a pluripotency sustaining factor in embryonic stem cells. Cell113, 643-655.
Chazaud, C., Yamanaka, Y., Pawson, T. and Rossant, J.(2006). Early lineage segregation between epiblast and primitive endoderm in mouse blastocysts through the Grb2-MAPK pathway. Dev. Cell10, 615-624.
Chisholm, J. C. and Houliston, E.(1987). Cytokeratin filament assembly in the preimplantation mouse embryo. Development101, 565-582.
Chroscicka, A., Komorowski, S. and Maleszewski, M.(2004). Both blastomeres of the mouse 2-cell embryo contribute to the embryonic portion of the blastocyst. Mol. Reprod. Dev.68, 308-312.
Damsky, C. H., Richa, J., Solter, D., Knudsen, K. and Buck, C. A.(1983). Identification and purification of a cell surface glycoprotein mediating intercellular adhesion in embryonic and adult tissue. Cell34, 455-466.
Deb, K., Sivaguru, M., Yong, H. Y. and Roberts, R. M.(2006). Cdx2 gene expression and trophectoderm lineage specification in mouse embryos. Science 311, 992-996.
Fleming, T. P.(1987). A quantitative analysis of cell allocation to trophectoderm and inner cell mass in the mouse blastocyst. Dev. Biol. 119, 520-531.
Gardner, R. L. (2007). The axis of polarity of the mouse blastocyst is specified before blastulation and independently of the zona pellucida. Hum. Reprod.22, 798-806.
Gardner, R. L. and Davies, T. J.(2003). The basis. and significance of pre-patterning in mammals. Philos. Trans. R. Soc. Lond. B Biol. Sci.358, 1331-1338; discussion 1338-1339.
Graham, C. F.(1971). The design of the mouse blastocyst. Symp. Soc. Exp. Biol. 25, 371-378.
Graham, C. F. and Lehtonen, E.(1979). Formation and consequences of cell patterns in preimplantation mouse development. J. Embryol. Exp. Morphol.49, 277-294.
Hiiragi, T. and Solter, D.(2004). First cleavage plane of the mouse egg is not predetermined but defined by the topology of the two apposing pronuclei.
Nature430, 360-364.
Houliston, E., Pickering, S. J. and Maro, B.(1989). Alternative routes for the establishment of surface polarity during compaction of the mouse embryo. Dev. Biol. 134, 342-350.
Johnson, M. H. and Ziomek, C. A.(1981). The foundation of two distinct cell lineages within the mouse morula. Cell24, 71-80.
Johnson, M. H. and Ziomek, C. A.(1983). Cell interactions influence the fate of mouse blastomeres undergoing the transition from the 16- to the 32-cell stage.
Dev. Biol. 95, 211-218.
Johnson, M. H. and McConnell, J. M.(2004). Lineage allocation and cell polarity during mouse embryogenesis. Semin. Cell Dev. Biol. 15, 583-597.
Johnson, M. H., Chakraborty, J., Handyside, A. H., Willison, K. and Stern, P.
(1979). The effect of prolonged decompaction on the development of the preimplantation mouse embryo. J. Embryol. Exp. Morphol.54, 241-261.
Johnson, M. H., Chisholm, J. C., Fleming, T. P. and Houliston, E.(1986). A role for cytoplasmic determinants in the development of the mouse early embryo? J. Embryol. Exp. Morphol.97 Suppl., 97-121.
Kelly, S. J.(1979). Investigations into the degree of cell mixing that occurs between the 8-cell stage and the blastocyst stage of mouse development. J. Exp. Zool.207, 121-130.
Kemler, R., Babinet, C., Eisen, H. and Jacob, F.(1977). Surface antigen in early differentiation. Proc. Natl. Acad. Sci. USA74, 4449-4452.
Kennedy, D.(2006). Editorial expression of concern. Science314, 592.
Kimber, S. J., Surani, M. A. and Barton, S. C.(1982). Interactions of blastomeres
suggest changes in cell surface adhesiveness during the formation of inner cell mass and trophectoderm in the preimplantation mouse embryo. J. Embryol. Exp. Morphol.70, 133-152.
Ko, M. S.(1992). Induction mechanism of a single gene molecule: stochastic or deterministic? BioEssays 14, 341-346.
Koutsourakis, M., Langeveld, A., Patient, R., Beddington, R. and Grosveld, F.
(1999). The transcription factor GATA6 is essential for early extraembryonic development. Development126, 723-732.
Kurimoto, K., Yabuta, Y., Ohinata, Y., Ono, Y., Uno, K. D., Yamada, R. G., Ueda, H. R. and Saitou, M.(2006). An improved single-cell cDNA amplification method for efficient high-density oligonucleotide microarray analysis. Nucleic Acids Res. 34, e42.
Kurotaki, Y., Hatta, K., Nakao, K., Nabeshima, Y. and Fujimori, T.(2007). Blastocyst axis is specified independently of early cell lineage but aligns with the ZP shape. Science316, 719-723.
Larue, L., Ohsugi, M., Hirchenhain, J. and Kemler, R.(1994). E-Cadherin null mutant embryos fail to form a trophectoderm epithelium. Proc. Natl. Acad. Sci. USA91, 8263-8267.
Louvet-Vallee, S., Vinot, S. and Maro, B.(2005). Mitotic spindles and cleavage planes are oriented randomly in the two-cell mouse embryo.Curr. Biol. 15, 464-469.
Maro, B., Gueth-Hallonet, C., Aghion, J. and Antony, C.(1991). Cell polarity and microtubule organisation during mouse early embryogenesis. Dev. Suppl.1, 17-25.
McAdams, H. H. and Arkin, A.(1997). Stochastic mechanisms in gene expression. Proc. Natl. Acad. Sci. USA94, 814-819.
Meno, C., Saijoh, Y., Fujii, H., Ikeda, M., Yokoyama, T., Yokoyama, M., Toyoda, Y. and Hamada, H.(1996). Left-right asymmetric expression of the TGF beta-family member lefty in mouse embryos. Nature381, 151-155.
Mitsui, K., Tokuzawa, Y., Itoh, H., Segawa, K., Murakami, M., Takahashi, K., Maruyama, M., Maeda, M. and Yamanaka, S.(2003). The homeoprotein Nanog is required for maintenance of pluripotency in mouse epiblast and ES cells. Cell113, 631-642.
Motosugi, N., Bauer, T., Polanski, Z., Solter, D. and Hiiragi, T.(2005). Polarity of the mouse embryo is established at blastocyst and is not prepatterned. Genes Dev.19, 1081-1092.
Nagy, A., Gertsenstein, M., Vintersten, K. and Behringer, R.(2003).
Manipulating the Mouse Embryo: A Laboratory Manual. New York: Cold Spring Harbor Laboratory Press.
Nichols, J., Zevnik, B., Anastassiadis, K., Niwa, H., Klewe-Nebenius, D., Chambers, I., Scholer, H. and Smith, A.(1998). Formation of pluripotent stem cells in the mammalian embryo depends on the POU transcription factor Oct4.
Cell95, 379-391.
Niwa, H., Toyooka, Y., Shimosato, D., Strumpf, D., Takahashi, K., Yagi, R. and Rossant, J.(2005). Interaction between Oct3/4 and Cdx2 determines trophectoderm differentiation. Cell123, 917-929.
Novick, A. and Weiner, M.(1957). Enzyme induction as an all-or-none phenomenon. Proc. Natl. Acad. Sci. USA43, 553-566.
O’Farrell, P. H., Stumpff, J. and Su, T. T.(2004). Embryonic cleavage cycles: how is a mouse like a fly?Curr. Biol. 14, R35-R45.
Okamoto, K., Okazawa, H., Okuda, A., Sakai, M., Muramatsu, M. and Hamada, H.(1990). A novel octamer binding transcription factor is differentially expressed in mouse embryonic cells. Cell60, 461-472.
Piotrowska-Nitsche, K. and Zernicka-Goetz, M.(2005). Spatial arrangement of individual 4-cell stage blastomeres and the order in which they are generated correlate with blastocyst pattern in the mouse embryo. Mech. Dev.122, 487-500.
Piotrowska-Nitsche, K., Perea-Gomez, A., Haraguchi, S. and Zernicka-Goetz, M.(2005). Four-cell stage mouse blastomeres have different developmental properties. Development132, 479-490.
Plusa, B., Hadjantonakis, A. K., Gray, D., Piotrowska-Nitsche, K., Jedrusik, A., Papaioannou, V. E., Glover, D. M. and Zernicka-Goetz, M.(2005). The first cleavage of the mouse zygote predicts the blastocyst axis. Nature434, 391-395.
Richa, J., Damsky, C. H., Buck, C. A., Knowles, B. B. and Solter, D.(1985). Cell surface glycoproteins mediate compaction, trophoblast attachment, and endoderm formation during early mouse development. Dev. Biol. 108, 513-521.
Roberts, R. M., Sivaguru, M. and Yong, H. Y.(2007). Retraction. Science317, 450.
Rosner, M. H., Vigano, M. A., Ozato, K., Timmons, P. M., Poirier, F., Rigby, P. W. and Staudt, L. M.(1990). A POU-domain transcription factor in early stem cells and germ cells of the mammalian embryo. Nature345, 686-692.
Rossant, J.(1975). Investigation of the determinative state of the mouse inner cell mass. I. Aggregation of isolated inner cell masses with morulae. J. Embryol. Exp. Morphol.33, 979-990.
Rossant, J.(2004). Lineage development and polar asymmetries in the peri-implantation mouse blastocyst. Semin. Cell Dev. Biol. 15, 573-581.
Rossant, J. and Lis, W. T.(1979). Potential of isolated mouse inner cell masses to form trophectoderm derivatives in vivo. Dev. Biol. 70, 255-261.
RESEARCH ARTICLE Development 134 (23)
Rossant, J. and Vijh, K. M.(1980). Ability of outside cells from preimplantation mouse embryos to form inner cell mass derivatives. Dev. Biol. 76, 475-482.
Rossant, J. and Tam, P. P.(2004). Emerging asymmetry and embryonic patterning in early mouse development. Dev. Cell7, 155-164.
Scholer, H. R., Ruppert, S., Suzuki, N., Chowdhury, K. and Gruss, P.(1990). New type of POU domain in germ line-specific protein Oct-4. Nature344, 435-439.
Sigal, A., Milo, R., Cohen, A., Geva-Zatorsky, N., Klein, Y., Liron, Y., Rosenfeld, N., Danon, T., Perzov, N. and Alon, U.(2006). Variability and memory of protein levels in human cells. Nature444, 643-646.
Smith, A.(2005). The battlefield of pluripotency. Cell123, 757-760.
Spudich, J. L. and Koshland, D. E., Jr(1976). Non-genetic individuality: chance in the single cell. Nature262, 467-471.
Strumpf, D., Mao, C. A., Yamanaka, Y., Ralston, A., Chawengsaksophak, K., Beck, F. and Rossant, J.(2005). Cdx2 is required for correct cell fate specification and differentiation of trophectoderm in the mouse blastocyst.
Development132, 2093-2102.
Surani, M. A. and Barton, S. C.(1984). Spatial distribution of blastomeres is dependent on cell division order and interactions in mouse morulae. Dev. Biol. 102, 335-343.
Takaoka, K., Yamamoto, M., Shiratori, H., Meno, C., Rossant, J., Saijoh, Y. and Hamada, H.(2006). The mouse embryo autonomously acquires anterior-posterior polarity at implantation. Dev. Cell10, 451-459.
Tarkowski, A. K. and Wroblewska, J.(1967). Development of blastomeres of
mouse eggs isolated at the 4- and 8-cell stage. J. Embryol. Exp. Morphol.18, 155-180.
Tolkunova, E., Cavaleri, F., Eckardt, S., Reinbold, R., Christenson, L. K., Scholer, H. R. and Tomilin, A.(2006). The caudal-related protein Cdx2 promotes trophoblast differentiation of mouse embryonic stem cells. Stem Cells 24, 139-144.
Torres-Padilla, M. E., Parfitt, D. E., Kouzarides, T. and Zernicka-Goetz, M.
(2007). Histone arginine methylation regulates pluripotency in the early mouse embryo. Nature445, 214-218.
Vestweber, D. and Kemler, R.(1985). Identification of a putative cell adhesion domain of uvomorulin. EMBO J.4, 3393-3398.
Vinot, S., Le, T., Ohno, S., Pawson, T., Maro, B. and Louvet-Vallee, S.(2005). Asymmetric distribution of PAR proteins in the mouse embryo begins at the 8-cell stage during compaction. Dev. Biol. 282, 307-319.
Yamanaka, Y., Ralston, A., Stephenson, R. O. and Rossant, J.(2006). Cell and molecular regulation of the mouse blastocyst. Dev. Dyn.235, 2301-2314.
Yoshida, C. and Takeichi, M.(1982). Teratocarcinoma cell adhesion: identification of a cell-surface protein involved in calcium-dependent cell aggregation. Cell28, 217-224.
Zernicka-Goetz, M.(2002). Patterning of the embryo: the first spatial decisions in the life of a mouse. Development129, 815-829.
Zernicka-Goetz, M.(2005). Developmental cell biology: cleavage pattern and emerging asymmetry of the mouse embryo.Nat. Rev. Mol. Cell Biol. 6, 919-928.