Georgia State University
ScholarWorks @ Georgia State University
Public Health Theses School of Public Health
Fall 12-15-2010
Elevated BMI-associated Characteristics of Patients
with Invasive MRSA Infection in the Atlanta,
Georgia Metro Area, 2005-2008
Lauren R. LorentzsonFollow this and additional works at:https://scholarworks.gsu.edu/iph_theses Part of thePublic Health Commons
This Thesis is brought to you for free and open access by the School of Public Health at ScholarWorks @ Georgia State University. It has been accepted for inclusion in Public Health Theses by an authorized administrator of ScholarWorks @ Georgia State University. For more information, please contact
Recommended Citation
Lorentzson, Lauren R., "Elevated BMI-associated Characteristics of Patients with Invasive MRSA Infection in the Atlanta, Georgia Metro Area, 2005-2008." Thesis, Georgia State University, 2010.
ABSTRACT
Lauren R. Lorentzson
Elevated BMI-associated characteristics of patients with invasive MRSA infection in the Atlanta, Georgia metro area, 2005-2008
(Under the direction of IKE S. OKOSUN, MS, MPH, PhD, FRSPH)
INTRODUCTION: The national obesity epidemic is leading to higher rates of Type 2
Diabetes, putting an increasing number of people at risk of exposure to bloodstreams infections with Methicillin Resistant Staphylococcus aureus (MRSA) upon onset of end stage renal disease and initiation of hemodialysis. While the risk of invasive bacterial infection in patients
undergoing hemodialysis is well documented, a link between greater adiposity and risk of invasive MRSA infection has not been researched.
AIM: The purpose of this study is to describe the epidemiological characteristics of patients with invasive MRSA in the Atlanta, Georgia metro area between 2005-2008; to examine associations between BMI-related health outcomes within the cohort; and to compare the proportions of BMI categories in this cohort to Georgia BRFSS BMI data.
METHODS: Population-based surveillance data collected by the CDC EIP ABCs program on invasive cases of MRSA in metro Georgia was used. BMI was calculated for each case with sufficient height and weight data. Statistical analysis was carried out in SPSS. Univariate and multivariate binary logistic regression analysis was performed on select variables. A p-value of < 0.05 and a 95% confidence interval (CI) were used to determine significance. BRFSS BMI data for Georgia was compared to the study population.
RESULTS: Overweight (BMI=25-29.9) and obese (BMI=30+) cases were more likely to be diagnosed with diabetes compared to individuals of normal BMI in both univariate and
multivariate analysis. Invasive MRSA patients suffering from diabetes were at greater odds of having undergone dialysis within the previous year (univariate analysis OR=2.3, p=0.000;
multivariate analysis OR=2.5, p=0.000). The proportion of invasive MRSA patients within this cohort with diabetes is much greater (42.8%) than in the general population of the United States (7.8-10.7%). The percent of obese cases was higher each year in the EIP iMRSA cohort
compared to BRFSS data, though whether these differences are statistically significant cannot be determined from these data.
cannot be calculated from these data. A prospective cohort study is suggested to determine the significance of the relationship between greater BMI and invasive MRSA.
INDEX WORDS: body mass index, BMI, Methicillin Resistant Staphylococcusaureus, MRSA,
Elevated BMI-associated characteristics of patients with invasive
MRSA infection in the Atlanta, Georgia metro area, 2005-2008
by
Lauren R. Lorentzson
B.A., Agnes Scott College
A Thesis Submitted to the Graduate Faculty of Georgia State University in Partial Fulfillment
of the
Requirements for the Degree
MASTER OF PUBLIC HEALTH
ATLANTA, GEORGIA
Elevated BMI-associated characteristics of patients with invasive
MRSA infection in the Atlanta, Georgia metro area, 2005-2008
By
LAUREN R. LORENTZSON
Approved:
__Ike Okosun, MS, MPH, PhD, FRSPH Committee Chair
_________
__Sandra Bulens, MPH Committee Member
______________________
_Russell Kempker, MPH Committee Member
_____________________
_12-6-2010 Date
iii
DEDICATION
To my mother, for all her love, hard work, and sacrifice. To my father, for all of his dedication to me and my education. To Sandie and Stepy for believing in and encouraging me from the
beginning. To Katie for years of guidance and unwavering support.
iv
ACKNOWLEGMENTS
I want to thank all of my wonderful professors who have taught me so much, and to express my gratitude to all faculty and staff at the Institute of Public Health at Georgia State University. I owe my deepest thanks to my committee members, Sandra Bulens and Russell Kempker, and most of all to my chair, Dr. Ike Okosun.
I would also like to express my appreciation to Katie Arnold at the Georgia Division of Public Health, and to Janine Ladson, Susan Lance, Katherine Mills, and everyone else at the Georgia EIP Program for counseling me and allowing me to use their hard earned data.
Author’s Statement Page
In presenting this thesis as a partial fulfillment of the requirements for an advanced degree from Georgia State University, I agree that the Library of the University shall make it available for inspection and circulation in accordance with its regulations governing materials of this type. I agree that permission to quote from, to copy from, or to publish this thesis may be granted by the author or, in his/her absence, by the professor under whose direction it was written, or in his/her absence, by the Associate Dean, College of Health and Human Sciences. Such quoting, copying, or publishing must be solely for scholarly purposes and will not involve potential financial gain. It is understood that any copying from or publication of this dissertation which involves potential financial gain will not be allowed without written permission of the author.
_______Lauren Lorentzson Signature of Author
Notice to Borrowers
All theses deposited in the Georgia State University Library must be used in accordance with the stipulations prescribed by the author in the preceding statement.
The author of this thesis is:
Lauren Lorentzson
2111 Jefferson Square Court Decatur, GA 30030
The Chair of the committee for this thesis is:
Ike Okosun
Institute of Public Health Health and Human Services Georgia State University P.O. Box 4018
Atlanta, Georgia 30302-4018
Users of this thesis who are not regularly enrolled as students at Georgia State University are required to attest acceptance of the preceding stipulation by signing below. Libraries borrowing this thesis for the use of their patrons are required to see that each user records here the
information requested.
NAME OF USER ADDRESS DATE TYPE OF USE
Lauren Lorentzson 2111 Jefferson Square Court
Decatur, GA 30030 404-769-8741
Education
Georgia State University, Atlanta, GA
Master of Public Health, Prevention Sciences – Fall 2010
Agnes Scott College, Decatur, GA
Bachelors of Arts, Anthropology/Sociology 2005 – Fall 2005
Work Experience
Georgia Division of Public Health, Atlanta, GA October 2005 - Present
Professional Healthcare Worker; Student Employee
Georgia State University, Institute of Public Health, Atlanta, GA December 2007 - Present
ING Marathon Study; Graduate Research Assistant
Georgia Division of Public Health, Atlanta, GA August 2009 – November 2009
Coverdell Stroke Registry; Student Practicum
Publications
heat-related morbidity among adult recreational endurance athletes. International Journal of Biometeorology, 54(4), 441-448. DOI:
Daily, P, Aragon, D, Burnite, S, Daniels, A, Fraser, Z, et. al. Trends in perinatal group B streptococcal disease - United States, 2000-2006. Morb Mortal Wkly Rep 2009,
58(5):109-12. (PMID
Skills
viii
TABLE OF CONTENTS
Page
ACKNOWLEDGMENTS ...iv
LIST OF TABLES ...x
LIST OF FIGURES ... .xi
LIST OF ABBREVIATIONS………....xii
CHAPTERS 1. INTRODUCTION ...1
1.1 Background………...1
1.2 Purpose of the Study………...3
1.3 Hypothesis………...4
2. REVIEW OF THE LITERATURE...6
2.1 Methicillin Resistant Staphylococcus aureus (MRSA)………...6
2.2 MRSA in Georgia………...8
2.3 BMI………...9
2.4 Obesity in America………....10
2.5 Diabetes……….11
2.6 Obesity and Type 2 Diabetes………....12
2.7 Diabetes and Infection ………...12
2.8 Obesity and Infection Risk………...12
2.9 Diabetes and MRSA………...13
2.10 Type 2 Diabetes and Dialysis………..14
2.11 Dialysis………....14
2.12 Dialysis and MRSA………....15
3. METHODS……….16
3.1 Data Source………..….16
3.2 Inclusion/Exclusion Criteria………...17
3.3 BMI Calculation………...18
3.4 Definitions………....18
3.4.1 BMI Categories………...18
3.4.2 EIP Definitions……….….19
3.5 Analysis………....21
4. RESULTS……….…..22
4.1 Demographics………...22
4.2 Correlations………...31
ix
5. DISCUSSION……….….36
5.1 Discussion of Results……….….36
5.2 Limitations……….……...37
5.3 Recommendations………...…...37
5.4 Public Health Significance……….….38
5.5 Conclusion……….…..40
x
LIST OF TABLES
Table 4.1 Frequencies and Descriptive Statistics for BMI Among iMRSA Cases, Georgia Metro
Atlanta Area………...22
Table 4.2 Frequency and Percent of iMRSA Cases by Demographic Category, Georgia Metro
Atlanta Area, 2005-2008………23
Table 4.3 Frequency and Percent of Selected Health Risks Among iMRSA Cases in the Georgia
Metro Atlanta Area, 2005-2008……….24
Table 4.4 Proportions of iMRSA Cases in the Georgia Metro Atlanta Area, 2005-2008 with
Diabetes and/or Dialysis Diagnosis………...28
Table 4.5 Comparison of Diabetes and Obesity Proportions in MSA Counties and EIP iMRSA
Data, 2005-2008……….29
Table 4.6 Dialysis Rates in the both iMRSA Cohort and General Population, Georgia Atlanta
Metro Statistical Area, 2005-2008……….30
Table 4.6 Univariate and Multivariate Analysis of the Association Between Selected
Independent Variables with Diabetes in Subjects with Invasive MRSA Infections within the 8 County Metro Area of Georgia, 2005-2008 (α=0.05; 95% C.I.)………...31
Table 4.7 Univariate and Multivariate Analysis of the Association Between Selected
Independent Variables with Dialysis within the Year Prior to Invasive MRSA Infection within the 8 County Metro Area of Georgia, 2005-2008 (α=0.05; 95% C.I.)………..32
Table 4.8 BRFSS and EIP iMRSA Populations’ BMI Proportion by Category (Normal,
xi
LIST OF FIGURES
Figure 1.1 Possible Disease Pathways to Susceptibility to MRSA and iMRSA Infection in the
Obese………3
Figure 4.1 Histogram Curve of Age of iMRSA Cases in the Georgia metro Atlanta area,
2005-2008 with Normal Curve and Descriptive Statistics………..25
Figure 4.2 Histogram of Raw BMI Scores Among iMRSA Cases in the Georgia metro Atlanta
area, 2005-2008 with Normal Curve and Descriptive Statistics………26
Figure 4.3 Bar Graph of BMI Categories (Underweight, Normal, Overweight, Obese) Among
iMRSA Cases in the Georgia metro Atlanta area, 2005-2008 with Normal Curve and Descriptive Statistics……….27
Figure 4.4 BarGraph Comparison of BMI Category Proportions by Population for BRFSS and
xii
LIST OF ABBREVIATIONS
ABCs – Active Bacterial Core surveillance
BMI – Body Mass Index
CA – Community Associated
CA-MRSA – Community Associated Methicillin Resistant Staphyloccocus aureus
CAPD – Continuous Ambulatory Peritoneal Dialysis
CCPD – Continuous Cycling Peritoneal Dialysis
CDC – Centers for Disease Control and Prevention
CHF – Congestive Heart Failure
CSF – Cerebrospinal Fluid
CVC – Central Venous Catheter
CVD – Cardiovascular Disease
DRFI – Diabetes Related Foot Infection
EIP – Emerging Infections Program
ESRD – End Stage Renal Disease
FFM – Fat Free Mass
FM – Fat Mass
ICU – Intensive Care Unit
iMRSA – Invasive Methicillin Resistant Staphyloccocus aureus
MRSA – Methicillin Resistant Staphyloccocus aureus
NHANES – National Health and Nutrition Examination Survey
xiii
PN – Peripheral Neuropathy
SHIELD – Study to Help Improve early evaluation and management of risk factors Leading to Diabetes
SSTI – Skin and Soft Tissue Infection
USRDS – United States Renal Data System
UTI – Urinary Tract Infection
1
CHAPTER I INTRODUCTION
1.1 Background
Staphylococci are common bacteria, and many humans carry Staphylococcus aureus on the skin
and nares (the nostrils and nasal passages) as part of typical bacterial flora in healthy individuals
Invasive infections with MRSA are serious and can be fatal (Klevens, Morrison, Nadle,
Petit, & Gershman, 2007). An infection is defined as invasive if laboratory culture grows
organisms from a body site that is considered sterile under normal conditions (“Sterile,” Mosby’s
Medical Dictionary, 2009). That is, the site is not normally open to contact with the outside
environment and possible bacterial, viral, or fungal contamination. Invasive culture sources
include blood, cerebrospinal fluid (CSF), synovial fluid, pericardial fluid, peritoneal fluid,
pleural fluid, bone, surgical aspirate, and internal body sites (such as samples of tissues
surgically obtained from the heart, brain, liver, lymph nodes, etc.) (CDC, 2010c).
(Kluytmans, van Belkum , & Verbrugh, 1997; Davis, Stewart, Crouch, Flores, & Hospinthal,
2004; Hidron, Kourbatova, Halvosa, Terrell, & McDougal, 2005). An emerging public health
problem is the rising pervasiveness of antibiotic resistant strains of common bacteria.
Methicillin Resistant Staphylococcus aureus (MRSA) is a multi-drug resistant gram-positive
bacterium (Porter, & Kaplan, 2008) now common in hospitals and other healthcare delivery
settings (National Institute of Allergy and Infectious Diseases, 2009). MRSA strains have
developed intermediate and complete resistance to a wide spectrum of antibiotics, particularly
beta-lactam antibiotics such as cephalosporins and penicillin derivatives traditionally used to
treat Staphylococcus aureus infections (Centers for Disease Control and Prevention, 2005;
Chambers, 2001). MRSA is now a widespread, virulent nosocomial pathogen typically showing
intermediate or complete resistance to multiple antibiotics, and infections can be difficult to treat
(Cooper, & Medley, 2004). Complicating this problem, as a consequence of these protective
mutations, MRSA organisms concurrently developed virulence factors that can lead to more
severe and fatal infections, even in previously healthy individuals (Baba, Takeuchi, Kuroda,
2
Another emerging public health concern is the climbing national obesity rate. The
prevalence of obesity in the United States has been increasing since the 1970s (Flegal, Carroll,
Ogden, & Curtin, 2010), and the 2005-2006 the National Health and Nutrition Examination
Survey (NHANES) survey revealed that 32.7 percent of adults over twenty are overweight, and
40.2 percent are either obese (BMI ≥ 30) or extremely obese (BMI ≥ 40) (Centers for Disease
Control and Prevention, 2010d). Some chronic health consequences of high adiposity include
onset of chronic diseases such as cardiovascular disease (CVD) (American Heart Association,
2010), congestive heart failure (CHF) (Kenchaiah, Evans, Levy, Wilson, & Benjamin, 2002),
end stage renal disease (ESRD) (Hsu, McCulloch, Iribarren, Darbinian, & Go, 2006),
hypertension (Thorpe, Florence, Howard, & Joski, 2004), dyslipidemia (Coenen, & Hasty,
2007),and cancer (American Cancer Society, 2001).
Increasing rates of overweight and obesity in the United States have a positive statistical
relationship with rising rates of Type 2 Diabetes (CDC, 2007). The overweight are particularly
at risk of developing insulin resistance (World Health Organization, 2003; Fowler, 2010). One
consequence of diabetes is ESRD—failure of the kidneys (Keene, 2003), making dialysis
treatment necessary (American Diabetes Association, 2010b). According to the Centers for
Disease Control and Prevention National Diabetes Fact Sheet 2007, “Diabetes is the leading
cause of kidney failure, accounting for 44% of new cases in 2005” in the United States and
Puerto Rico (CDC, 2007). According to data from the Medical Expenditure Panel
Survey-Household Component (MEPS-HC), 79% of diabetic patients were overweight or obese in 2001
(Stagnitti, 2001), and a study published in the Journal of Renal Nutrition found that 60 of 296
chronic hemodialysis patients (20%) were obese (BMI≥28), with poorer morbidity and mortality
outcomes for the obese members of this population (Wallace, Kleinfeld, Schlereth, & Letteri,
1996). Due to the nature of dialysis treatment, during which the blood is cleansed by a machine,
a patient’s vascular system is vulnerable to invasion by outside organisms. Dialysis centers are
common sites for the acquisition of healthcare-associated infection (Morbidity and Mortality
Weekly Review, 2001), and dialysis patients are at increased risk of invasive and fatal infection
(Allon, Radeva, Bailey , Beddhu, & Butterly, 2005; MMWR, 2007a). Considering all of these
factors, the overweight and obese are vulnerable to bacterial infection via multiple potential
3
and its subsequent complications (including foot ulcers that may become infected (Freykberg,
2002), increased exposure to healthcare settings where drug-resistant bacteria are common, and
the necessity for chronic hemodialysis if diabetic nephropathy progresses to renal failure.
Invasive bloodstream infections with MRSA are associated with dialysis treatment, and
dialysis is necessary for survival upon onset of ESRD. End stage renal failure is commonly a
consequence of long-term or poorly managed type 2 Diabetes, and Type 2 Diabetes develops as a
result of chronic obesity. Therefore, obesity may raise the risk of iMRSA infection. In fact,
exposures and susceptibilities to MRSA arise at each step in the chain of increased risk of
[image:19.612.73.539.325.601.2]iMRSA from obesity to dialysis, illustrated in Figure 1.1.
Figure 1.1 Possible Disease Pathways to Susceptibility to MRSA and iMRSA Infection in the Obese
Multiple obesity-related factors increase the likelihood of exposure to environments notorious
for MRSA contamination. An obese individual may develop health conditions that necessitate
visits to healthcare facilities, increasing exposure. Also, in some obese individuals, immune
4
development of diabetes, new risks for MRSA infection emerge, such as ulcers that may become
infected and hospital admission for amputations. This figure is not meant to imply that
progression to chronic disease and dialysis is inevitable, only that some proportion within each
group will progress to the next stage of disease. The factors presented in this figure are
explained in more detail in the literature review.
1.2 Purpose of the Study
Due to the prevalence of overweight and obesity in developed countries, as well as the severity
of invasive Methicillin Resistant Staphylococcus aureus (iMRSA) infections, an association
between greater adiposity and iMRSA would be of significant concern. If obesity is a risk factor
for iMRSA infection, higher rates of death and disability from this infectious disease may be
seen due to the rising prevalence of obesity. Body mass index has emerged as a potential risk
factor for general MRSA infections in some studies (Kellner, Yeung, Cook, Kornblum, & Wong,
2009). This study will focus on adiposity-related risk factors, such as diabetes and hemodialysis,
among a population of patients with an invasive MRSA infection.
The purpose of this study is to:
1.) describe the demographics of a population of iMRSA patients in
the metro Atlanta Georgia area from 2005-2008
2.) describe proportions of BMI categories, patients with diabetes, and patients
undergoing dialysis within this population
3.) to compare proportions of BMI categories in this population to BRFSS data
for Georgia
4.) perform univariate and multivariate logistic regression analysis of the
association between selected independent variables with diabetes and dialysis
within the iMRSA population
1.3 Hypothesis
5
1.) the proportion of iMRSA patients with Type 2 Diabetes and/or undergoing dialysis
in the EIP iMRSA population will be higher than is found in the general population of
Georgia
6
CHAPTER II
REVIEW OF THE LITERATURE
2.1 Methicillin Resistant Staphyloccocus aureus (MRSA)
Staphylococcal bacteria are gram-positive cocci that tend to form in clusters (Carrico, 2005, p.
69-2) and grape-like bunches, associated with boils, skin infections, and septicemias
(“Staphylococcus,” The American Heritage Dictionary, 2009). Staphylococcus aureus is one of
many Staphylococcus species (“Staphylococcus aureus,” Mosby’s Medical Dictionary, 2009),
and causes a variety of localized and invasive infections, as well as three toxin-medicated
syndromes (“Staphylococcus infections,” Pickering, Baker, & Long, 2006; “Staphylococcus.”
The American Heritage Science Dictionary). Due to its many surface proteins, which help the
bacteria to “stick” to skin and objects, Staphyloccocus aureus often causes foreign body
infections, such as those associated with intravascular and peritoneal catheters, prosthetic valves,
and other devices (Pickering, Baker, & Long, 2006; Darouiche, Landon, Patti, Nguyen, &
Fernau, 1997). Identification of staphylococcal infections is made by Gram stain and culture of
infected, purulent material (Isselbacher, Brunwald, Wilson, Martin, & Fauci, 1994).
Historically, Staphylococcus aureus infections have been associated with healthcare
facilities (Thompson, Cabezudo , & Wenzel, 1982), and are widespread in nosocomial
infections. The prevalence of antibiotic-resistant organism infections in healthcare settings and
outpatient dialysis centers has been increasing rapidly over the last ten years (Berns, 2003).
Notably, “S. aureus is one of the most common organisms causing all types (primary and
secondary) of healthcare-associated bacteremia (Carrico, 2005, p. 69-7).” Staphylococcus aureus
and MRSA are spread primarily through skin-to-skin direct contact (Georgia Department of
Community Health, 2010), making hand washing an essential tactic for prevention of spread,
especially for hospital personnel (Mandell, Bennett, & Dolin, 2000). Estimates of carriers within
the general population range from 20% to 50% (Carrico, 2005, p. 69-5; Mandell, Bennett, &
7
1997). Healthcare workers have a higher nasal carriage rate, estimated to be between 50% and
90% (Carrico, 2005, p. 69-5; Mandell, Bennett, & Dolin, 2000).
Since the 1970s, Staphylococcus aureus has become increasingly resistant to penicillin
and semi-synthetic penicillin antimicrobials such as methicillin, oxacillin, and nafcillin. By
producing an enzyme called beta-lactamase, S. aureus has become resistant to beta-lactam
antibiotics through intrinsic resistance, also known as “methicillin resistance” (Mandell, Bennett,
& Dolin, 2000). Methicillin-susceptible Staphylococcus aureus is abbreviated MSSA, and
Methicillin-resistant Staph aureus is abbreviated MRSA. MRSA bacteria are not only resistant
to methicillin, however. Resistance to cephalosporins, erythromycins, clindamycin,
tetracyclines, and aminoglycosides is also common (Carrico, 2005), with resistance to the
glycopeptide antibiotic vancomycin rare, but on the rise (Evans, & Brachman, 1998; Fridkin,
Hageman, McDougal, Mohammed, & Jarvis, 2003). According to the Control of Communicable
Diseases Manual, “The majority of clinical isolates of Staphylococcus aureus, both hospital and
community acquired, are resistant to penicillin G, and multiresistant (including methicillin
resistant) strains have become widespread (Chin, 2000).” Likewise, the APIC Text of Infection
Control and Epidemiology states that, “At present [2005] more than 90% of community- and
hospital-acquired Staphylococcus aureus isolates are resistant to penicillin (Carrico, 2005).”
There are currently many major MRSA strains and clones (Enright, Robinson, Randle, Feil, &
Grundmann, 2002) representing a complicated spectrum of resistance and susceptibility.
MRSA infections are defined epidemiologically in various ways, depending on the
location of likely exposure. A common definition of ‘healthcare-associated, healthcare onset’
(HAHO) infection identifies patients that have been admitted to a hospital or healthcare facility
for more than forty-eight hours at the time of first positive culture (Evans, & Brachman, 1998).
Some non-hospital healthcare facilities that represent possible exposures include dialysis centers
and long-term care facilities such as nursing homes, chronic care facilities, and rehabilitation
centers. Alternatively, an MRSA infection may be considered ‘healthcare-acquired, community
onset’ (HACO) or ‘community associated’ (CA). A patient with a HACO invasive MRSA
infection is a patient with a laboratory confirmed sterile site isolate of MRSA that was collected
8
hospital and has had one or a combination of the following: history of hospitalization, surgery,
dialysis, central venous catheter or residence in a long term care facility in the previous year.
HACO infections with MRSA are of increasing concern (Larsen, Stegger, Böcher, Sørum, &
Monnet, 2009; Limbago, Fosheim, Schoonover, Crane, & Nadle, 2009). Community acquired
(CA) infections are identified if an infection site culture is collected within less than forty-eight
hours after admission and no healthcare exposures are known within the last year (CDC, 2006).
2.2 MRSA in Georgia
Passive surveillance of ‘severe’ community-associated MRSA (CA-MRSA) has been ongoing at
the Georgia Department of Community Health, Division of Public Health (all counties) since
2004. The case definition for “severe community-associated” infection is restricted to cases
leading to death, intensive care unit (ICU) admission, operative debridement, pneumonia, or
invasive infection, and limited to cases that have not been resident in a chronic care or other
healthcare facility within the past year, no hospitalizations within the last year, and a positive
culture within 48 hours of hospital admission. According to the 2008 Georgia Data Summary on
CA-MRSA (Georgia Department of Human Resources, 2008), cases of severe CA-MRSA
reported to the surveillance system have averaged 568 per year, with 589 reported in 2008. In
2008, 57% of cases were white, and 39% of cases were black. In 2005, the incidence was
5.1/100,000. Adult males are affected by CA-MRSA more than any other age or sex group.
Skin and soft tissue infections (SSTIs) were the most common types of infection, with primary
bacteremia and pneumonia next, in that order. Twenty-four patients with severe CA-MRSA died
in 2008. Around half of these were aged 60 or older.
A report on severe CA-MRSA in Georgia from the Georgia DHR Division of Public
Health (Arnold, Bulens, 2005) reports 564 confirmed reports, 59% male. Thirteen deaths were
reported, 8 among previously healthy young people. Also noted is a cluster of necrotizing
MRSA pneumonia cases during the 2005 flu season, and an association between SSTIs and
methamphetamine use. CA-MRSA rates were higher in the north and northwestern counties of
the state. The highest rates were reported in children 2 years old or younger.
An MMWR article entitled Severe Methicillin-Resistant Staphylococcus aureus
Community-Acquired Pneumonia Associated with Influenza --- Louisiana and Georgia,
9
Georgia of CA-MRSA pneumonia secondary to influenza infection in 2006 (reported in January
2007). The article emphasizes the potential for CA-MRSA pneumonia infections to become
necrotic and fatal citing the poor outcomes for the 10 cases, including 6 deaths, among
previously healthy young people, including an 8 year old from Georgia. Another MMWR report
includes descriptions of three MRSA skin infection outbreak investigations within the Georgia
corrections system (MMWR, 2003). The investigations described included a total of 192
confirmed and 29 possible cases of MRSA SSTIs among inmates in 3 jails. No deaths were
reported.
In 2005, a prospectively enrolled case-control study of increased SSTI MRSA infections
among patients at a sliding-scale fee clinic in rural Georgia (Cohen, & Shuler, 2007) uncovered a
link between methamphetamine use and the risk of MRSA SSTIs. MRSA accounted for greater
than two-thirds of the SSTIs in the community, among the highest reported rates in the United
States. The crude OR for methamphetamine use and the MRSA SSTI was 5.64 (1.80–17.69),
and the adjusted OR was 5.10 (1.55–16.79) for those who reported drug use within the last three
months prior to the survey.
A 2009 report on iMRSA predictors for mortality based on the CDC EIP data (Kempker,
2009) showed 4,791 total cases of iMRSA that met the EIP case definition, with 58% being
classified as HACO, 26.8% as HAHO, and 14.4% as CA. Less than 1% were unidentified. The
incidence rate was 38/100,000 in 2005, decreasing to 26.9/100,000 in 2008. Rates were highest
among males, African Americans, persons 65 years of age or older, and HIV positive cases each
year. The USA300 (most common community-associated DNA strain of MRSA) genotype was
associated with higher in-hospital mortality than other genotypes (determined by pulse field gel
electrophoresis (PFGE)). Using the Cox proportional hazards method, hazards ratios (HR) were
determined to be significant for increased in-hospital mortality for MRSA with USA300
genotype (HR 1.73, 95% CI 1.21-2.48), and increasing age per year (HR 1.04, 95% CI
1.03-1.05).
2.3 BMI
BMI is a score based on the ratio of height to weight, squared (Garrow, & Webster, 1985). It is
10
an elevated BMI is an indicator of greater weight than would be expected of a normal person of
the same height (National Institutes of Health, 1998). This extra weight is often attributed to
excess body fat. BMI is one of the most commonly used measurement tools for determining
nutritional status in regards to a healthy body composition (CDC, 2010a).
It is important to note that BMI is an index, and is therefore best applied to an aggregate,
and is not an appropriate measure on its own to determine excess adiposity in an individual. A
person’s weight, and therefore BMI, may fluctuate based on relative changes in fat-free mass
(FFM), such as muscle mass, and fat mass (FM). Since raw weight and height data are used to
calculate BMI, this measure is occasionally criticized as a poor measure of true adiposity and
health for an individual (Guida, 2005). For example, BMI may be ‘artificially’ elevated for an
individual with greater FFM (Prentice, & Jebb, 2001). An individual may, through exercise and
diet, lose fat mass, gain an equal amount of muscle mass, and have the same BMI. Therefore,
BMI is limited as a measure of health risk and adiposity, especially for an individual, but is
useful to measure trends at the population level (Keyes, Fidanza, Karvonen, Kimura, & Taylor,
1972), and is useful when only raw height and weight data are available to the researcher.
2.4 Obesity in America
Obesity rates and prevalence have risen sharply since the 1980s in the United States (CDC,
2009) and in many countries around the world (WHO, 2003). This increase is a threat to public
health due to the association of obesity with chronic disease (Mokdad, Serdula, Dietz, Bowman,
& Marks, 1999). It is estimated that each year 300,000 adults die as a result of adiposity-related
disease (Allison, Fontaine, Manson, Stevens, & VanItallie, 1999). Fortunately, some data
indicate that the increase in the prevalence of overweight may be slowing. NHCS data detected
no statistically significant change in obesity prevalence from 2003-2004 and 2004-2005 (Ogden,
Carroll, McDowell, Flegal, 2007). However, thirty-three states had an obesity prevalence of at
least 25%, and nine states had an obesity rate of 30% or above in 2009, according to the CDC
(CDC, 2010f). Obesity increases the likelihood of Type 2 Diabetes and infections, discussed
below. The prevalence of obesity (BMI≥30) was 20.9% in 2001 (Mokdad, Mokdad, Bowman,
11
2.5 Diabetes
When endogenously produced insulin fails to control blood glucose levels due to impaired
insulin secretion or action—or a combination of the two—the resulting condition is called
diabetes (Childs, Cypress, & Spollett, 2005, p. 2). The three most common types of diabetes are
Type 1, Type 2, and gestational, though there are other, less common causes (National Institute
of Diabetes and Digestive and Kidney Diseases, 2008). Diabetes is diagnosed by one of three
tests: a causal blood glucose test given without regard to time of last meal, along with symptoms
of diabetes, with a resulting plasma glucose level of >200 mg/dl; a fasting (no food within the
previous eight hours, at least) blood glucose level of >126 mg/dl; an oral glucose tolerance test
with a plasma glucose level of >200 mg/gl (American Diabetes Association, 2005). It is
estimated that of those diagnosed with diabetes, around 5-10% have Type 1 Diabetes (ADA,
2009). Type 2 Diabetes is also called adult onset diabetes mellitus (AODM), and is often caused
by preventable behaviors such as a combination of poor diet and low exercise (New England
Journal of Medicine, Diabetes Prevention Program Group, 2002). Physician-guided diet and
exercise are the ideal interventions and treatments for diabetes mellitus, particularly those in the
earliest stages of insulin resistance (Bennett, & Plum, 1996).
Type 2 Diabetes progresses through a stage identified as ‘pre-diabetes.’ If mediated in this stage
by a healthcare professional, pre-diabetes can be managed, treated, and reversed, and chronic
Type 2 Diabetes can be avoided. Pre-diabetes is defined by Dorland’s Medical Dictionary as “a
state of latent impairment of carbohydrate metabolism in which the criteria for diabetes mellitus
are not all satisfied (Dorland, 1981).” Chronic diabetes mellitus (insulin resistance) is not
inevitable, though it is eminent if lifestyle changes do not take place. In the year 2000, diabetes
was the sixth leading cause of death in the United States (CDC, 2002).
Patients with Type 2 Diabetes must control their glucose levels with insulin injections,
pumps, or pills to remain healthy (CDC, 2010e). Complications of diabetes include potential
loss of eyesight, decreased circulation in the extremities, ulcers in the feet and extremities,
damage to the kidneys, and chronic/permanent renal failure requiring the patient to submit to
dialysis treatments. Without proper management and cooperation between patient and doctor,
12
2.6 Obesity and Type 2 Diabetes
According to the American Diabetes Association, there are 17.9 million diagnosed cases of Type
2 Diabetes in America, with approximately 5.7 million cases undiagnosed. In addition, there are
about 57 million pre-diabetic citizens who may go on to develop the disease. The incidence is
increasing annually, with “1.6 million new cases of diabetes…diagnosed in people aged 20 and
older in 2007 (ADA, 2010c).” The majority of adults with diabetes are overweight or obese
(MMWR, 2004). Higher BMI is associated with an increased prevalence of diabetes mellitus in
both SHIELD and NHANES national surveys (Bays, Chapman, & Grandy, 2007).
2.7 Diabetes and Infections
Diabetic patients are at higher risk for certain infections due to complications of the disease.
Although skin infections in patients with well-maintained diabetes occur at a comparable rate to
the general population, around 20-50% of Type 2 diabetes patients experience some form of skin
infection, and these infections are often more severe and difficult to treat (Childs, Cypress, &
Spollett, 2005, p.152). Diabetes is a risk factor for peripheral artery disease (Murabito,
D’Agostino, & Silbershatz, 1997), which can lead to gangrene and foot or limb amputations
(Childs, Cypress, & Spollett, 2005, p.369). Diabetic cystopathy predisposes diabetics to urinary
tract infections (UTIs) (Childs, Cypress, & Spollett, 2005, p.369). Diabetic neuropathy, or
peripheral neuropathy (PN) due to chronic hyperglycemia, is the most common long-term
complication in diabetic patients (Childs, Cypress, & Spollett, 2005, p.155). This is in part due
to reduced circulation and sensation in the extremities that occurs over time as diabetes
advances. PN can cause loss of sensation, and in the absence of pain calluses may form in areas
of pressure, eventually leading to tissue breakdown and ulcers (Childs, Cypress, & Spollett,
2005, p.157). These ulcers are susceptible to invasive infection.
2.8 Obesity and Infection Risk
There are several factors that may increase the likelihood of infection in obese and morbidly
obese individuals. This population is at greater risk for intertrigo, a condition of inflammation of
13
folds (Janniger, Schwartz, Szepietowski, & Reich, 2005). Obesity can increase the number and
surface area of skin folds, and therefore the likelihood of developing intertrigo (Hahler, 2006).
The inflamed skin can become infected if not treated properly. Good hygiene practices are
essential in the prevention of these types of infections. Although the reasons are still poorly
understood, studies have shown that obese individuals have a lowered immune response
compared to normal weight individuals (Falagas, & Kompoti, 2006; Marti, Marcos, & Martinez,
2001; Tanaka, Inoue, Isoda, Waseda, & Ishihara, 1993), heightening risk for infection.
Obese patients are more likely to suffer from post-surgical and nosocomial infections,
such as pneumonia and surgical site infections (Dossett, Dageforde, Swenson, Metzger, &
Bonatti, 2009; Jørgensen, Ravlo, & Richelsen, 2006). Although the reasons are still poorly
understood, studies have shown that obese individuals have a lowered immune response
compared to normal weight individuals (Falagas, & Kompoti, 2006; Marcos, & Martínez, 2001;
Tanaka, Inoue, Isoda, Waseda, & Ishihara, 1993), which heightens their risk for infectious
disease (Marti, Marcos, & Martinez, 2001; Tanaka, Inoue, Isoda, Waseda, & Ishihara, 1993).
Although obesity is most often associated with chronic disease (WHO, 2010; Haslam, & James,
2005), the risk of infectious disease among the overweight population is worthy of attention due
to possible impaired immune response.
2.9 Diabetes and MRSA
Underlying conditions of interest for Staphylococcus aureus infection include diabetes and
chronic renal failure (Evans, & Brachman, 1998). The Red Book 2006 Report of the Committee
on Infectious Diseases states that, “Risk factors for severe S aureus infections include chronic
disease, such as diabetes mellitus (Pickering, Baker, & Long, 2006).” It is important to note that
diabetics receiving insulin injections (as well as intravenous drug users), and hemodialysis or
peritoneal dialysis patients have a higher nasal carriage rate Staphylococcus aureus than the
general population (Carrico, 2005; Mandell, Bennett, & Dolin, 2000; Evans, & Brachman, 1998,
p.661). In addition to greater rates of colonization and the necessity for skin barrier-breaching
injections of insulin, diabetic foot ulcers are also susceptible to MRSA infection. In a study of
14
MRSA (Yates, May, Hale, Allard, & Rowlings, 2009). DRFIs caused by MRSA are related to
MRSA nasal carriage (Stanaway, Johnson, Moulik, & Gill, 2007).
2.10 Type 2 Diabetes and Dialysis
End-stage renal failure requiring dialysis is oneof the most serious complications of diabetes
Diabetes is the most common cause of chronic kidney disease and kidney failure
(National Institute of Diabetes and Digestive and Kidney Diseases, 2009). Though 70-80% of
diabetics never develop kidney failure (Childs, Cypress, & Spollett, 2005, p. 122), diabetes
accounted for approximately 44% of new reported cases of kidney failure as of 2009, according
to the U.S. Renal Data System (USRDS, 2009). The prevalence of diabetes-related dialysis is
increasing. According to the results of one population-based cohort study in Ontario, Canada
(with over 8 million participants), “the average annual incidence rate of
mellitus. According to the Cecil Textbook of Medicine, “End-stage renal disease (ESRD)…in
the Type 2 diabetic population…constitutes the majority of diabetic patients seeking therapy for
ESRD. Overall, diabetes is the leading cause and accounts for one third of the ESRD cases in
the United States (Bennett, & Plum, 1996 p.1273).”
dialysis was 12times
greater in persons with diabetes (130 per 100,000) vs.without diabetes (11 per 100,000)…The
average annual prevalence rate was 10 times greater in the
2.11 Dialysis
diabetic cohort (Lok, Oliver,
Rothwell, & Hux, 2004).”
There are two dialysis types: hemodialysis and peritoneal dialysis. Both are described in the
APIC Text of Infection Control and Epidemiology (Carrico, 2005). Hemodialysis is the most
common. With hemodialysis, most often an arteriovascular fistula is created in the forearm of
the patient using their own blood vessels, to which an artificial kidney machine can be hooked
for each dialysis session. During hemodialysis, blood travels through a tube into a specially
designed machine, where a semi-permeable membrane allows waste molecules and excess water
to filter out of the blood. The cleansed blood then circulates back into the patient through a
15
hemodialysis, exposure to infectious agents is most likely during initiation and termination of
treatment (Carrico, 2005, p.49-13).
Peritoneal dialysis uses the patient’s own abdominal tissues as a semi-permeable
membrane/filter. A catheter is implanted into the patient’s abdomen. Then, a bag containing a
fluid called dialysate is emptied into the catheter by the patient themselves, rather than by a
machine or doctor. The dialysate and waste products are then drained back out through the
abdominal catheter. This process needs to be repeated every 4 to 6 hours, and lasts 40 to 50
minutes in “continuous ambulatory peritoneal dialysis” (CAPD), or is done overnight by a
machine, as in “continuous cycling peritoneal dialysis” (CCPD). With peritoneal dialysis,
placement and removal of the catheter is the riskiest time for pathogen exposure (Carrico, 2005,
p.49-11).
2.12 Dialysis and MRSA
The risk of developing an iMRSA infection among dialysis patients has been documented and is
increasingly well known and understood. According to the CDC’s Guidelines for the Prevention
of Intravascular Catheter-related Infections
Dialysis increases the risk of invasive infection because of the nature of intravenous
treatment, allowing direct access into the bloodstream for any contaminants or microbes.
Dialysis-associated infections tend to be either access site infections or bacteremia. Because
Staphylococcus aureus (and therefore MRSA) colonization is common on the skin and in the
nares of dialysis patients, infections with Staphylococcus aureus and MRSA are also common in
dialysis patients (Carrico, 2005, p.49-11). Those on hemodialysis are considered high-risk
patients in regard to MRSA infection (Carrico, 2005, p.69-9). For example, Bacterial Infections
in Humans states that, “Colonized dialysis patients are at high risk for staphylococcal infection,
particularly bacteremia, arteriovenous fistula infections, and peritonitis. The strain isolated from
the site of infection is typically the same as that carried in the nose (Evans, & Brachman, 1998).” , “The use of catheters for hemodialysis is the most
common factor contributing to bacteremia in dialysis patients (O’Grady, Alexander, Dellinger,
Gerberding, Heard, 2005).” Diabetes is considered an underlying risk factor for infection for
patients undergoing dialysis in the APIC Text of Infection Control and Epidemiology (Carrico,
16
CHAPTER III
METHODS
3.1 Data Source
Secondary data on invasive MRSA cases was obtained from the Georgia Emerging Infections
Program ABCs Invasive MRSA Surveillance system. The Georgia EIP is a collaboration of the
Georgia Division of Public Health and academic partners at Emory University and the VA
Medical Center. iMRSA surveillance is conducted by Emory/VAMC partners in the eight
county Atlanta MSA (Georgia Emerging Infections Program, 2006). ABCs conducts laboratory
population-based iMRSA (MRSA cultures from a normally sterile body site) surveillance with
medical record abstraction (Arnold, 2005; Tuttle, Arnold, Tobin-D’Angelo, 2007). The VA
agreed to allow use of a de-identified use of the dataset for this thesis. Case patients are
residents of the eight county Atlanta metro statistical area (Fulton, Dekalb, Gwinnett, Clayton,
Newton, Douglas, Cobb and Rockdale counties). Cultures were collected from 2005 through
2008. Cases were assigned an individual ID number, and identifying information was removed,
ensuring patient confidentiality. The database primarily consists of data collected through chart
abstraction.
BMI was not included as a variable in the original database, it is not a requested data item
covered on the case report forms (CRFs). A BMI column was created using data on height and
weight reported in the medical records reviewed by surveillance officers. For each case with
both height and weight data available, a BMI score was calculated. An online calculation tool
provided by the Department of Health and Human Services National Institutes of Health’s
National Heart Lung and Blood Institute for the purposes of BMI calculation was used (NIH
NHLBI, 2009). BMI was not calculated for cases with incomplete or missing height or weight
data.
Height and weight data for each case was available in many possible combinations of
17
inches, or in centimeters. Weight was reported as pounds, pounds and ounces, or as kilograms.
For cases with weight reported in kilograms and height reported in inches, kilograms were
converted to pounds for the BMI calculation. For cases with weight in pounds and height in
centimeters, weight was converted to kilograms for the calculation. For cases with inches,
centimeters, kilograms, and pounds and/or ounces filled in (i.e. all fields contained an entry),
centimeter and kilogram measurements were used for the BMI calculation.
3.2 Inclusion/Exclusion Criteria
Original EIP Dataset Inclusion Criteria -- The dataset used for these analyses represents the
cohort of iMRSA in the 8 Atlanta metro counties in Georgia from 2005 through 2008. The
original EIP dataset included each incident case of iMRSA infection per patient, with “incident”
cases of disease defined as iMRSA isolates collected thirty or more days apart for a single case
patient. The total N for the database was 4,832 prior to applying inclusion/exclusion parameters.
Incomplete Height and Weight Data -- Cases were excluded if data were inadequate for BMI
calculation. The majority of excluded cases were dropped due to inadequate and missing height
and weight data. The majority (2078 cases; 43%) of excluded cases were rejected due to this
criteria.
Age -- Cases were excluded if under the age of 18, eliminating neonatal and childhood cases.
This study aims to focus on adults with risk factors for iMRSA, and individuals under the age of
18 are at low risk of developing adult onset Type 2 Diabetes (ADA, 2010a; National Diabetes
Information Clearinghouse, 2007). Cases aged over 85 were also excluded to reduce the
probability of personal identification, incorrect age due to data entry error, and to reduce skew in
measures of central tendency from outliers. Persons over age 85 were also excluded due to
privacy issues; to satisfy IRB requirements, no cases over age 85 were allowed to be included.
Extreme BMI -- Cases were excluded if apparently extreme or absurd data had been entered into
the EIP iMRSA database. These unexpected data may be due to inaccurate entries in the height
and/or weight columns during chart abstraction, errors during data entry into the ABCs database,
misreading of medical charts by abstractors, or some other computer or human error. Extreme
18
survivable (Henry, 2001; WHO, 2004)), or a BMI of above 57 (indicating a weight to height
ratio so extreme as to indicate possible data entry error (NHLBI, 2010)). For example, a 45 year
old male with height and weight data that result in a BMI of 8 is not survivable, and would be
excluded, and this BMI score attributed to data entry error.
Height -- Cases with a height below 120 cm (129.9 cm = 4 feet) were excluded. This eliminated
5 cases only.
Ounces -- Ounces were excluded from the BMI calculation altogether, as only 9 cases had
ounces data, and ounces would have negligible effect on a case’s BMI, since only one pound of
difference could occur. Ounces reported ranged from 3 to 11 among these 9 cases. Therefore 9
cases may have been up to 11 ounces heavier than the weight used to calculate their BMI at the
time of BMI calculation.
3.3 BMI Calculation
BMI was calculated for each case with sufficient height and weight data. Statistical analysis was
carried out in SPSS. The association between variables was determined using binary logistic
regression analysis. A secondary data source was used. A p-value of ≤ 0.05 and a 95%
confidence interval (CI) was used to determine statistical significance. Data from the EIP
iMRSA database was compared to CDC BRFSS data for the state of Georgia. All data are from
the year 2005 through 2008.
BMI calculation formula =
weight[kg]/(height[m]*height[m]) = 703*weight[lb]/(height[in]*height[in])
3.4 Definitions
3.4.1 BMI Categories
According to the National Institutes of Health’s National Heart Lung and Blood Institute, BMI
categories are as follows: underweight = 18.4 or lower; normal weight = 18.5-24.9; overweight =
19
These categories are widely accepted in the literature (NHANES, 2007; NHLBI, 1998), and were
used to define adiposity categories cases in this study. Underweight and normal cases were
combined into the ‘normal’ category.
3.4.2 EIP Definitions
The following definitions were used by surveillance officers working for the Georgia EIP
program abstracting charts for iMRSA and come directly from the data dictionary provided
surveillance for instruction and reference. Definitions are in alphabetical order.
Central vascular catheter (CVC)—Single double, or triple lumen, Shiley (dialysis), Broviac,
Hickman, PICC, Swan Ganz catheter, Pulmonary artery catheter, Port-a-cath, passport, Vas cath,
perm cath. Does not include peripheral IV.
Ethnicity—Ethnicity of patient as noted in chart or reported by physician or ICP. To be checked
even if race already indicated. For example, a patient may be White and also Hispanic or Latino.
If not noted or unsure, indicate as ‘unknown.’ Assumptions not to be made based on name.
Some institutions combine race/ethnicity coding. For example, a person’s race may be indicated
as ‘Hispanic’ or ‘Latino.’ In this case race would be coded as unknown on the CRF, and
ethnicity would be Hispanic or Latino.
Diabetes mellitus—Includes either Type 1 or Type 2 (both ‘insulin-dependent’ and ‘adult-onset.”
Also includes glucose intolerance and new-onset diabetes. Do not include patients noted as
“pre-diabetic.” It is not necessary to look at the results of glucose tolerance test in laboratory results
section of the chart for an indication of diabetes. Common abbreviations: DM, AODM, IDDM,
NIDDM.
Dialysis—if dialysis occurred within one year prior to invasive specimen collection date.
Height—Optional pilot variable (2005). Indicate height in feet (ft) and inches (in) OR in
centimeters (cm).
20
Obesity—The condition of being significantly overweight. It is usually appliecd to a condition
of 30 percent or more over ideal body weight OR to individuals with a body mass index (BMI)
of 30 or more (added 2005).
Previous MRSA infection—if a previous MRSA infection is noted in the chart, OR patient is
already in the database, OR if a non-sterile culture was positive >24 hours prior to initial
invasive culture.
Race—Race of patient as noted in chart or reported by physician or ICP. Multiple boxes can be
checked. If race is unknown, indicate as unknown.
Sterile Site—Indicate ALL sterile sites from which MRSA was isolated on the date of initial
culture. [These include blood, cerebral spinal fluid, pleural fluid, peritoneal fluid, pericardial
fluid, joint/synovial fluid, and bone.] If isolated from an internal body site or other normally
sterile site, please specify the site. Internal body site should be specified as one of the following:
lymph node, brain, heart, liver, spleen, vitreous fluid, kidney, pancreas, or ovary. Specimens
from skin infections such as skin abscesses, boils, or furuncles or specimens from middle ear,
amniotic fluid, placenta, sinus, wound, lung, gallbladder, appendix, cornea, cord blood or throat
are not considered sterile sites for any ABCs organism. Non-sterile culture sites that should not
be investigated include urine, eye, ear, sputum, wound, swab, and drainage.
Pleural fluid: includes ‘chest fluid,’ thoracentesis fluid
Peritoneal fluid: includes abdominal fluid, ascites
Joint: includes synovial fluid; fluid, needle aspirate, or culture of any specific joint
(knee, ankle, elbow hip wrist)
Bone: includes bone marrow
Muscle: includes muscle tissue or biopsy that is sterilely obtained such as tissue obtained
surgically or through a needle aspirate. A surgically obtained specimen would be
included UNLESS from a wound. If a wound such as a decubitus ulcer has exposed the
fascia or the muscle then those sites would no longer be considered sterile. If the culture
21
over the muscle and fascia when the tissue was obtained this would be considered a
sterile site…superficial skin cultures obtained surgically (e.g., during debridement) are
not considered sterile sites.
Internal body site: specimen obtained from surgery or aspirate from one of the following:
lymph node, brain, heart, liver, spleen, vitreous fluid, kidney, pancreas, or ovary.
Surgery—if patient had surgery during the period of one year before the collection date to 48
hours before the collection date. Surgery is defined as at least taking place during a single trip to
the operating room where a surgeon makes at least one incision through skin or mucous
membrane, including laparoscopic approach. Excluded if surgery occurred within 48 hours of
culture collection.
Weight—indicate weight in pounds (lbs) and ounces (oz) OR in kilograms (kg).
3.5 Analysis
22
CHAPTER IV
RESULTS
[image:38.612.218.394.253.521.2]4.1 Demographics
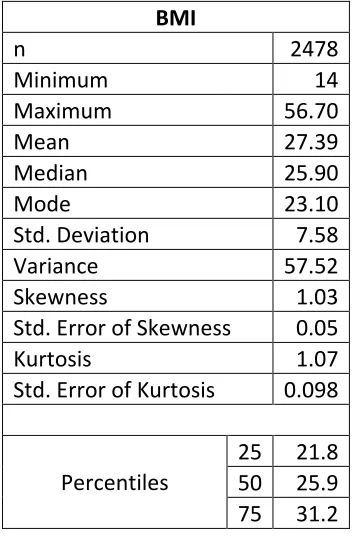
Table 4.1 Frequencies and Descriptive Statistics for BMI Among iMRSA Cases, Georgia Metro Atlanta Area
BMI
n 2478
Minimum 14
Maximum 56.70
Mean 27.39
Median 25.90
Mode 23.10
Std. Deviation 7.58
Variance 57.52
Skewness 1.03
Std. Error of Skewness 0.05
Kurtosis 1.07
Std. Error of Kurtosis 0.098
Percentiles
25 21.8 50 25.9 75 31.2
23
Table 4.2 Frequency and Percent of iMRSA Cases by Demographic Category, Georgia Metro Atlanta Area, 2005-2008
Frequency Percent
Race
White 1,017 41.0
Black 1,357 54.8
Asian 20 0.8
Unknown 84 3.4
Total 2,478 100
Ethnicity
Hispanic 38 1.5
Non-Hispanic 2,395 96.7
Total 2,433 98.2
Unknown 45 1.8
Total 2,478 100
Sex
Male 1,406 56.7
Female 1,072 43.3
Calculated BMI
Categories*
Underweight 181 7.3
Normal 905 36.5
Overweight 642 25.9
Obese 750 30.3
* BMI Categories: underweight = 18.4 or lower; normal weight = 18.5-24.9; overweight = 25-29.9; obesity = 30+
Table 4.2 presents basic demographic information for the invasive MRSA cases. The majority of
cases were black, non-Hispanic, and male. Few Asians were represented in this cohort. 3.4% of
24
Table 4.3 Frequency and Percent of Selected Health Risks Among iMRSA Cases in the
Georgia Metro Atlanta Area, 2005-2008
Frequency Percent
Diabetes
No 1,418 57.2 Yes 1,060 42.8 Chart-Abstracted
Obesity
No 2,195 88.6 Yes 283 11.4
MRSA-Previous Year
No 1,938 78.2 Yes 540 21.8 Hospitalization-Previous
Year
No 1,043 42.1 Yes 1,435 57.9
Surgery-Previous Year
No 1,725 69.6 Yes 753 30.4
Dialysis-Previous Year
No 1,783 72.0 Yes 695 28.0
Percutaneous Device
No 1,771 71.5 Yes 707 28.5
Central Venous Catheter
No 1,966 79.3 Yes 512 20.7
26
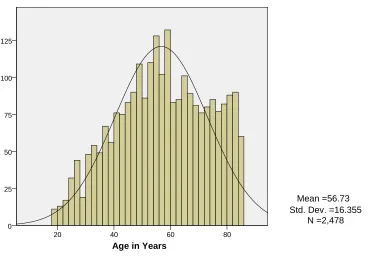
Figure 4.1 Histogram Curve of Age of iMRSA Cases in the Georgia Metro Atlanta Area, 2005-2008 with Normal Curve and Descriptive Statistics
Mean age for the cohort was 56 years, skewed to the left. Individuals in the 65+ age range are represented here at a greater rate than in the general U.S. population, which skews to the right (U.S. Census Data, 2008).
Age in Years
80 60
40 20
125
100
75
50
25
0
Mean =56.73 Std. Dev. =16.355
27
Figure 4.2 Histogram of Raw BMI Scores Among iMRSA Cases in the Georgia Metro Atlanta Area, 2005-2008 with Normal Curve and Descriptive Statistics
28
Figure 4.3 Bar Graph of BMI Categories (Underweight, Normal, Overweight, Obese) Among iMRSA Cases in the Georgia Metro Atlanta Area, 2005-2008 with Normal Curve and Descriptive Statistics
29
Table 4.4 Proportions of iMRSA Cases in the Georgia Metro Atlanta Area, 2005-2008 with Diabetes and/or Dialysis Diagnosis
Proportion Diagnosed with Diabetes Only Proportion Undergone Dialysis* Only Proportion Both Diabetic and Undergoing Dialysis* Adiposity
Normal 28.6% 54.3% 33.1%
Overweight 27.4% 24.9% 30.1%
Obese 44.1% 20.8% 36.6%
Sex
Female 42.2% 34.8% 51.5%
Male 57.8% 65.2% 48.5%
Race
White 47.7% 15.4% 20.6%
Black 48.8% 82.3% 75.9%
Asian 0.9% 0.7% 1.5%
Unknown 2.6% 1.7% 2.0%
Ethnicity
Hispanic 0.9% 0.7% 1.0%
Non-Hispanic 97.7% 98.6% 97.8%
Unknown 1.4% 1.0% 1.2%
Prior MRSA* 16.3% 40.3% 34.3%
Hospitalization* 58.7% 65.5% 64.7%
Surgery* 31.2% 36.2% 33.6%
CVC in place 8.2% 52.9% 50.5%
Total Cases 658 293 402
*Within one year of present illness.
30
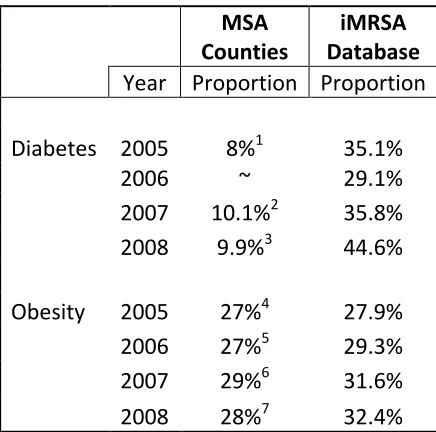
Table 4.5 Comparison of Diabetes and Obesity Proportions in MSA Counties and EIP
iMRSA Data, 2005-2008
MSA Counties
iMRSA Database Year Proportion Proportion
Diabetes 2005 8%1 35.1%
2006 ~ 29.1%
2007 10.1%2 35.8%
2008 9.9%3 44.6%
Obesity 2005 27%4 27.9%
2006 27%5 29.3%
2007 29%6 31.6%
2008 28%7 32.4%
1
BRFSS Healthy People, Progress Towards Healthy People 2010 Objectives, 2001-2005 2
2008 Georgia Program and Data Summary, Diabetes 3
Diabetes in Georgia 2009.
http://health.state.ga.us/pdfs/epi/cdiee/Diabetes%202009%20Report%2011-18.pdf 4
Fact Sheet, Georgia Adult Obesity by County.
http://health.state.ga.us/pdfs/epi/cdiee/Obese%20Adults%20in%20Georgia%20by%20County_f inal3.pdf
5
Obesity Program and Data Summary 2006. http://health.state.ga.us/ 6
Obesity Program and Data Summary 2007. http://health.state.ga.us/ 7
Obesity Program and Data Summary 2009. http://health.state.ga.us/
[image:46.612.196.414.107.323.2]31
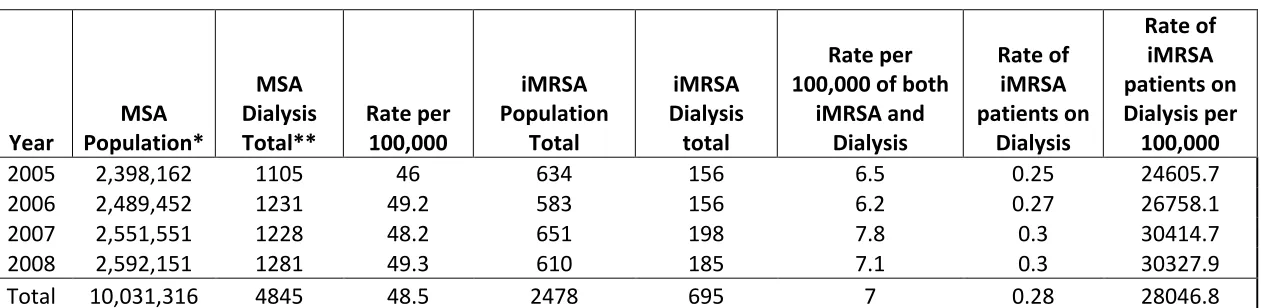
Table 4.6 Dialysis Rates in the both iMRSA Cohort and General Population, Georgia Atlanta Metro Statistical Area, 2005-2008 Year MSA Population* MSA Dialysis Total** Rate per 100,000 iMRSA Population Total iMRSA Dialysis total Rate per 100,000 of both
iMRSA and Dialysis Rate of iMRSA patients on Dialysis Rate of iMRSA patients on Dialysis per 100,000
2005 2,398,162 1105 46 634 156 6.5 0.25 24605.7
2006 2,489,452 1231 49.2 583 156 6.2 0.27 26758.1
2007 2,551,551 1228 48.2 651 198 7.8 0.3 30414.7
2008 2,592,151 1281 49.3 610 185 7.1 0.3 30327.9
Total 10,031,316 4845 48.5 2478 695 7 0.28 28046.8
*Georgia OASIS query data. http://oasis.state.ga.us/
**U.S. Renal Data System, Renal Data Extraction and Reference. http://www.usrds.org/odr/xrender_home.asp
32
[image:48.792.80.582.158.480.2]4.2 Correlations
Table 4.7 Univariate and Multivariate Analysis of the Association Between Selected Independent Variables with Diabetes in
Subjects with Invasive MRSA Infections within the 8 County Metro Area of Georgia, 2005-2008 (α=0.05; 95% C.I.)
Univariate Multivariate
95% C. I. 95% C. I.
OR Lower Upper p-value OR Lower Upper p-value
Adiposity
Normal Reference Reference
Overweight 2.104 1.718 2.576 0.000 2.231 1.805 2.756 0.000 Obese 3.346 2.753 4.066 0.000 3.776 3.067 4.649 0.000
Age 1.027 1.021 1.032 0.000 1.036 1.030 1.042 0.000
Sex
Male Reference Reference
Female 1.194 1.017 1.402 0.030 0.973 0.817 1.159 0.761 Race
White Reference Reference
Black 1.337 1.134 1.577 0.001 1.968 1.631 2.373 0.000 Asian 2.343 0.949 5.782 0.065 3.268 1.241 8.601 0.016 Unknown 0.662 0.408 1.074 0.095 1.082 0.364 3.170 0.888 Ethnicity
Hispanic Reference Reference
Non-Hispanic 2.135 1.032 4.414 0.041 1.157 0.362 3.692 0.888 Unknown 1.265 0.485 3.299 0.631 0.849 0.295 2.439 0.760
33
Table 4.8 Univariate and Multivariate Analysis of the Association Between Selected Independent Variables with Dialysis
within the Year Prior to Invasive MRSA Infection within the 8 County Metro Area of Georgia, 2005-2008 (α=0.05; 95% C.I.)
Univariate Multivariate
95% C. I. 95% C. I.
OR Lower Upper p-value OR Lower Upper p-value
Adiposity
Normal Reference Reference
Overweight 1.178 0.949 1.460 0.137 0.993 0.785 1.255 0.953 Obese 1.050 0.853 1.294 0.643 0.827 0.654 1.046 0.113 Diabetes 2.346 1.962 2.805 0.000 2.462 2.011 3.015 0.000
Age 0.991 0.986 0.996 0.001 0.994 0.988 1.001 0.083
Sex
Male Reference Reference
Female 1.070 0.897 1.277 0.452 1.042 0.859 1.264 0.679 Race
White Reference Reference
Black 4.676 3.772 5.796 0.000 4.359 3.481 5.458 0.000 Asian 4.630 1.857 11.544 0.001 3.920 1.538 9.992 0.004 Unknown 1.272 0.684 2.363 0.447 1.216 0.314 4.703 0.777 Ethnicity
Hispanic Reference Reference
Non-
Hispanic 2.628 1.022 6.759 0.045 1.207 0.291 5.014 0.796 Unknown 1.427 0.425 4.795 0.565 1.606 0.455 5.673 0.462
34
Table 4.4 presents the results of logistic regression analysis to determine if, compared to individuals of normal BMI, overweight and obese cases are more likely to be diagnosed with diabetes. Greater adiposity is associated with increased risk of Type 2 Diabetes in both univariate and multivariate analysis.
Table 4.5 shows invasive MRSA patients are at 2.3 times greater odds of having undergone dialysis within the year prior to their infection if they suffer from diabetes by univariate analysis, and 2.5 times greater odds by multivariate analysis.
4.3 Comparison of BRFSS Georgia BMI data for Georgia to EIP Metro Atlanta Area iMRSA BMI Data.
35
Table 4.9 BRFSS and EIP iMRSA Populations’ BMI Proportion by Category (Normal, Overweight, and Obese) for Georgia 2005-2008
BRFSS %
(reference)
EIP % Difference
2005 Normal 37.0 39.0 -2%
Overweight 36.4 24.9 11.5%
Obese 26.5 27.9 -1.4%
2006 Normal 38.2 37.4 0.8%
Overweight 34.6 24.9 9.7%
Obese 27.1 29.3 -2.2%
2007 Normal 35.0 34.4 0.6%
Overweight 36.3 28.4 7.9%
Obese 28.7 31.6 -2.9%
2008 Normal 35.3 35.4 -0.1%
Overweight 36.9 25.2 11.7%