Gerontology Theses Gerontology Institute
8-11-2015
Unmet Community Needs and Overall
Community Satisfaction of Older Adults in Fulton
County, Georgia
Kayla Brookshire
Follow this and additional works at:https://scholarworks.gsu.edu/gerontology_theses
This Thesis is brought to you for free and open access by the Gerontology Institute at ScholarWorks @ Georgia State University. It has been accepted for inclusion in Gerontology Theses by an authorized administrator of ScholarWorks @ Georgia State University. For more information, please contact
Recommended Citation
Brookshire, Kayla, "Unmet Community Needs and Overall Community Satisfaction of Older Adults in Fulton County, Georgia." Thesis, Georgia State University, 2015.
OLDER ADULTS IN FULTON COUNTY, GEORGIA
by
KAYLA M. BROOKSHIRE
Under the Direction of Jennifer Craft Morgan, Ph.D.
ABSTRACT
Most individuals indicate a strong preference to remain in their homes and communities
as they age. Aging in place can offer both economic and health benefits. As the population
continues to age, it is especially critical that communities facilitate aging in place. This study
aims to inform local policy by addressing two goals. First, determine potential unmet needs of
older adults in Fulton County, Georgia through conducting a descriptive analysis; and second,
determine predicting factors of community satisfaction through estimating a logistic regression
model, based upon an adaptation of Bronfenbrenner’s social-ecological framework. Descriptive
findings showed that local senior centers and meal services are prevalent. However, potential
unmet needs include housekeeping, home repair, transportation, social involvement, and
awareness of a senior resource hotline. The regression model revealed home repair services and
demographics including marital status, education, race, and income were statistically significant
predictors of overall community satisfaction in this study.
INDEX WORDS: “Aging in place”, “Aging in community,” “Community characteristics,”
“Community needs,” “Community satisfaction,” “CPFOA,” “Elderly,” “Fulton County,
OLDER ADULTS IN FULTON COUNTY, GEORGIA
by
KAYLA M. BROOKSHIRE
A Thesis Submitted in Partial Fulfillment of the Requirements for the Degree of
Master of Arts
in the College of Arts and Sciences
Georgia State University
Copyright by Kayla M. Brookshire
OLDER ADULTS IN FULTON COUNTY, GEORGIA
by
KAYLA M. BROOKSHIRE
Committee Chair: Jennifer Craft Morgan
Committee: Chivon A. Mingo
Ann-Margaret Esnard
Electronic Version Approved:
Office of Graduate Studies
College of Arts and Sciences
Georgia State University
DEDICATION
To my brilliant mentors and committee members who have generously given their time, support,
and energies to all my endeavors. To my peers and colleagues within the Gerontology Institute
that I am honored to call friends for ceaselessly providing kind motivation and lending their
assistance and talents along the way.
To my loving husband, Michael, for being a calming balance in the midst of chaos. I would like
to say a special thanks to him for his devoted encouragement and tremendous patience
throughout my work on my thesis project.
To my sister, Amanda, for cheering me on and reminding me that there is humor to be found
even in life’s trials. To my parents, Robert & Sherron, for their love, support, and constant belief
in me. They were my first teachers in life; from them I learned the value of working hard and
following my dreams.
In loving memory of my wonderful grandmother, Pearl, who passed away just this year. You are
an inspiration, and I know that you are forever with me in all my successes.
I would like to extend the deepest thanks to everyone involved in sharing my journey and
ACKNOWLEDGEMENTS
Many individuals have contributed to the realization of this study, and I would like to
sincerely express my gratitude to everyone involved.
First, I would like to thank my committee chair, Dr. Jennifer Craft Morgan, for the
mentorship, wisdom, and constructive advisement that she has extended throughout this process.
Thank you for your willingness to share your methodological expertise. I have learned such an
incredible amount in the short time we have worked together! Thank you for the hours spent
proofreading the many versions of this work, the countless early mornings, late evenings, and
impromptu meetings that you donated to help me strategize, revise, and practice for my defense,
and restoring my faith in myself when I became overwhelmed with it all.
Thank you to my committee members, Dr. Chivon Mingo and Dr. Ann-Margaret Esnard
for their contributions to sharing the background knowledge that I needed to carry forward this
study. Thank you both for your advice and guidance, valuable feedback, and support in making
my thesis possible.
I would also like to thank the Gerontology Institute, both as a place and as a family. The
Institute has provided me with the academic inspiration for my research interests and the
physical resources that I needed to complete my project, but more than that, the Gerontology
Institute provided my second family. For that, I would like to thank everyone at the Institute for
their confidence that they have placed in me to see my study through to the finish.
Thank you also to the Robert Wood Johnson Foundation and the researchers involved in
the Community Partnerships for Older Adults study. Their research contributions provided the
data set for this secondary analysis. Many thanks to all of the scholars, researchers, and
research horizon ahead because of the giants whose shoulders I am graciously allowed to stand
upon.
Most of all, I would like to thank my friends and family. They have endured the many
ups and downs of my struggles and triumphs with grace and compassion. Their presence has
been a light in my life that has carried me through many difficult times. Words cannot express
the gratitude for all you have given.
Thank you to everyone that has been a part of this work. Every contribution has been
TABLE OF CONTENTS
ACKNOWLEDGEMENTS ... v
LIST OF TABLES ... ix
1 INTRODUCTION ... 1
2 LITERATURE REVIEW ... 5
2.1 Meanings and Definitions of “Community” and “Place” ... 5
2.2 Identifying Factors of Age-Friendly Communities ... 7
2.2.1 Policy Elements of Age-Friendly Communities ... 7
2.2.2 Resident-Reported Elements of Age-Friendly Communities ... 9
2.3 Impact of Community on Health Outcomes ... 11
2.4 Role of Community Satisfaction ... 14
2.5 Research Problems ... 14
2.6 Relevant Theory ... 17
3 METHODS ... 19
3.1 CPFOA Data Set ... 19
3.2 Analytic Strategy ... 20
3.2.1 Descriptive Analysis ... 20
3.2.2 Proposed Concept Model ... 22
3.2.3 Logistic Regression Strategy ... 22
4.1 Descriptive Analysis ... 25
4.1.1 Complete Table of Variables ... 25
4.1.2 Overall Community Variables ... 26
4.1.3 Importance of Improving Aspects of the Community Variables ... 28
4.1.4 Prevalence of Programs and Services Variables ... 29
4.1.5 Social Variables ... 30
4.1.6 Demographic Variables ... 31
4.1.7 Additional Individual Level Factors ... 33
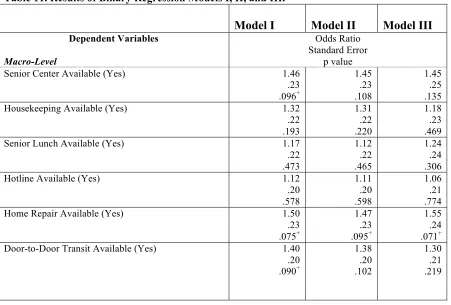
4.2 Binary Logistic Regression Model ... 36
4.2.1 Regression Model Variables ... 36
4.2.2 Regression Model Results ... 38
5 DISCUSSION & CONCLUSIONS ... 43
5.1 Descriptive Findings ... 43
5.2 Programs, Policies, and Initiatives ... 48
5.3 Binary Regression Findings ... 52
5.4 Study Limitations ... 55
5.5 Future Directions of Study ... 57
5.6 Conclusions ... 58
LIST OF TABLES
Table 1. Complete Table of Variables for Descriptive Analysis. ... 25
Table 2. Frequencies of Overall Community Variables. ... 27
Table 3. Chi-Square Analyses Between Demographics & Community Variables. ... 28
Table 4. Frequencies of Improving Aspects of Community Variables. ... 29
Table 5. Frequencies for the Availability of Community Programs and Services. ... 30
Table 6. Frequencies of Social Variables. ... 30
Table 7. Frequencies of Demographic Variables. ... 31
Table 8. Frequencies of Additional Individual Micro-Level Variables. ... 33
Table 9. Association Between Demographics and Additional Micro-Level Variables. ... 35
Table 10. List of Variables Included in the Binary Logistic Regression Model. ... 37
LIST OF FIGURES
Figure 1. Proposed Concept Model for the Impact of Macro-, Meso-, and Micro-Level Factors on
1 INTRODUCTION
The cohort of individuals known as the baby boomer generation is approaching and
entering retirement, contributing to a rapid growth of the older adult segment of the population
(U.S. Census Bureau, 2014). A report published by the Administration on Aging (2012)
estimates that the number of individuals over 65 years of age will double in the United States by
the year 2060, comprising over 90 million persons. As the trend of population aging continues,
the World Health Organization (WHO) is encouraging communities to adapt in ways that will
meet the needs of older adults through the global age-friendly cities movement (WHO, 2007).
The foundation of the age-friendly cities initiative is based on the premise that communities at a
local level are uniquely capable of providing services and support systems to meet resident needs
within the community, with the intent of helping older adults aging in the community cope with
age-related functional decline (WHO, 2007).
According to the National Institute on Aging (NIA), the present cohort of older adults
faces unique challenges and requires different needs; as baby boomers have a longer life
expectancy, lower rates of disability, and more diverse demographics compared to previous
generations of retirees (NIA, 2006). An important aim of the age-friendly cities initiative is to
facilitate the ability of older adults to remain at home in their community for as long as possible,
a preference indicated by 90% of individuals nearing retirement (AARP, 2011; and WHO, 2007).
Assisting older adults with their goal of remaining in their community, or aging in place, offers
the potential for numerous benefits. Not only does aging in place stand to benefit the health of
individual older adults, research has additionally provided evidence that aging in place is a
cost-efficient alternative to institutionalized care when possible (Ball, 2004; Eng et al., 1997; Menec
of the prospective societal benefits offered by instituting policies that promote aging in place, it
is crucial to further explore the specific community-level needs of the baby boomer cohort.
Through elucidating the factors involved in creating age-friendly communities, effective policy
can be better shaped to implement policy that meets the specific needs of the current older adult
population.
The Atlanta metropolitan area provides a strong example of a community that is actively
implementing age-friendly features at a local level. The Atlanta Regional Commission (ARC)
describes their framework for developing metro-Atlanta into an age-friendly region as the
“lifelong community” initiative. This lifelong community initiative focuses on components of
accessibility and livability, including housing, transportation, services, and health (ARC, 2014).
The initiative aims to meet the needs of the growing older adult population in the greater Atlanta
area. According to the 2010 census, there were over 1.3 million baby boomers residing in the
Atlanta metropolitan area alone. The age category between 45 and 64 increased by nearly 50%
between the 2000 and 2010 census, representing the greatest percent increase of any age
category. The 65+ age category, with a 45% increase between 2000 and 2010, represented the
second largest percent increase. Although cities are thought to have relatively young populations,
the Atlanta metropolitan area has an older adult population similar to the national distribution.
Overall, the 45+ age category represents 35% of the Atlanta metropolitan population compared
to 39% nationally (ARC, 2011). More specifically, residents of Fulton County, Georgia reported
a higher than average number of years spent in their current home and higher average years spent
residing in their community than the region averages for these categories (ARC, 2007a). Older
within the same region. Thus it appears that the assumption that older adults relocate to more
rural areas for retirement is not necessarily true for the residents of Fulton County (ARC, 2007a).
Although over 70% of older adults in Fulton County rated the Atlanta region as a good or
excellent place to retire, potential barriers may still significantly challenge the ability to age in
place (ARC, 2007b). A study by MetLife (2013) lists possible barriers that might hinder an older
adult’s ability to continue living in their home. These factors include elements from the built
environment (limited walkability due to dangerous traffic, unavailability of quality sidewalks),
inadequate neighborhood safety, the lack of available community supports and services (nearby
health care facilities, a variety of transportation options), residence distant from grocery stores
and shopping destinations, and lack of social integration and social support from the community
(MetLife, 2013).
Transportation is a particularly concerning issue for older adults in the metro Atlanta
area. A 2011 report by Transportation America estimates that 90% of older adults in Atlanta will
have poor transit access in 2015, compared to 41% of older adults in New York City.
Approximately 88% of older adults in the area use their own vehicle as a primary means of
transportation (ARC, 2007a). However, driving may not always be an option. A CDC (2013)
publication reports that most older adults outlive their ability to drive by 6 to 10 years. When
asked what will be their primary mode of transportation when they can no longer drive, 57% of
older adults in the Atlanta area reported that they plan to be driven around by others while only
13% responded that they would use public transportation (CDC, 2013). As only 7% of all older
adults currently receive transportation assistance by others, the transportation needs for aging
adults may be largely unmet in the future without an increase in public transportation services
A publication by Thomas & Blanchard (2009) calls for policy implementation that would
facilitate aging within the community, blending financial resources and social capital in order to
address barriers experienced by older adults that wish to remain in their homes. A few proposed
examples of community level programs that facilitate aging in place include home modification
and repair to improve accessibility, door-to-door transportation service to provide access to
medical appointments, grocery stores, and senior centers, and improving community walkability
through investing in high quality sidewalks, crosswalks, and street lights. However, in
determining which community features are the priority targets for policy directions in a specific
geographic area, further data is needed. In order to formulate successful policy toward designing
age-friendly cities, it is necessary to investigate the perceptions of older adults regarding their
anticipated perceived barriers to aging in place. As outlined in the WHO age-friendly city
initiative, it is imperative for communities to identify and address the unmet needs of older adults
at a local level in order to improve health outcomes and decrease unnecessary cost of care.
The objectives of this analysis are to investigate two primary avenues of underexplored
research concerning aging in place. The first aim of the study is to assess areas of unmet resident
needs for older adults that reside in Fulton County, Georgia. This aim will be addressed through
conducting a descriptive analysis using the 2002 and 2008 Community Partnerships for Older
Adults (CPFOA) data set. The intended outcome of this objective is to inform policy at a local
level with regard to enhancing Atlanta as an age-friendly city and improving the ability of
residents to age in place. The second major goal of this study is to identify the micro-, meso-,
and macro- level factors related to community satisfaction for older adult residents of Fulton
County, GA. Despite the fact that a number of previous studies (explored further in the Chapter 2
little has been done to identify the specific factors involved in predicting older adult community
satisfaction in diverse geographic areas. In order to address this absence in the current body of
research, a multivariate analysis will be conducted to determine the relative impact of factors on
overall community satisfaction for older adult residents of Fulton County, Georgia. By
identifying the specific factors that relate to high community satisfaction, policy makers can
better determine the relevant policies, programs, and initiatives necessary for the continued
successful design and development of global age-friendly cities. Study findings will be examined
within the context of Bronfenbrenner’s social-ecological theoretical model and the
competency/congruence model of the person-environment fit theory with particular regard to
community supplies-needs fit.
2 LITERATURE REVIEW
2.1 Meanings and Definitions of “Community” and “Place”
With the current emphasis on aging in place, it is important to consider the implications of
what the terms “community” and “place” conceptually mean for researchers, policy makers, and
older adults. Community has broad definitions as a term with meanings ranging from a specific
geographic location with discrete boundaries to a concept inclusive of geographic location,
elements of the built environment including resources and services, as well as social capital and
psychological implications.
A study by Macqueen et al. (2001) set out to determine how members of diverse
populations define community compared to the general definition and the definition of
community from the research community through conducting qualitative interviews with
minority populations. The authors first provide the common definition of community as, “a
perspectives, and engage in joint action in geographical locations or settings (Macqueen et al.,
2001, p. 1929).” Macqueen et al. (2001) further iterate that community may have a second, more
literal definition to public health programs, which typically define a community as the area or
site where an intervention takes place. The results of the study speak to the definition of
community among individuals. The definition of community was reconciled among study
participants into five core elements: locus, sharing, joint action, social ties, and diversity (p.
1930). Although the study by Macqueen et al. (2001) is instrumental in defining community at
the individual level, it is also crucial to consider the meaning of community at the micro-level as
well.
Place attachment, place identity, place dependence, and place meaning are all concepts that
are significant to understanding the importance of studying the role of “community” in lives of
older adults from a research perspective. The University of Washington’s Green Cities: Good
Health website (2015) defines these terms as follows:
• Place attachment, also termed an individual’s sense of place, involves personal
identification to a place or location on an emotional level.
• Place identity can be described as the symbolic or emotional meaning that a person
ascribes to a particular place.
• Place dependence is a type of place attachment that is based on the value of a place in the
context of fulfilling individual needs.
• Lastly, place meaning refers to the associations of significance, purpose, symbolism, or
physical value that a person cognitively applies to a particular place.
A New Zealand study conducted by Wiles et al. (2012) draws upon place attachment
home, neighborhood, and community by older adult participants. Through focus groups and
interviews, the researchers found that study participants wanted choices concerning living
arrangements, as well as access to services and amenities in the community. The authors
described participants as speaking passionately about their communities, speaking separately
about their homes versus their neighborhoods, and describing social connections as valuable
resources within their community. Interestingly, the term “aging in place” was not familiar to a
majority of study participants, and even had negative connotations to a few participants, evoking
feelings of being trapped or stuck in a particular location. However, at the conclusion of the
study, Wiles et al. (2012) described participant discussion on aging in place as having a positive
tone, noting that participants felt a sense of attachment or connection to their community, felt
that there were practical benefits of having security and familiarity, and felt that community was
related to a person’s identity.
2.2 Identifying Factors of Age-Friendly Communities
2.2.1 Policy Elements of Age-Friendly Communities
Policy briefs are useful in considering the elements that comprise and define an
age-friendly community from the perspective of policy makers. A publication by AARP (2011)
presents an overview of state policy related to aging in place. The definition of a livable
community according to this publication touches on the concepts of appropriate, affordable
housing, community features and services that support aging in place, provides adequate
mobility options, and as a whole, facilitates independence, social involvement, and engagement
in the community.
The World Health Organization (WHO, 2007) describes seven key domains to consider
transportation, housing, social participation, respect and social inclusion, civic participation and
employment, communication and information, as well as community support and health services
(p. 9). The guide proposes extensive recommendations for age-friendliness in each category.
The American Planning Association (APA) also recognizes the importance of
considering aging in place needs from a community perspective. An APA (2014) publication
suggests the following guiding policies: 1) involve and engage the perspective of older residents
in the planning process, 2) provide diverse housing options with consideration to affordability,
safety, accessibility, and sustainability, 3) ensure that older adults have access to a variety of
transportation options, 4) utilize zoning to plan communities in a way that is mindful of the
proximity of housing to community amenities and services, incorporate mixed-use developments
to intentionally foster welcoming social environments that engage rather than isolate older
adults, and ensure adequate community safety, walkability, and green space, 5) support the
economic needs of older adults and care partners, 6) design policy and planning responses should
aim to address the needs of vulnerable populations while strengthening community assets; this
includes considering the needs of older adults at-risk of homelessness, considering social and
community involvement, as well as considering community health outcomes that result from
design policies and planning responses (p. 1-15).
In addition to the AARP, the WHO, and the APA, many other national and local
organizations promote community level policy initiatives that support aging in place needs.
These agencies include the Administration on Aging, the Centers for Disease Control (CDC), the
Environmental Protection Agency (EPA), and many others. The common themes in such policy
recommendations center around designing and developing or re-developing communities into
community characteristics, such as the built environment, economic factors, social capital, and
community health.
2.2.2 Resident-Reported Elements of Age-Friendly Communities
Qualitative studies have been particularly effective in capturing the voice of older adults
on the matter of what makes a community an age-friendly place to reside. Feldman & Oberlink
(2003) describe the process of developing the AdvantAge Initiative Model through qualitative
research involving a series of focus groups. Four domains of age-friendly communities were
generated as a result of the study: addresses basic needs, promotes civic and social engagement,
optimizes physical and mental health and well-being, and maximizes independence. The
development of the AdvantAge Initiative Model was one of the first research efforts to broadly
define key elements that are necessary for a community to become age-friendly, however this
model does not account for specific components that fall under the four identified general
categories of age-friendly environments.
A study by Novek & Menec (2014) took the AdvantAge model a step further by
determining the specific community characteristics that enable or deter a community from being
age-friendly. Positive characteristics included accessible physical environments, green spaces to
facilitate physical activity and promote well-being, accessible grocery and retail shopping,
affordable housing, available transportation, presence of community supports and health
services, as well as opportunities for social activities (Novek & Menec, 2014). Participants also
identified negative characteristics that prevent a community from being age-friendly, including
inaccessible physical environments, hazardous sidewalks, lack of benches, unavailability of
shopping amenities, expensive housing, and high rates of crime (Novek & Menec, 2014). The
community as age-friendly are aligned with previous findings by Michael et al. (2006) and Smith
et al. (2013).
Additional qualitative studies by Mahmood et al. (2012) and Day (2008) explore
perceptions of community characteristics further with an added focus on health outcomes.
Mahmood et al. (2012) utilized photovoice documentation of older adult residents to enhance the
understanding of what aspects of a community influence physical health outcomes. Domains of
importance included being safe and feeling secure, getting there, comfort in movement, diversity
of destinations, community based programs, and elements of the social environment such as peer
support and intergenerational activities. These domains were perceived as having an impact on
physical activity, which in turn is known to positively impact mental and physical health
outcomes for older adults (Blumenthal & Gullette, 2002; Nelson et al., 2007; and Penedo &
Dahn, 2005). Day (2008) conducted a similar study to determine older adult perceptions of the
impact of the local environment on their overall health. Five themes were produced, repeating
elements from previous studies. These themes spanned the following topics: creating a
community that is clean and unpolluted, peaceful and without noise disturbance, conducive to
physical activity, supportive of socialization, and aesthetics that are emotionally uplifting.
Although documenting items of importance among older adult residents is essential, there
are few demonstrated tools or measures used to evaluate age-friendliness of an environment. As
a result, most qualitative studies use photovoice, interview, or focus group methodologies. Such
methods have been largely successful, and allow for the generation of theory informed by the
perceptions and views of older adult residents themselves. However, additional research is
needed to quantify the relative importance of each category for older residents of a community.
community factor’s influence on health outcomes, policy initiatives can be better directed to
exert the most impact and best meet the needs of older adult community residents.
2.3 Impact of Community on Health Outcomes
The fact that the relationship between person and place has a tangible impact on a wide
range of mental and physical health outcomes has been well documented in a number of previous
studies. Beard et al. (2009a) and Julien et al. (2012) published findings that compositional
community characteristics can be predictors of depressive symptoms among older adults.
Compositional community characteristics, such as collective community socioeconomic status
(SES), average community educational attainment, community racial composition, and
neighborhood stability had statistically significant associations with depressive symptoms in a
regression model. In both studies, positive compositional community characteristics acted as
protective factors against depressive symptoms, while negative compositional community
characteristics were predictors of adverse mental health outcomes.
The finding that positive community level characteristics may have protective effects is
particularly promising and provides a future direction for policy development through increasing
access to education for individuals of all ages and engaging a community in activities that
promote cultural awareness. However, additional research is needed to develop appropriate
interventions and determine the factors that mitigate negative community compositional factors.
Although such studies are instrumental in highlighting the impact of compositional community
level characteristics on mental health outcomes, these studies are limited in their scope, as they
do not explore the impact of contextual community factors, such as elements of the built and
Further studies have provided insight into the impact of community characteristics on
physical health outcomes. In a second study conducted by Beard et al. (2009b), a connection was
discovered between compositional community characteristics and the prevalence of disability
among older adults. Although this study only examined compositional characteristics such as
community SES, other studies have identified an association between contextual factors of the
built and natural environment and physical health outcomes.
A study by Pruchno and colleagues (2011) examined the impact of both compositional
and contextual community characteristics on the prevalence of disability within the older adult
population. Although the results of the study by Pruchno et al. (2011) support previous findings
that compositional factors (such as SES) have a statistically significant impact on physical health
outcomes, the study also found that contextual community characteristics impact physical health
outcomes. Specifically, the availability of physicians and the presence of supermarkets were
significantly associated with lower levels of disability, while community violence and the
number of storefronts (including bars and convenience stores) were associated with higher levels
of disability. The finding that contextual community factors can exert a positive effect on
physical health outcomes is a unique and important contribution to the current literature.
The Pruchno et al. (2011) finding that storefronts are associated with poorer health
outcomes is aligned with the results of previous studies, such as the Yen and Kaplan (1999) and
Subramanian et al. (2006) studies. The Yen and Kaplan (1999) Alameda County Study stated the
finding that the greater the number of commercial stores in a census tract, the higher the
prevalence of all-cause mortality. Similarly, the Subramanian (2006) study found that lower
service density did not negatively impact self-rated health (SRH) outcomes, while higher service
An additional study conducted by Balfour & Kaplan (2002) also uses the Alameda
County Study sample to identify environmental neighborhood factors that influence the physical
health outcome of functional loss among older adults. The study found that the most common
neighborhood problems reported were traffic, crime, and excessive noise. However, other
neighborhood problems reported included challenges in accessing public transit, insufficient
neighborhood lighting, as well as trash and litter (Balfour & Kaplan, 2002). There was a strong
association between the number of neighborhood problems reported and the compositional
characteristics of the neighborhood. Most individuals that reported no neighborhood problems
lived in a census tract with a low prevalence of poverty, while half of participants that reported
two neighborhood problems or more lived in an area of lower socioeconomic status (Balfour &
Kaplan, 2002). Of participants that developed functional loss during the course of the study, the
instance of functional loss was 50% higher among individuals that resided in a neighborhood
with one reported problem, and 250% higher among residents that lived in neighborhoods where
multiple problems had been reported (Balfour & Kaplan, 2002, p. 510). Although all reported
neighborhood factors were independently associated with a loss in function, the most significant
neighborhood problems included excessive noise, inadequate lighting, heavy traffic, and limited
access to public transportation (Balfour & Kaplan, 2002). The results of the Balfour & Kaplan
(2002) study are considerable, as these findings offer robust support to the argument that
contextual community factors have an impact on physical health outcomes.
The current body of literature has revealed associations between compositional and
contextual community characteristics and specific health outcomes, including depressive
symptoms, disability prevalence, physical activity, overall well-being, self-rated health, and
community on older adult health outcomes have included a wide range of methodologies and
have laid a foundation to continue this line of research, as many research questions still remain.
2.4 Role of Community Satisfaction
There has been an interdisciplinary research interest in community satisfaction across the
fields of psychology, sociology, urban planning, and public health. Conceptually, community
satisfaction has been structured as a subcomponent of quality of life (Ladewig & McCann, 1980)
and individual well-being (Theodori, 2001). Several studies have been instrumental in
identifying the key factors that are involved in influencing community satisfaction as an outcome
measure. These important factors include the existence and quality of community services
(Ladewig & McCann, 1980; and Rodgers, 1982), as well as social capital (Goudy, 1977), and
demographic factors such as race and socioeconomic status (Beard, 2009a; Beard 2009b; Galster
& Hesser; 1981; and Julien, 2012).
However, previous studies have traditionally focused on the general population rather
than older adults, and former studies have tended toward a theoretical rather than applied
approach. A major goal of this study is to specifically determine the environmental (macro-),
social (meso-), and individual (micro-) factors involved in predicting the community satisfaction
of older residents of Fulton County, Georgia. The motivation for these study aims is to inform
local policy, recommending that policy makers take into account the unique considerations and
needs of the diverse Fulton County older adult population rather than relying on a
one-size-fits-all process for planning effective policy goals for the community.
2.5 Research Problems
The previously mentioned studies have been effective in elucidating elements of
demonstrating an association between both compositional and contextual community-level
characteristics and health outcomes including depressive symptoms, disability, self-rated health,
and quality of life of older adults. Yet the topic of community impact on health outcomes still
contains many facets that need additional research.
One major problem with researching community satisfaction and the influence of
community on health outcomes concerns the challenge of defining what constitutes a
community. A standardized meaning of community or neighborhood does not exist, and as a
result, studies differ regarding the boundaries that are used to define such terms. Some studies
rely on census tracts in order to set discrete boundaries of “place.” Other studies consider a city
or even a county as the broader community where an older adult resides. Cummins et al. (2007)
raises concerns about the different definitions of place and space within studies, comparing
“relational” and “conventional” views. While conventional definitions of place use boundaries,
Cummins et al. (2007) discuss how place may also be viewed as “nodes in networks” that are not
contained within strict boundaries. Furthermore, Cummins et al. (2007) advocate for the
consideration of context and composition as interrelated concepts, with each exerting an effect
on the other. Coulton et al. (2001) and Cutchin et al. (2011) additionally demonstrate the
problematic discrepancies that exist due to researchers differentially defining the boundaries of a
neighborhood. The pilot study conducted by Coulton et al. (2001) involved the comparison of
various methods of defining a neighborhood, including census tracts and resident-drawn maps.
Coulton et al. (2001) found that resident-defined neighborhood boundaries substantially differed
geographically and produced dissimilar social indicators than census tract boundaries used to
define neighborhoods. Likewise, Cutchin et al. (2011) denote the lack of theoretical relevance
As a result, it is likely that the way a community is defined and the methods utilized to
study impacts of “place” are important, thus there is a need to focus on how the diverse
definitions of neighborhood or community differentially impact health outcomes. Cutchin et al.
(2011) propose the socio-spatial neighborhood estimation method, combining qualitative GIS
techniques and field observation to define neighborhoods, while Weiss et al. (2007) similarly
recommend a multi-step methodology incorporating both census tract data and field observation
to obtain a meaningful delineation of neighborhood. Future qualitative studies could aim to
discover how residents define neighborhoods and communities, whereas quantitative studies
could aim to evaluate the differences among outcomes according to varying boundaries and
definitions of place. Cutchin (2005) also illustrates the need for additional mixed method study
due to the advantages offered in considering the impact of combined subjective and objective
meanings of place.
Traditional quantitative studies have often relied on secondary survey data and objective
measures of determining the presence or absence of community resources. Numerous
weaknesses exist with this methodology. First, census data is a stronger measure of
compositional rather than contextual data. As a result, previous community research has
exhibited a tendency toward focusing exclusively on either compositional or contextual elements
of community. As both elements have a demonstrated impact on health outcomes, future studies
should aim to incorporate considerations of both composition and context. An additional concern
posed by Schaefer-McDaniel et al. (2010) is that census data is only conducted every ten years,
while cities are dynamic and change frequently. Relying on census data may not provide a
development, as relying on historical census information to predict future community needs
could be a problem.
Other issues that require further research to resolve include the expanded study of
community features, community satisfaction, and health outcomes. Further studies are needed to
determine the impact of items such as public transportation, green space, housing, and services
for older adults. These factors have been previously identified as important features of an
age-friendly community within former qualitative studies, but the impacts of each characteristic have
not been extensively explored through quantitative study (Austin et al., 2009; Reichstadt et al.,
2007; and Schaefer-McDaniel et al., 2010). Future avenues of research could also aim to explore
a wider range of health outcomes, seeking to consider the impact of compositional and
contextual community characteristics on community satisfaction, as well as their impact on
additional measures of mental and physical health.
2.6 Relevant Theory
Two models are particularly well suited to conceptualizing the impact of community on
the individual—the competency/congruence model of person-environment fit and
Bronfenbrenner’s social-ecological model. Person-environment fit theory is based on the idea
that factors of the person and the environment interact and combine to exert an impact on human
behavior (Lewin, 1951). Lawton & Nahemow (1973) contribute further to person-environment
fit, describing the balance between environmental demands (press) and individual abilities
(competence). According to Lawton & Nahemow’s (1973) theory of person-environment fit, if
environmental demands are disproportionate to an individual’s competence, excessive disability
and loss of function may occur as a result of chronic stress. Consequently, even small
individuals with diminished competence (Chappell & Cook, 2010; and Iwarsson, 2005). Carp &
Carp (1984) describe how the environment may exert a positive influence rather than simply
create demands for an individual. In the competency/congruence model of person-environment
fit described by Carp & Carp (1984), environmental resources may be drawn upon in order to
compensate for diminished individual competence, as may occur when an individual experiences
ADL limitations (Cvitkovich & Wister, 2001). The interaction between environmental resources
and personal needs (i.e. supplies-needs fit) thereby influences the outcome of well-being for
older adults. Hence, a goodness of fit between community resources and resident needs results in
higher levels of overall well-being, illustrating the importance of assessing met and unmet
community needs of older adults.
A second model developed from Bronfenbrenner’s social-ecological framework of
human development is useful to the understanding of the interrelationships between factors at an
individual, social, environmental, and policy level. The CDC uses an adapted version of
Bronfenbrenner’s social-ecological model, visualized as a series of concentric circles (CDC,
2014). Individual micro-level factors represent the innermost circle, followed by relationships
and social factors at the meso-level, and lastly community and societal factors comprise the
outermost macro-level circles (CDC, 2014). Previous studies and reports have further illustrated
the versatility of the social-ecological model, employing the framework as a means of
understanding complex person-place relationships and their resulting health and behavioral
outcomes (Menec et al., 2011; Novek & Menec, 2014; Stokols, 1996; and WHO, 2007). Menec
et al. (2011) in particular advocates for the use of a social-ecological framework when evaluating
In the study of age-friendly communities, both the competency/congruence model of
person-environment fit and the social-ecological model are valuable sources of theory to draw
upon. Keating et al. (2013) describe the term “age-friendly” as a measure of the goodness of fit
between older adults and their community. Person-environment fit and particularly
supplies-needs fit offers a theoretical lens with which to assess “age-friendliness”. Furthermore, the
social-ecological model is useful for framing the study of micro-, macro-, and meso-
compositional and contextual factors that may predict community-related outcomes.
3 METHODS
3.1 CPFOA Data Set
The Community Partnerships for Older Adults (CPFOA) 2002 and 2008 data sets provide
a unique opportunity to evaluate community needs and overall community satisfaction of older
adults at a local level. A major strength of examining data from the two random samples
obtained in the 2002 and 2008 survey years is that it allows for the consideration of perspectives
and resident needs reported by the first individuals of the baby boomer cohort reaching
retirement age. The analysis and findings of the historical CPFOA data set may allow policy
makers to better anticipate the resident needs for these same individuals of the baby boomer
cohort that are now in their retirement years, as well as enhance the ability of policy makers to
forecast the community needs for the remainder of the baby boomer cohort approaching
retirement in the next decade.
Data from the original CPFOA study was collected via a telephone survey entitled The
Survey of Older Adults. Surveys were conducted in 2002, before the Robert Wood Johnson
Foundation (RWJF) provided development grants for community partnerships for older adults
to select study sites. Participants of age 50 plus were selected from a random digit-dialing sample
across study sites. An inclusion criterion was implemented in conducting the survey, which was
designed to oversample vulnerable adults, with the goal of representing vulnerable older adults in
50% of the sample population. This inclusion criteria defined vulnerability as being 60 years of
age or older and meeting one of the following conditions: needed assistance bathing, used a
mobility assistance device, rated their health as fair or poor, was afraid to be alone for over two
hours, had a chronic illness, or was older than 75 years of age.
The sites of interest for the purpose of this analysis are the South Fulton County and
“Rest of Fulton County”, Georgia locations. For the purpose of the CPFOA survey, participants
were defined as South Fulton County residents if they lived within a census block group for one
of the following municipalities: East Point, Fairburn, College Park, Hapeville, Union City, or
Palmetto. The sample size for the 2002 Fulton County Sample included 521 randomly-selected
participants and the sample size for the 2008 Fulton County Sample included a separate random
sample of 392 participants. As each survey year produced a random, independent sample, the
data from Fulton County sites were combined from both survey years in an effort to increase the
power of the sample, resulting in a total sample comprised of 913 individuals. However, missing
data was excluded listwise in the logistic regression model, bringing the total sample to 702
individuals with full information for the model.
3.2 Analytic Strategy
3.2.1 Descriptive Analysis
A descriptive analysis was conducted on the CPFOA data set in order to better
County, Georgia. Specific items for descriptive analysis were chosen based on previous
designation as significant to the age-friendliness of a community in former studies in conjunction
with availability of items within the CPFOA data set. An inclusive list of variables considered in
the descriptive analysis for this study is presented in Table 1.
Chi-Square analyses were conducted to determine whether there was an association
between demographics and variables of interest. Frequencies were determined for demographic
variables of interest, including age, marital status, sex, race, income, education and vulnerability
status. Frequencies were also determined for additional individual micro-level variables
measuring community dwelling status, home needs repairs, number of years in the community,
expectation of remaining in the community, importance of remaining in one’s own home,
confidence in one’s ability to remain in one’s own home, and health status. Frequencies were
generated for several variables measuring social capital, including someone to call in an
emergency, weekly religious service attendance, weekly social outings, weekly get-togethers
with family or friends, and self-rated social involvement. Contextual community items were also
selected for descriptive analysis to evaluate the met and unmet needs of older adults in Fulton
County, Georgia. These variables encompassed the importance of improving community safety,
the importance of improving services for frail older adults, the importance of improving public
transit, the availability of senior centers, housekeeping services, senior lunch programs, senior
help hotlines, home repair services, and the availability of door-to-door transit. Lastly,
frequencies were examined for overall community measures, including community satisfaction,
perceived individual-level influence on community, and perceived extent to which policy-makers
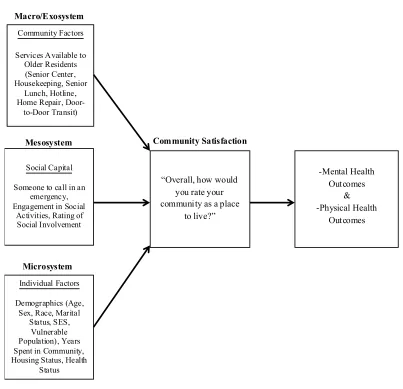
3.2.2 Proposed Concept Model
Figure 1. Proposed Concept Model for the Impact of Macro-, Meso-, and Micro-Level Factors on the Intervening Variable of Community Satisfaction.
3.2.3 Logistic Regression Strategy
3.2.3.1 Proposed Concept Model
The proposed concept model depicted in Figure 1 is based on an adaptation of
Bronfenbrenner’s social-ecological model (CDC, 2014), which postulates that a complex
interaction between macro-level policy factors, meso-level social factors, and micro-level
individual and demographic factors combine to exert an impact an individual’s behaviors and
Figure 1.Proposed Model for the Impact of Macro-, Meso-, and Micro-level Factors on the Intervening Variable of Community Satisfaction.
Microsystem
Community Satisfaction Mesosystem
Macro/Exosystem
Community Factors
Services Available to Older Residents
(Senior Center, Housekeeping, Senior
Lunch, Hotline, Home Repair,
Door-to-Door Transit)
Social Capital
Someone to call in an emergency, Engagement in Social
Activities, Rating of Social Involvement
Individual Factors
Demographics (Age, Sex, Race, Marital
Status, SES, Vulnerable Population), Years Spent in Community, Housing Status, Health
Status
“Overall, how would you rate your community as a place
overall health. The hypothesis of this study is that community factors at the macro-level, social
capital factors at the meso-level, and demographic and individual factors at the micro-level each
impact community satisfaction. Community satisfaction is then proposed to act as an intervening
variable on mental and physical health outcomes, but the predominant focus of this study is to
explore the factors involved in predicting overall community satisfaction.
3.2.3.2 Selection of Variables
SPSS was used to conduct Chi-Square tests between each independent variable and the
dichotomous outcome variable of community satisfaction. The Chi-Square analyses were used to
determine whether a significant association existed between each independent variable and the
dependent outcome variable. Independent variables measuring contextual community resources
found to be statistically significant according to the Chi-Square tests (p<.10) were included in a
logistic regression model.
3.2.3.3 Construction of the Logistic Regression Model
A logistic regression model was conducted to determine the probability of each set of
independent variables predicting good or excellent community satisfaction. First, an ordinal
regression model was conducted. This model was selected based on its appropriateness for the
ordinal dependent variable considered in this study—a four-point outcome measure of
community satisfaction. Next, as a sensitivity test, a binary logistic regression model was
conducted which yielded very similar results. In order to simplify interpretation, the results of the
binary logistic model will be presented in this study.
Three separate models were constructed to examine the impact of each variable set
(macro-, micro-, and meso-level factors) on the outcome of community satisfaction. Model I
meso-level social capital variables, and model III included the macro-, meso-, and micro-level
individual and demographic factors. Final variables included in the model are presented in Table
10. Within each of the three logistic regression models, three primary results of interest were
examined: the odds ratio, the standard error, and the p value. The odds ratio reveals the
probability that a particular outcome will or will not occur. The odds ratio (Expβ) must be
greater than the threshold of 1 (Expβ >1) to indicate that the independent variable examined is
associated with higher odds of the occurrence of a particular outcome. An odds ratio equal to 1
(Expβ =1) indicates that the independent variable does not have an impact on the, while an odds
ratio less than 1 (Expβ <1) reveals that the independent variable is associated with a decreased
likelihood in the occurrence of the outcome variable. The standard error was examined for each
association to determine the reliability of the results based on the sample distribution. A lower
standard error is indicative of the reliability of the results. Lastly, the p value the probability that
the parameter estimate of the relationship between two variables in the model is a product of
chance alone. An alpha value of .10 was chosen to indicate statistical significance in this
analysis, given that this was an exploratory study design.
The dependent variable of community satisfaction was constructed from the following
question: “Overall, how would you rate your community as a place to live?” Response categories
for survey item >a5< were coded as 1=“Excellent”, 2=“Good”, 3=“Fair”, and 4=“Poor”. For the
binary logistic regression, this item was dichotomized as 0 for “Fair or Poor” and 1 for
“Excellent or Good”. This item has been frequently used as a measure of community satisfaction
in a number of previous studies and is considered to be a reliable measure (Echeverria et al.,
2004; Greiner et al., 2004; Patterson & Chapman, 2004; Reisig & Parks, 2000; Sirgy &
This study focuses specifically on the Fulton County, Georgia sites within the CPFOA
Survey of Older Adults. However, it is important to note that the survey administrators treated
“South Fulton County” and “Rest of Fulton County” as two separate site locations. In the
CPFOA codebook, it is indicated that the demographic variables for race and income were only
asked to participants that resided in South Fulton County. Due to the significance of the race and
income variables G20 and G21, they were still included in this study. However, in order to
account for the missing responses, the mean was imputed as follows for these missing variables:
.54 for race (G20) and .52 for annual income (G21). This method was chosen because of the flaw
in the study design around the question of race/ethnicity. If data could be judged to be missing at
random, multiple imputation could be used. In this case, the only strategy available to us is to
conduct sensitivity analysis examining the difference between models with listwise deletion and
mean imputation. Given that mean imputation has the effect of diluting associations, we chose
this conservative estimation approach.
4 RESULTS
4.1 Descriptive Analysis
4.1.1 Complete Table of Variables
Table 1. provides an overview of each variable from the CPFOA data set included in the
descriptive analysis for this study.
Table 1. Complete Table of Variables for Descriptive Analysis. Overall Community
A5 Overall, how would you rate your community as a place to live? A9 How much influence do you think people like yourself can have in
making your community a better place to live?
A11 To what extent do you think local officials take into account the interests and concerns of older people?
Community Concerns and Services
4.1.2 Overall Community Variables
Frequencies for overall community variables are provided in Table 2. Both the number of
occurrences and the valid percent are given for each variable, and when applicable, descriptive
statistics were provided for the categorical and dichotomized version for each item. At 75%, a
majority of the participants rated their community satisfaction as good or excellent. Additionally,
75% of participants indicated that they feel that they have some influence or a lot of influence on
bettering their community.
A1d How important is the following issue? Improving services for frail older adults
A1e How important is the following issue? Improving public transportation C2_anew Senior Center Available
C2_cnew Housekeeping Service Available C2_dnew Senior Lunch Program Available C2_enew Senior Hotline Available
C2_fnew Home Repair Assistance Available C2_inew Door-to-Door Transportation Available
Social Capital
A8new I have someone other than the police who I could call in an emergency. A12a Went to church/temple/religious service in past week
A12b Went to movie/play/concert/restaurant/ sporting event… in past week A12c Got together with family/friends/neighbors in past week
A13 Self-perceived rating of social involvement Demographics
Agecat Age
G11 Marital Status
G17 Sex
G18 Education
G20 Race
G21 Annual Income
Typen Vulnerable/Non-vulnerable
Additional Personal Factors
A2 How many years have you lived in the community?
A4 I expect to be living in the community five years from now. B1 Housing Type [Community Dwelling or Institution]
B5 How important is it that you live in your own home as you grow older? B6 How confident are you that you will be able to continue living in your
current residence for as long as you like?
B8new My current residence needs significant repairs, modifications, or changes to improve my ability to live in it over the next five years.
Table 2. Frequencies of Overall Community Variables.
Community Satisfaction (A5) 4-Point Scale
Frequency Valid %
1. Excellent 166 24
2. Good 360 51
3. Fair 146 21
4. Poor 30 4
Dichotomized
0. Fair/Poor 176 25
1. Good/Excellent 526 75
Community Influence (A9) 4-Point Scale
1. A lot 260 38
2. Some 254 37
3. Not very much 136 20
4. None 37 5
Dichotomized
0. Not very much/None 173 25
1. Some/ A lot 514 75
Extent of Consideration Officials Give Older Adults (A11) 4-Point Scale
1. Quite a lot 108 16
2. Somewhat 308 47
3. Not very much 202 31
4. Not at all 39 6
Dichotomized
0. Not very much/Not at all 241 37
1. Somewhat/Quite a lot 416 63
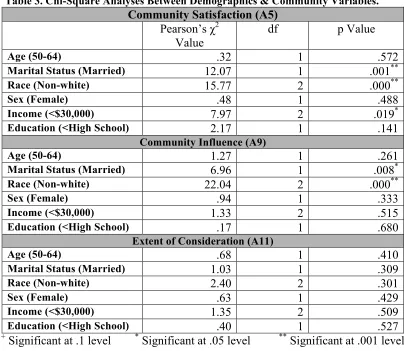
In Table 3., the results of the Chi-Square tests conducted between demographics and
overall community variables are provided in terms of Pearson’s Chi-Square value, degrees of
freedom (df), and the p value for each item. Findings that were significant at the .10 alpha level
or greater were indicated. Significant findings included an association between race and
community satisfaction, marital status and community satisfaction, and a statistically significant
associations found between the variables of race and community influence, as well as a marital
[image:40.612.103.510.133.484.2]status and community influence.
Table 3. Chi-Square Analyses Between Demographics & Community Variables.
Community Satisfaction (A5)
Pearson’s χ2
Value
df p Value
Age (50-64) .32 1 .572
Marital Status (Married) 12.07 1 .001**
Race (Non-white) 15.77 2 .000**
Sex (Female) .48 1 .488
Income (<$30,000) 7.97 2 .019*
Education (<High School) 2.17 1 .141
Community Influence (A9)
Age (50-64) 1.27 1 .261
Marital Status (Married) 6.96 1 .008*
Race (Non-white) 22.04 2 .000**
Sex (Female) .94 1 .333
Income (<$30,000) 1.33 2 .515
Education (<High School) .17 1 .680
Extent of Consideration (A11)
Age (50-64) .68 1 .410
Marital Status (Married) 1.03 1 .309
Race (Non-white) 2.40 2 .301
Sex (Female) .63 1 .429
Income (<$30,000) 1.35 2 .509
Education (<High School) .40 1 .527
+ Significant at .1 level * Significant at .05 level ** Significant at .001 level
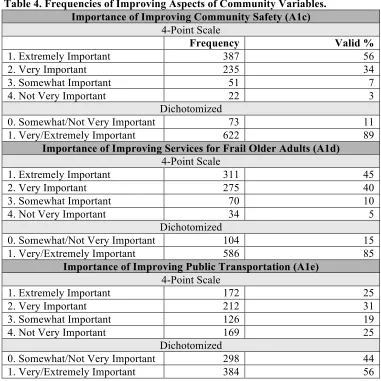
4.1.3 Importance of Improving Aspects of the Community Variables
Table 4. displays the frequencies and valid percentages for items measuring the
importance of improving a particular aspect of the community. The descriptive characteristics for
both the categorical and dichotomized form of each variable is provided. A majority of survey
participants responded affirmatively for the importance of improving community safety (89%)
and services for frail older adults (85%). However, an interesting finding is that only 56% of
Table 4. Frequencies of Improving Aspects of Community Variables. Importance of Improving Community Safety (A1c)
4-Point Scale
Frequency Valid %
1. Extremely Important 387 56
2. Very Important 235 34
3. Somewhat Important 51 7
4. Not Very Important 22 3
Dichotomized
0. Somewhat/Not Very Important 73 11
1. Very/Extremely Important 622 89
Importance of Improving Services for Frail Older Adults (A1d) 4-Point Scale
1. Extremely Important 311 45
2. Very Important 275 40
3. Somewhat Important 70 10
4. Not Very Important 34 5
Dichotomized
0. Somewhat/Not Very Important 104 15
1. Very/Extremely Important 586 85
Importance of Improving Public Transportation (A1e) 4-Point Scale
1. Extremely Important 172 25
2. Very Important 212 31
3. Somewhat Important 126 19
4. Not Very Important 169 25
Dichotomized
0. Somewhat/Not Very Important 298 44
1. Very/Extremely Important 384 56
4.1.4 Prevalence of Programs and Services Variables
[image:41.612.115.496.75.456.2]The frequencies and valid percentages for program and service availability are reported in
Table 5. The programs and services assessed for availability in the community include a senior
center, housekeeping service, a senior lunch program, a senior help hotline, home repair services,
and door-to-door transportation. Most participants responded that a senior center and senior
lunch programs or services were available in their community, while only half recognized the
existence of public transit in their community, and fewer than half of participants reported
available housekeeping services, a senior hotline, or a service that provides assistance with home
Table 5. Frequencies for the Availability of Community Programs and Services. Senior Center Available (C2a)
Frequency Valid %
0. No/Don’t Know 124 18
1. Yes 578 82
Housekeeping Available (C2c)
0. No/Don’t Know 467 67
1. Yes 235 33
Senior Lunch Available (C2d)
0. No/Don’t Know 169 24
1. Yes 533 76
Senior Hotline Available (C2e)
0. No/Don’t Know 417 59
1. Yes 285 41
Home Repair Available (C2f)
0. No/Don’t Know 492 70
1. Yes 210 30
Door-to-Door Transit Available (C2i)
0. No/Don’t Know 336 48
1. Yes 366 52
4.1.5 Social Variables
The descriptive findings including frequencies and valid percentages for survey variables
related to social capital are included in Table 6. A substantial number (82%) of participants felt
that they had someone other than the police or emergency services to call in the event of an
emergency. A majority of participants (77%) also reported that they had participated in a
get-together with family or friends in the past week. Most participants (60%) had attended a religious
service in the past week. Slightly above half of the participants participated in a social outing in
the past week (54%). At 56%, just above half of the participants responded that they engage in
about enough or too many social activities, leaving a sizable number of participants (44%),
which indicated that they would like to be doing more in terms of their social involvement.
Table 6. Frequencies of Social Variables.
Someone to Call in an Emergency (A8)
Frequency Valid %
0. No 127 18
Attends Religious Service Weekly (A12a)
Frequency Valid %
0. No 279 40
1. Yes 423 60
Participates in Social Outing Weekly (A12b)
0. No 321 46
1. Yes 381 54
Has Get-Together with Family/Friends on a Weekly Basis (A12c)
0. No 162 23
1. Yes 540 77
Rated Social Involvement (A13) 3-Point Scale
1. Too Much 26 4
2. About Enough 366 52
3. Would Like to be Doing More 310 44
Dichotomized
0. Not Enough 310 44
1. Too much/About enough 392 56
4.1.6 Demographic Variables
The following table (Table 7.) reports frequencies for the demographic variables of age,
marital status, educational attainment, sex, race, annual income, and vulnerability status. For
variables where categorical and dichotomized versions exist, frequencies and valid percentages
are displayed for both item forms. Approximately half of the participants (51%) were between
the ages of 50 and 64, while approximately the other half (49%) were over the age of 65.
Approximately 43% of the sample identified as Non-white for race. Over one third (38%) of the
participants reported an annual income below $30,000. At 47%, nearly half of the participants in
the study were categorized as “vulnerable.”
Table 7. Frequencies of Demographic Variables.
Age (Agecat) Categorical
Frequency Valid %
1. 50 to 64 358 51
2. 65 to 74 174 25
3. 75 to 84 139 20