Chemistry Theses Department of Chemistry
5-9-2015
Discovery of Potent Tyrosyl-DNA
Phosphodiesterase 1 Inhibitors Using in silico
Virtual Screening & Network Analysis for
Evolution of Allosteric Communication in
3-ketosteroid Receptors
Shih-Wei Chuo
Georgia State University, [email protected]
Follow this and additional works at:https://scholarworks.gsu.edu/chemistry_theses
This Thesis is brought to you for free and open access by the Department of Chemistry at ScholarWorks @ Georgia State University. It has been accepted for inclusion in Chemistry Theses by an authorized administrator of ScholarWorks @ Georgia State University. For more information, please [email protected].
Recommended Citation
OF ALLOSTERIC COMMUNICATION IN 3-KETOSTEROID RECEPTORS
by
SHIH-WEI CHUO
Under the Direction of Ivaylo Ivanov, PhD
ABSTRACT
Tyrosyl-DNA phosphodiesterase I (TDP1) plays an important role in repair of topoisomerase I-DNA complexes in vivo, and its inhibitors have the potential to enhance the efficacy of the Top1-targeting drugs in anticancer therapy. Nevertheless a large number of TDP1
inhibitors have been reported, none of them has inhibition activity in vivo. We present a virtual
screening protocol to explore potent TDP1-selective inhibitors.
3-ketosteroid receptors belong to nuclear receptor family, and their DNA binding domains interact with glucocorticoid response elements (GREs) to regulate gene transcription. With evolution, all of them can bind to activating response element ((+)GRE), but only some exhibit the ability to bind to negative glucocorticoid response element (nGRE). It was found that evolutionary mutations are important to change their binding functions. We have presented dynamic network models to elucidate allosteric communication for selected evolutionary homologues, discussing the correlation between binding characteristics and epistatic mutations from network theory.
OF ALLOSTERIC COMMUNICATION IN 3-KETOSTEROID RECEPTORS
by
SHIH-WEI CHUO
A Thesis Submitted in Partial Fulfillment of the Requirements for the Degree of
Master of Science
in the College of Arts and Sciences
Georgia State University
Copyright by
Shih-Wei Chuo
OF ALLOSTERIC COMMUNICATION IN 3-KETOSTEROID RECEPTORS
by
Shih-Wei Chuo
Committee Chair: Ivaylo Ivanov
Committee: Giovanni Gadda
Donald Hamelberg
Ivaylo Ivanov
Electronic Version Approved:
Office of Graduate Studies
College of Arts and Sciences
Georgia State University
ACKNOWLEDGEMENTS
First, I would like to gratefully and sincerely thank my advisor Dr. Ivaylo Ivanov for his
excellent guidance and supporting me during these two years. He patiently provided advice and
inspiration for me to execute my research and complete my master degree. I also greatly thank
Dr. Hamelberg and Dr. Gadda for serving in my defense committee.
Special thanks to my colleges, Dr. Chunli Yan, Bradley Kossmann, and Kathleen Carter;
they taught me lots of technical difficulties and provided many insightful suggestion.
Finally, I really thank my parents, Chih-Ming Cho and Ruo-Lin Lee, and my sister,
Shih-Chin Chuo. Their love is always my driving force to overcome any difficulty during my
ACKNOWLEDGEMENTS ... IV
LIST OF TABLES ... VIII
LIST OF FIGURES ... IX
1 CHAPTER 1: DISCOVERY OF POTENT TYROSYL-DNA
PHOSPHODIESTERASE 1 INHIBITORS USING IN SILICO VIRTUAL
SCREENING ... 1
1.1 INTRODUCTION ... 1
1.1.1 Topoisomerase 1 and 2 (Top1 and Top2) ... 1
1.1.2 Topoisomerase as drug target ... 2
1.1.3 Tyrosyl-DNA phosphodiesterase 1 (TDP1) ... 2
1.1.4 Tyrosyl-DNA phosphodiesterase 2 (TDP2) ... 3
1.1.5 Specific goal ... 4
1.2 METHOD ... 5
1.2.1 Virtual Screening ... 5
1.2.2 Model Construction ... 5
1.2.3 Molecular dynamic simulations ... 6
1.2.3.1 Amber Force Field ... 6
1.2.3.3 Non-bonded interactions ... 11
1.2.3.4 Cutoffs ... 11
1.2.3.5 Long-range electrostatic interaction ... 12
1.2.3.6 Temperature control- Langevin thermostat ... 13
1.2.3.7 Pressure control ... 15
1.2.4 Docking ... 16
1.2.5 Molecular mechanic-Poisson Boltzmann surface area (MM-PBSA) calculation . 17 1.2.6 Tanimoto similarity with ROCS and EON ... 19
1.2.7 Trajectory Analysis ... 20
1.2.7.1 RMSD ... 20
1.2.7.2 RMSF ... 21
1.3 EXPERIMENTAL PROCEDURE ... 21
1.4 RESULTS AND DISCUSSION ... 23
1.4.1 Docking of NSC339616 to TDP1 ... 23
1.4.2 Binding free energy calculation ... 24
1.4.3 Similarity search with 3D shape and electrostatic comparison ... 26
1.5 CONCLUSIONS ... 26
REFERENCE ... 43
2.1 INTRODUCTION ... 51
2.1.1 Structure and Function of 3-ketosteroid receptors ... 51
2.1.2 Glucocorticoid Response Elements ... 52
2.1.3 Specific goal ... 52
2.2 METHOD ... 53
2.2.1 Dynamic network analysis ... 53
2.2.2 Selected analysis methodologies for dynamical networks ... 54
2.3 EXPERIMENTAL PROCEDURE ... 55
2.4 RESULTS AND DISCUSSION ... 57
2.4.1 Sequence alignment and evolution tree ... 57
2.4.2 Correlation network analysis ... 58
2.5 CONCLUSIONS ... 60
REFERENCE ... 71
LIST OF TABLES
Table 1.1 Comparison of MM-PBSA results for ligand bound in DNA binding site and active
binding site. ... 25
LIST OF FIGURES
Figure 1.1 The repair of the topoisomerase I-mediated DNA damage by TDP1. ... 27
Figure 1.2 Crystal structure of human TDP1 (PDB ID: 1RG1). ... 28
Figure 1.3 Catalytic mechanism of TDP1. ... 29
Figure 1.4 The repair of the topoisomerase II-mediated DNA damage by TDP2. ... 30
Figure 1.5 The proposed catalytic mechanism for TDP2 to cleave phosphodiester bond. ... 30
Figure 1.6 Crystal structure of human TDP2 (PDB ID: 4GZ1). ... 31
Figure 1.7 Virtual Screening Protocol. ... 32
Figure 1.8 Intra- and inter- molecular interactions. ... 32
Figure 1.9 Basic ideal of Tanimoto similarity. ... 33
Figure 1.10 TDP1 and TDP2 gel assay. ... 34
Figure 1.11 Four representative docking poses of NSC339616 in TDP1 model. ... 35
Figure 1.12 Changes of RMSD of two binding pose as a function of time from MD simulation. ... 36
Figure 1.13 RMSD profiles in two binding poses ... 36
Figure 1.14 Comparison of TDP1 structures for (a) binding pose 1, (b) binding pose 2. ... 37
Figure 1.15 Binding properties of two binding poses in TDP1 model. ... 38
Figure 1.16 Ligand-residue interactions from MM-PBSA energy decomposition for binding poses 1 (a) and 2 (b) in TDP1 model. ... 39
Figure 1.17 Virtual screening with ROCS. ... 40
Figure 1.19 Top six potent TDP1 inhibitors. ... 42
Figure 2.1 Secondary structure of the 3KS DBD. ... 62
Figure 2.2 General mechanisms of receptor action. ... 63
Figure 2.3 Fluorescence anisotropy of selected 3KS homologues... 63
Figure 2.4 (+)GRE associated luciferase activity in the presence of selected 3KS homologues. ... 64
Figure 2.5 nGRE associated luciferase activity in the presence of selected 3KS homologues. 64 Figure 2.6 3KS phylogenetic tree. ... 65
Figure 2.7 Multiple sequence alignment of 3-ketosteroid family of DBDs within GR and MR lineage. ... 65
Figure 2.8 Network structures and graphs in (+)GRE-bound 3KS homologues GR linege. ... 66
Figure 2.9 Network structures and graphs in (+)GRE-bound 3KS homologues MR lineage. . 67
Figure 2.10 I423V causes a community bifurcation. ... 68
Figure 2.11 Network structures and graphs in nGRE-bound AncSR2 and GR. ... 69
1 CHAPTER 1: DISCOVERY OF POTENT TYROSYL-DNA
PHOSPHODIESTERASE 1 INHIBITORS USING IN SILICO VIRTUAL
SCREENING
1.1 INTRODUCTION
1.1.1 Topoisomerase 1 and 2 (Top1 and Top2)
In eukaryotes, dormant DNA is wound around histones in highly compact bodies known as
nucleosomes, which must be unwound for replication and transcription. Unwinding of
nucleosomal DNA by the cellular replication and transcription machinery can cause supercoiling.
[1] In the confines of the nucleus, this supercoiling becomes a topological phenomenon and can
only be relieved by topoisomerase activity. There are two general classes of topoisomerase: type
I topoisomerases, of which human topoisomerase 1 (Topo1) is a member, cut a single strand of
DNA, allowing superhelical tension to drive rotation about the uncleaved strand before finally
religating the cut strand; and type II topoisomerases, of which human topoisomerase II (Topo2)
is a member, cut both strands of a DNA duplex, while binding the DNA at another position,
allowing the uncut DNA to pass through the cut site before reannealing the cut DNA. Both types
backbone phosphorus, resulting in a covalent tyrosine phosphodiester linkage between the
topoisomerase and the cleaved DNA, with this linkage occurring on the 3’ and 5’ sides of the
phosphate in type I and type II topoisomerases, respectively. [2]
1.1.2 Topoisomerase as drug target
Topoisomerase have become a popular target in anticancer therapy. Top1 and Top2 cleavage
complexes (Top1cc and Top2cc) can be trapped, resulting in persistent single and double strand
breaks, effectively blocking replication in rapidly dividing cancer cells and thereby inhibiting
tumor growth and metastasis. [3] The efficacy of this class of anticancer drugs, known as
topoisomerase poisons, is compromised by the activity of tyrosyl-DNA phosphodiesterases,
enzymes capable of actively cleaving the covalent linkage between topoisomerases and their
DNA substrates. [4]
1.1.3 Tyrosyl-DNA phosphodiesterase 1 (TDP1)
TDP1, first identified by Nash and coworkers in Saccharomyces cerevisiae, catalyzes the
hydrolysis of the tyrosyl-phosphodiester bond in TopoI-DNA complexes (figure 1.1). [5] Human
sandwich (figure 1.2(a)). The N-terminus catalytic domain is from Gly149 to Thr350, and the
C-terminus catalytic domain goes from Asn351 to Ser608. Each domain consists of one
conserved HKN motif (His263, Lys265, Asn283, His493, Lys495, and N516 in the human TDP1;
that belongs to the phospholipase D (PLD) superfamily to catalyze the repair of 3'-DNA adducts,
and the detail TDP1’s reaction mechanism are shown in figure 1.3. [6] Two conserved HKN
motifs are located in the center of the TDP1, forming a catalytic region inside an asymmetric
substrate-binding channel (figure 1.2(b)). One side of the asymmetric channel is narrow and
lined with positively charged distribution, and the other side is bowl-shaped basin with
negatively charged distribution. According to the size and charged distribution, it implies the
narrow side is a DNA binding region and the opened side is a polypeptide binding region. [7]
1.1.4 Tyrosyl-DNA phosphodiesterase 2 (TDP2)
By contrast to TDP1, TDP2, which is critical to repair topoisomerase II-induced DNA
damage, is specific to cleave phosphotyrosyl bond at the 5’ DNA terminal (figure 1.4). [8, 9]
Although the function of TDP2 is similar to TDP1 hydrolyzing the phosphotyrosyl bond and
removing topoisomerase-DNA adduct, their catalytic mechanisms are different. TDP2 does not
[10] The 5’-DNA phosphate is stabilized by the magnesium, H236, S239, and H359, and a water
molecule is deprotonated by D272 and acts as nucleophile to attack the 5’-DNA phosphate. So
far, the crystal structure of human TDP2 has not been reported, so the TDP2 crystal structure
presented here is from Mus musculus (figure 1.6). [10]
1.1.5 Specific goal
Tyrosyl-DNA phosphodiesterases 1 and 2 (TDP1 and TDP2) are DNA repair enzymes that
repair trapped topoisomerase-DNA complexes by removing a blocking group at a 3’- and
5’-DNA ends. [7, 11] It was found that TDP1 inhibitors can increase the lifetime of Top1
cleavage complexes and therefore, the cytotoxicity of camptothecin in vivo, enhancing the
activity of Top1 inhibitors in cancer cells. A compound with in vivo TDP1 inhibition activity has
yet to be identified. Therefore, we have identified a number of potential drug candidates that
1.2 METHOD
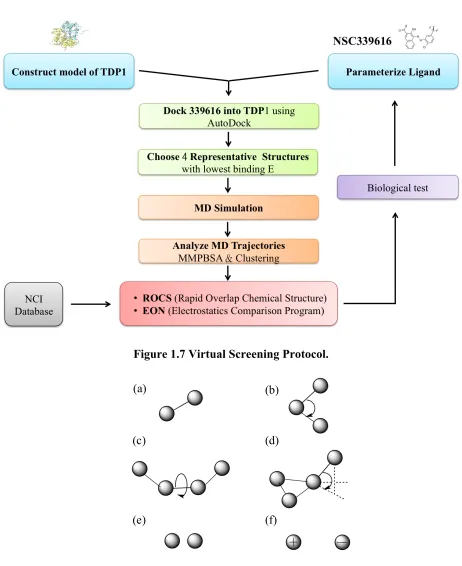
1.2.1 Virtual Screening
Virtual screening is a computational technique applied on drug discovery to search libraries
of known molecules in order to rapidly identify those molecules that can bind to a drug target.
[12] The virtual screening protocol can be seen in figure 1.7.
1.2.2 Model Construction
Model construction is useful to give us an idea about the 3-dimenstional structure and where
the residues locate in the protein structure, and a complete protein structure can assistant us to
study in dynamics, protein-ligand interaction, and drug discovery. Usually, some residues are not
rigid in the crystal resulting in missing residues reported in the PDB files, and these residues may
be critical to the biological function. Therefore, if there are empirical 3D protein structures that
are similar to our target protein (template) with 50% or better sequence similarity, we can
arrange the backbone of the similar sequence, place the missing residues or insert additional
1.2.3 Molecular dynamic simulations
The first application of Molecular Dynamics (MD) simulation was reported in the late
1970s, and MD simulation has been vastly developed and become an extremely powerful tool
applying on biochemistry and biology due to the advanced computation technologies and
algorithmic improvements. [15] Many successful applications of MD simulations are shown to
cover a broad spectrum of problems, such as allosteric properties, polypeptide folding,
biomolecular association, and ion transport. [16-19] MD simulation reveals atomic-level detailed
information to provide great assistance in interpreting experiment data that are not accessible to
direct experimental measurement. Therefore, it is considered a significant method to study
microstructure of materials.
1.2.3.1 Amber Force Field
In MD simulation, potential energy (V) is a function of the molecular parameters (R) to
describe intra- and inter- molecular forces between atoms in the system. In order to easily be
calculated on a computer, it includes many approximations to construct an additive formula
called a force field, and this formula consist of several terms to provide contribution of bonded
(1.1)
The bonded interactions corresponding to bond length, angle, and dihedral parameters
describe the ability of bonds to stretch, bend, and torsion, and the non-bonded interactions have
two components, Columbic potential for electrostatic interactions and Lennard-Jones (LJ)
potential for van der Waals interactions. In force field, parameters can be derived by fitting either
experimental measurements, such as vibrational frequencies of molecules, potential energy
surface, and dielectric permittivity etc., or quantum mechanical calculations. In this thesis,
AMBER force field [20] used to carry out all simulations is as follows:
(1.2)
The above potential energy function includes the first four terms for intra-molecular
interactions and the last two terms for inter-molecular interactions. Parameters, 𝐾!, 𝐾!, 𝐾!, and
𝐾!, account for the bond, angle, dihedral, and improper force constant. 𝑟−𝑟!" represents the
between three consecutive atoms. In the third term, 𝑛 is the multiplicity, 𝜙 is the dihedral
angle, and 𝛿 is the phase shift. 𝜑−𝜑!" is the changes in out-of-plane angle from its
equilibrium state (figure 1.8).
For two inter-molecular interactions, the first is using Lennard-Jones (LJ) potential to
account for the attractive force, !!
!"
!
, and repulsive force, !!
!"
!"
, between two particles,
where 𝑟!" is the distance between these two particles, 𝜀!" is the Lennard-Jones well depth, and
𝑅!"!"# is the distance between two particles at the minimum potential fitted from experiment data
or quantum calculation. The second one is using Coulomb potential to describe electrostatic
interaction, where 𝑟!" is the distance between atom 𝑖 and 𝑗, 𝑞! and 𝑞! are the point charges of
them respectively, and 𝜀! is the effective dialectic constant.
1.2.3.2 Integration of Newton’s equation
After the determination of initial coordinates and velocities for a system of all atoms, a set of
classical Newton’s equation of motion (eq. 1.3) was numerically integrated to obtain a trajectory
over a period of time.
In the eq. 1.3, 𝐹 is the force acting on an atom, 𝑚 is the mass of the atom, 𝑎 is the
acceleration, and R is the position of the atom. The acceleration can be further expressed as the
second derivative of the position of the atom with related time, 𝑡. The force also can be written
as the gradient of the potential energy:
(1.4)
Therefore, the combination of eq. 1.3 and eq. 1.4 is obtained to describe the correlation
between the derivative of the potential energy and the changes in position as a function of time:
(1.5)
Once the forces acting on atoms are calculated, the accelerations of all atoms can be
obtained. Subsequently, the new positions and velocities of the atoms can be derived within a
short period of time (timestep). [21] According to the new positions, the forces on the atoms will
be recalculated from the potential energy function, and these data, positions, velocities, and force,
are calculated with iterative steps and saved for a certain time interval to obtain a trajectory of
the system. In order to accurately simulate the fastest motion, the timestep is typically on the
order of femtosecond (fs), because vibrational frequencies of the fastest motion involving heavy
timesteps are computationally expensive, one of the methods to improve and allow longer
timesteps (2fs) [22] in MD simulation is SHAKE algorithm. SHAKE algorithm is applied to
remove the highest vibrational frequency by constraining all bonds associated with hydrogen in
the system, and it is based on Verlet integration algorithm [23] derived from two Taylor
expansions shown as follows:
(1.6)
(1.7)
In these expansions, 𝑟! is the position at the nst timestep, 𝑟!!! is the position at its
previous timestep, and 𝑟!!! is the position at its next timestep. O ∆𝑡! is the function of ∆𝑡
with n order or higher order. These two expansions can be added to obtain equation 1.8.
(1.8)
According to the eq. 1.8, the new atomic position at n+1st timestep is determined from the
current position and force exerted on the atom at nst timestep, and its prior position at n-1st
1.2.3.3 Non-bonded interactions
In most MD simulations, the systems contain solvent molecules with thousands of atoms,
and the computation of non-bonded interactions for these large molecular systems is
prohibitively slow due to the number of pair interactions grows on the order of !!!!!. To
reduce the computational costs for performing the non-bonded interactions, there are several
methods have been developed. [24]
1.2.3.4 Cutoffs
With the increase of distance between two particles, van der Waals interactions represented
by the Lennard-Jones potential decay rapidly. When σ is defined as a finite distance between two
interacting atoms at which the inter-atomic potential is zero, the van der Waals interaction at a
distance of 2.5 σis only 1% of the interaction at σ. [25] Therefore, a straight cutoff truncation is
frequently applied on Lennard-Jones potential. In MD simulations, the Lennard-Jones interaction
is neglected when the distances of pairs of all atoms are greater than a certain distance referred to
the cutoff distance.
In order to avoid the abrupt truncation and obtain a smooth decay at the cutoff distance,
potential is slightly shift in the entire range of distance, so the potential value at the cutoff
distance is zero to maintain the continuity. For the switching function, a modified potential 𝑆(𝑟)
is used to bring the potential gradually approaching to zero within a interval, and usually the
interval is 1-2 Å.[26]
1.2.3.5 Long-range electrostatic interaction
The cutoff methods also are applied on electrostatic interactions. However, it was found that
the long-range electrostatic interactions are important in the biological systems because of its
slowly decay (~1/R), so the truncation of long-range electrostatic interactions causes large
computational errors and inaccuracy that are not acceptable to describe the protein and nucleic
acid dynamics. [27] Therefore, treatments to correct long-range electrostatic interactions have
been introduced, and Ewald summation is a most popular method to calculate electrostatic
interactions in MD simulations.
The total energy in the Ewald summation method [28] includes the direct space energy
(Edir), the reciprocal space energy (Erec), and the self energy (Ecorr). These three energies are show
(1.9)
(1.10)
(1.11)
Here, 𝛽 represents the Ewald parameters, 𝑉 is the volume of the unit cell, 𝑚 is lattice
vector (m1, m2, m3) in reciprocal space, and 𝑆 𝑚 is the lattice structure factor.
(1.12)
The scale of Ewald summation is O(N2) in the system with N atoms, so it is computationally
expensive. The Particle Mesh Ewald (PME) method reduces the Ewald summation to O(Nlog(N))
[29]. In PME method, a three-dimenstional grid is generated over the system, and the atomic
charge is mapped on the grid; a fast fourier transforms is used to evaluate the summation of these
grid points efficiently. In addition, incorporating an infinite number of unit cells in PME simply
involves extrapolating the fourier series to infinity. [30, 31]
1.2.3.6 Temperature control- Langevin thermostat
In MD simulation, the total energy of the system is conserved. If the total number of atoms
conducted in the NVE ensemble also called microcanonical ensemble. An ensemble is a large
collection of different microstates with an identical macroscopic in a system. For different
situations, the MD simulation can be conduced in NVT (fixed number of atoms, fixed volume,
and fixed temperature) or NTP ensemble (fixed number of atoms, fixed temperature, and fixed
pressure). Therefore, the temperature should be controlled in MD simulations. In this thesis, an
essential method used to maintain constant temperature is Langevin dynamics. [32]
In the Langevin dynamics, all atoms receive a random force and a friction force at each step,
and these forces are related to the fluctuation-dissipation theorem to ensure sampling of the NVT
statistics. Instead of the Newton’s equations, the dynamics of atoms is described by the
Langevin’s equation [33] shown as follows:
(1.13)
Here, 𝑚 is the mass of the particle, 𝑈 represents the particle interaction potential, 𝛤 is a
friction coefficient, is the velocity, is the acceleration, and 𝑊!(𝑡) is the random force
determined from a Gaussian distribution. 𝑊!(𝑡) varies by the desired temperature and timestep
and it is balances with the friction force to keep the system temperature.
1.2.3.7 Pressure control
In the NPT ensemble, pressure is fixed, so the volume of the unit cell is allowed to fluctuate
in the simulated system. Usually, the pressure is calculated via the virial theorem of Causius.
[34]
(1.14)
𝑉 is the volume of the unit box, 𝐸!"#$%"& is the kinetic energy, and 𝛯 is the inner virial
tensor for pair-additive potentials further described as:
(1.15)
Here, 𝑓 𝑟!" is the force on particle i caued by particle j, and 𝑟!" is the distance between
the particle i and the particle j. When the system is treated as an isotropic manner, the pressure is
a scalar quantity and can be expressed as:
(1.16)
It is common to correct the pressure through a change in the inner virial 𝛯 by scaling the
distances of inter particle. For Nosé-Hoover Langevin piston barostat, an additional degree of
freedom, a piston (𝜎), is introduced into the equation of motion of each atom to vary the volume
1.2.4 Docking
Docking is a computational technique that can place one ligand with the receptor in possible
binding forms with optimal interactions. In docking, a bounding box is set to define a space
where the ligand can bind to the target receptor, and the possible binding conformations and
poses of the ligand can be sampled and ranked by calculating the estimated binding free energy
of the receptor-ligand complex, so we can predict which binding mode is the most predominant
with three-dimensional structure. Normally, the ligand-binding site of the target biomolecule
could be a catalytic site in the enzyme, so the knowledge about the catalytic mechanism of
biological processes for the target biomolecule can provide insights to determine the size and the
position of the bounding box for docking ligands into the ligand-binding domain. [36]
For docking, there are some inherent limitations. Typically, ligands with rotatable bonds are
allowed to have different conformational changes, but the target molecules, such as protein, are
treated as a rigid body. When the target molecules are kept in a particular conformation, docking
algorithms may predict about 50% ~ 70% incorrect binding modes or energies. [37] In addition,
the semi-empirical force field is used to calculate the binding free energy that is less accurate
parameters in the program are determined from known structures leading to the inaccurate scores.
Furthermore, the solvent effect is not adequately applied on the receptor-ligand system even if
the solvent plays a significant role in the binding system. [36]
1.2.5 Molecular mechanic-Poisson Boltzmann surface area (MM-PBSA) calculation
The binding free energy of ligand to protein can be predicted by MM-PBSA calculation
with MD trajectories. [38] In ideal condition, the binding free energy of ligand to protein is
evaluated by calculating the difference of free energy between unbound and bound two
molecules in solvated state.
∆𝐆𝐛𝐢𝐧𝐝,𝐬𝐨𝐥𝐯 = ∆𝐆𝐜𝐨𝐦𝐩𝐥𝐞𝐱,𝐬𝐨𝐥𝐯 − ∆𝐆𝐩𝐫𝐨𝐭𝐞𝐢𝐧,𝐬𝐨𝐥𝐯 − ∆𝐆𝐥𝐢𝐠𝐚𝐧𝐝,𝐬𝐨𝐥𝐯 (1.17)
However, a large number of solvent molecules occupy in the system, so solvent effects on
solvent-solvent interactions and fluctuations are major energy contribution rather than the
binding energy. Thus MM-PBSA is an effective method to calculate binding free energy as the
following equation. [39]
∆𝑮𝒃𝒊𝒏𝒅,𝒔𝒐𝒍𝒗 = ∆𝑮𝒃𝒊𝒏𝒅,𝒗𝒂𝒄 + ∆𝑮𝒄𝒐𝒎𝒑𝒍𝒆𝒙,𝒔𝒐𝒍𝒗 − ∆𝑮𝒑𝒓𝒐𝒕𝒆𝒊𝒏,𝒔𝒐𝒍𝒗 − ∆𝑮𝒍𝒊𝒈𝒂𝒏𝒅,𝒔𝒐𝒍𝒗 (1.18)
∆𝐺!"#$,!"#$ and ∆𝐺!"#$,!"# represent the binding free energies in the solvated and vacuum
for complex, protein, and ligand. The solvation free energy contains the contribution of the
electrostatic interaction and hydrophobic interaction.
∆𝑮𝒔𝒐𝒍𝒗 = ∆𝑮𝒔𝒐𝒍𝒗,𝒆𝒍𝒆𝒄𝒕𝒓𝒐𝒔𝒕𝒂𝒕𝒊𝒄 + ∆𝑮𝒔𝒐𝒍𝒗,𝒉𝒚𝒅𝒓𝒐𝒑𝒉𝒐𝒃𝒊𝒄 (1.19)
Poisson Boltzmann (PB) approach was used to solve the electrostatic contribution of the
solvation free energy ∆𝐺!"#$,!"!#$%&'$($)#, and the hydrophobic contribution was calculated from
the surface area (SA). Under the constant temperature condition, the vacuum binding free energy
can be defined as
∆𝑮𝒃𝒊𝒏𝒅,𝒗𝒂𝒄 = ∆𝑬𝒃𝒊𝒏𝒅,𝒗𝒂𝒄 − 𝑻∆𝑺 (1.20)
In the eq. 1.20, ∆𝐸!"#$,!"#, which includes molecular mechanics bond energy, molecular
mechanics van der Waals energy, and molecular mechanics electrostatic energy, is the binding
free energy between ligand and receptor in vacuum, and ∆S is the entropy change upon binding
in vacuum. According to the eq. 1.19 and eq. 1.20, the binding free energy can be described by
the eq. 1.21.
1.2.6 Tanimoto similarity with ROCS and EON
Proteins (enzymes, receptors, etc.) recognize ligands or inhibitors by their shape and charge.
Ligand based virtual screening techniques can identify new scaffolds that can bind to the same
pocket with similar overall shape and charge distribution. After running the MD simulation, we
obtained the possible configurations of shape and charge to run virtual screening by ROCS
(Rapid Overlay of Chemical Structures) and EON (electrostatics comparison program) basing on
Tanimoto measurement. [40, 41]First, an ensemble of ligand conformations was generated for
all compounds in NCI database by program OMEGA [42], and query molecule and database
conformer are aligned by a solid-body optimization process with ROCS (figure 1.9). After
aligning their shape, EON, an, was used to compare electrostatic potential maps of these aligned
molecules and determine the Tanimoto measurement for finding the potent inhibitors.
Tanimoto measurement is used in the comparison of sets of 3D parameters, and it involves
comparing properties for two compounds with the overlap of those properties. Shape functions
for A and B are compared with the overlap between the two shape functions after alignment to
give Shape Tanimoto values that approach 0.0 for dissimilar and 1.0 for similar shapes (eq. 1.22).
fields to give Electrostatic Tanimoto values that approach -1/3 for opposite and 1.0 for similar
field overlaps (eq. 1.23)
(1.22)
(1.23)
1.2.7 Trajectory Analysis
1.2.7.1 RMSD
The Root Mean Square Deviation (RMSD) [43] is a measurement of differences between
two values, and it is frequently used to calculate the structural similarity between two
macromolecules. To achieve the minimal RMSD, an optimal superposition of structures is
necessary to eliminate the deviations from translation and rotation, and RMSD can be defined
by:
(1.24)
Here, 𝑁 is the total number of selected atoms in a reference or instantaneous configuration,
𝑟!! is the coordinates of nth atom for ith conformation of the macromolecule, and 𝑟
coordinates of nth atom for jth conformation of the macromolecule. Usually, the changes in the
order of 1-3 Å are acceptable for small proteins.
1.2.7.2 RMSF
The Root Mean Square Fluctuation (RMSF) [44] is the standard deviation between the
position of the residue i and the position of residue i from the average structure to measure the
local chain flexibility.
(1.25)
Here, 𝑇 is the trajectory time, 𝑟!!"# is the time-averaged position of the residue 𝑖, 𝑟!(𝑡) is
the position of the residue i at time 𝑡.
1.3 EXPERIMENTAL PROCEDURE
To construct a TDP1 model, the protein structures of human TDP1 were obtained from the
RCSB Protein Data Bank (PDB code: 1RG1, 1JY1, 1QZQ). Holo-form TDP1 (1RG1) was used
as the template structure, and missing residues 124-161 were added from 1JY1, residues 387-390
PyMOL. Missing loops between residues 560-568 were built with the program ModLoop:
automated modeling of loops in protein structures bioinformatics.[45, 46]
Flexible docking was applied for docking leading compound to our TDP1 model in
Autodock 4.2.[47] The Lamarckian genetic algorithm was used for two hundreds runs, and the
grid box was centered at the middle of the DNA-protien binding cleft.
Simulations were performed using the AMBER ff99SB forcefield, in the NAMD2.9 [48]
molecular dynamics program. Bonded and short-range interactions were evaluated every 2fs,
with long-range electrostatics evaluated every 4 fs with the smooth particle mesh ewald method.
[49] Short-range nonbonded interactions were evaluated using a 10Å cutoff with a switching
function at 8.5 Å. The r-RESPA [50] multiple timestep integration scheme was employed with a
2fs timestep and SHAKE employed to fix bonds between hydrogens and heavy atoms. Partial
charges for ligands were computed via Gaussian geometry optimization, followed by RESP
fitting of the resultant Mulliken population analysis in the program antechamber, a component of
the AMBER computational chemistry suite. Atom types were automatically generated for the
ligand in antechamber, with atomic parameters taken from the generalized amber force field
box extended 10A in every direction from the protein-ligand complex and Na+ and Cl- ions
added to 0.15M. The equilibration protocol consists of 5000-steps of steepest descent energy
minimization, with positional constraints placed on solvent atoms, followed by another
5000-steps of conjugated gradient minimization without positional restraints. The system was
then simulated for 100-ps in the canonical ensmble, while heating from 0 to 300 K with
positional restraints on all solute heavy atoms. Finally, the system was simulated in the
isothermal-isobaric ensemble for 2 ns with positional restraints on protein backbone atoms only.
The system was sampled in the isothermal-isobaric ensemble for 100 ns for analysis.
1.4 RESULTS AND DISCUSSION
1.4.1 Docking of NSC339616 to TDP1
The leading compound, NSC 339616, we used for docking was discovered by using virtual
screening from 265,000 NCI compounds, and it was found that the compound is a selective
inhibitor of TDP1 according to the gel assay (figure 1.10). Our docking results indicate that
NSC339616 likely binds either directly to the active site or to the DNA-binding cleft of TDP1.
Molecular dynamics simulations, as previously described, were carried out on the top 4 docking
experimentally, as well as determine the dominant conformation of the bound ligand. The
relative stability of each complex was monitored by RMSD. As seen in figure 1.12, binding of
ligand to the DNA-binding cleft greatly reduces conformational flexibility in that region of the
protein. The evidence for regional conformational stabilization by DNA-binding cleft
interactions with the ligand is further compounded by the RMSF plots in figure 1.13. Major
reductions in RMSF in bining pose 1 (BP1) relative to binding pose 2 (BP2) occur mostly in a
flexible loop near the binding site, indicating that closure of this loop over the cleft is a direct
result of ligand binding (figure 1.14).
15,000 evenly spaced frames from the MD trajectories were clustered to identify the
kinetically dominant binding pose (figure 1.15). BP1 exhibits hydrogen bonding from
NSC339616 to Ser363 and Gln365, with Phe159 stacking over the aliphatic portion of the
compound to stabilize loop closure. In BP2, NSC339616 forms hydrogen bonds to Lys265 and
Asn139 as well as nonpolar interactions with Tyr104.
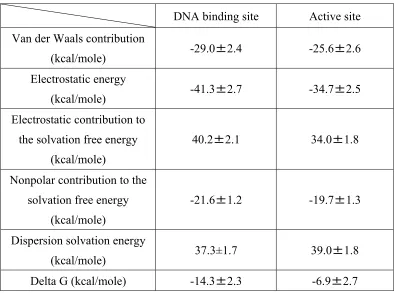
1.4.2 Binding free energy calculation
To distinguish between the active site and DNA-binding cleft ligand binding sites, PBSA
the two poses, at ~7 kcal/mol lower than BP2, with Van der Waals and electrostatic contributions
[image:37.612.109.503.238.531.2]indicating stronger protein-ligand interactions.
Table 1.1 Comparison of MM-PBSA results for ligand bound in DNA binding site and
active binding site.
DNA binding site Active site
Van der Waals contribution
(kcal/mole) -29.0±2.4 -25.6±2.6
Electrostatic energy
(kcal/mole) -41.3±2.7 -34.7±2.5
Electrostatic contribution to the solvation free energy
(kcal/mole)
40.2±2.1 34.0±1.8
Nonpolar contribution to the solvation free energy
(kcal/mole)
-21.6±1.2 -19.7±1.3
Dispersion solvation energy
(kcal/mole) 37.3±1.7 39.0±1.8
Delta G (kcal/mole) -14.3±2.3 -6.9±2.7
1.4.3 Similarity search with 3D shape and electrostatic comparison
The NSC339616 conformation in BP1 was used to perform shape- and electrostatics-based
screening against the NCI small molecule library. 10,000 potential analogues were identified and
ranked by linear combination of their electrostatic and shape Tanimoto scores. The top six
compounds in this ranking are displayed as shape- and electrostatic overlays with NSC339616 in
figures 1.17 and 1.18.
1.5 CONCLUSIONS
The development of TDP1 and TDP2 selective inhibitors is a very attractive therapeutic goal,
given that such an inhibitor could be used in conjunction with topoisomerase poisons, leading to
higher rates of clinical success in cancer patients who have been prescribed topoisomerase
poisons. Using NSC339616 as a lead compound, we have identified 6 potential inhibitor
candidates and determined that flexibility in the DNA-binding cleft of TDP1 can be exploited as
a binding site for small molecules. Further cycles of virtual screening against these 6 compounds
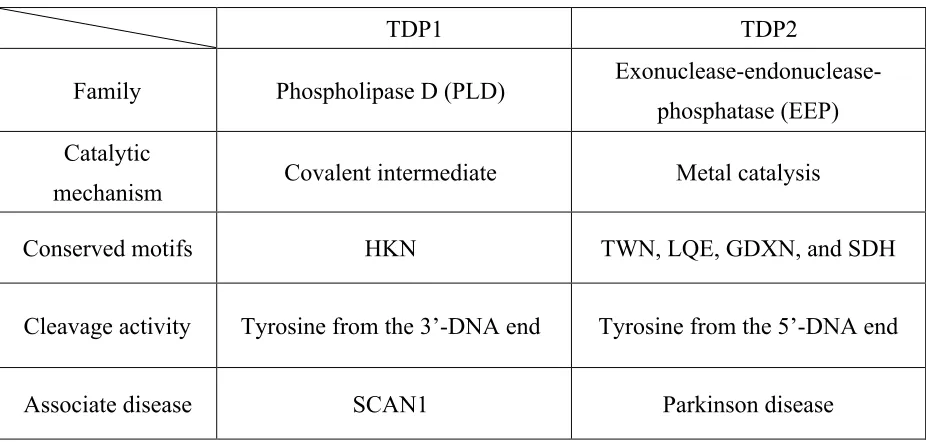
Table 1.2 Comparison of TDP1 and TDP2.
TDP1 TDP2
Family Phospholipase D (PLD) Exonuclease-endonuclease-
phosphatase (EEP) Catalytic
mechanism Covalent intermediate Metal catalysis
Conserved motifs HKN TWN, LQE, GDXN, and SDH
Cleavage activity Tyrosine from the 3’-DNA end Tyrosine from the 5’-DNA end
Associate disease SCAN1 Parkinson disease
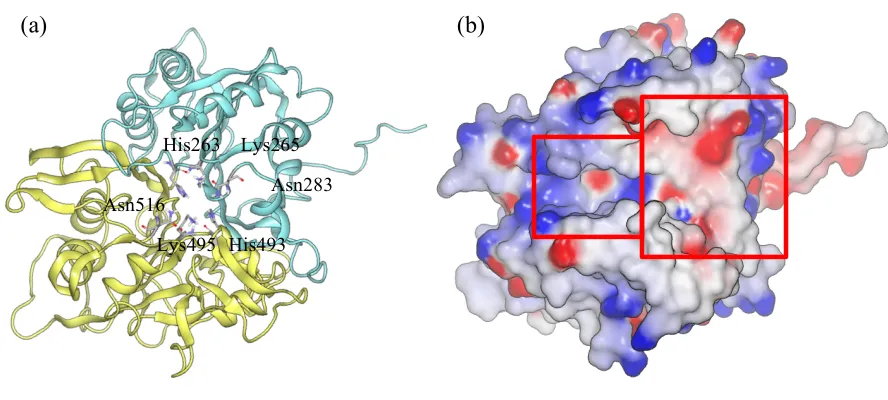
Figure 1.2 Crystal structure of human TDP1 (PDB ID: 1RG1).
(a) TDP1 structure is shown in ribbon. Each N-terminal (cyan) and C-terminal (yellow) provides one HKN motif in the center of the TDP1. (b) The structure is colored by electrostatic potential (blue in positive and red is negative). Left side with narrow channel and positive charge is DNA binding site, and the right side with bowl shape and negative charge is peptide-binding site.
(a) (b)
Asn283 Lys265 His263
Asn516
His263 Glu538
His493
Top1-Tyr His263
Glu538
His493
Top1-Tyr His263
[image:41.612.77.534.95.310.2]Glu538 His493 His263 Glu538 His493 Top1-Tyr His493 Glu538 His263
Figure 1.3 Catalytic mechanism of TDP1.
At the beginning, His263 residue attacks phosphotyrosyl bond between the Top1-DNA complex, and His493 residue protonates the tyrosine-containing leaving group to cleave the phosphodiester bond with the formation of the transient covalent phosphoamide bond. The negatively charged residue of Glu538 stabilizes the hydrogen on imidazole ring of His263 to
keep the proximal nitrogen acting as a nucleophile.Next, the His493 residue from the C-terminal
domain acts as a general base to active a water molecule that hydrolyzes the covalent intermediate. [7, 52]
N N
P O O HO
HO DNA5'
HN NH N N P O O HO
HO DNA5'
HN NH N N P OH O HO
HO DNA5'
N NH
H2O
N N
P O HO
HO DNA5'
N NH O H H N N P O HO
HO DNA5' HN NH OH O O
H3N O
O
H H H H H
O O H3N O
O
O O H3N O
O
O O H3N O
O
O O H3N O
Figure 1.4 The repair of the topoisomerase II-mediated DNA damage by TDP2.
[image:42.612.190.446.333.510.2]Figure 1.6 Crystal structure of human TDP2 (PDB ID: 4GZ1).
(a) TDP2 structure is shown in ribbon. Catalytic residues, N130, D132, E162, D272, N274, and H359, are shown in sticks in the center of the TDP2. (b) The structure is colored by electrostatic potential (blue in positive and red is negative). Similarly to TDP1, left side with positive charge is DNA binding cleft, and the right side negative charge is catalytic region.
(a) (b)
E162 D272
N274
H359
Figure 1.7 Virtual Screening Protocol.
Figure 1.8 Intra- and inter- molecular interactions.
(a) bond stretching, (b) angle bending, (c) torsional angle, (d) improper anagle, (e) van der Waals, and (f) electrostatic interactions.
(a) (b)
(d) (c)
Figure 1.9 Basic ideal of Tanimoto similarity.
Figure 1.10 TDP1 and TDP2 gel assay.
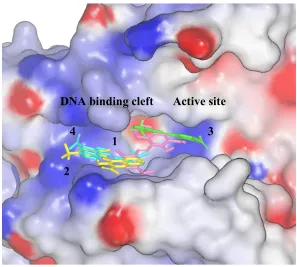
Figure 1.11 Four representative docking poses of NSC339616 in TDP1 model.
Both the DNA and the active site with positive charge distribution are available providing electrostatic interaction to stabilize our leading compound with -1 charge. The estimated binding free energy for 1~4 binding poses are -6.26, -6.19, -5.75, and -5.63 kcal/mol, respectively. TDP1 structure is colored by electrostatic potential (blue in positive and red is negative).
Active site DNA binding cleft
1 4
2
Figure 1.12 Changes of RMSD of two binding pose as a function of time from MD
simulation.
Figure 1.13 RMSD profiles in two binding poses
− Binding pose 1 (DNA site)
− Binding pose 2 (active site)
− Binding pose 1 (DNA site)
[image:48.612.100.522.390.652.2].
Figure 1.14 Comparison of TDP1 structures for (a) binding pose 1, (b) binding pose 2.
(a,b) The structure is colored by RMSF, and the highlight loop locating in the DNA binding site shows different flexibilities between two binding poses. Blue region means less fluctuation, and
(a) (b)
red area indicates more fluctuation. (c,d) NSC339616 in the DNA binding site induces the flexible loop become closer.
Figure 1.15 Binding properties of two binding poses in TDP1 model.
(a) Binding pose 1 and (b) binding pose 2. Hydrogen bonds are drawn in cyan line. NSC339616 is shown in yellow sticks, and residues within 3.0 Å of the ligand are shown in tan sticks. (Yellow is C, blue is N, green is F, and lime is Cl.) The structure is colored by RMSF (blue region means less fluctuation, and red area indicates more fluctuation).
(a) (b)
Arg435
Ser363 Phe159
Gln365
Tyr104
Asn283 Lys121
Lys395 Ser303
Lys419
His163
Figure 1.16 Ligand-residue interactions from MM-PBSA energy decomposition for binding
poses 1 (a) and 2 (b) in TDP1 model.
TDP1 structure is colored by the values of interaction contribution from red (more contribution) to blue (less contribution).
Arg435
Ser363 Phe159
Gln365 Ser303
Lys419
Ser418
Lys121
Pro361 Gly302
Thr366
Figure 1.17 Virtual screening with ROCS.
The shape Tanimoto scores of compounds are followed as: 1: 0.849, 2: 0.799, 3: 0.771, 4: 0.765, 5: 0.756, and 6: 0.754. The template is shown in green, and hits are shown in blue. The shapte Tanimoto score ranges from 0(non-identical) to 1(identical).
1 2 3
4 5 6
1 2 3
Figure 1.18 Virtual screening with EON.
The EON_ET_combo scores of compounds are followed as: 1: 1.71, 2: 1.665, 3: 1.610, 4: 1.596, 5: 1.594, and 6: 1.589. The are colored by electrostatic potential. Electrostatic Tanimoto combo score (ET_combo) that is the sum of the Shape Tanimoto and the Electrostatic Tanimoto, ranges from -1/3 (non-identical) to 2 (identical) values resulting from the overlap of charge and shape matches. TDP1 potent inhibitors are shown in molecular surface and colored by electrostatic potential (blue in positive and red is negative).
Leading compound
3
6
1 2
4 5
Leading compound
1 2 3
Figure 1.19 Top six potent TDP1 inhibitors. N N OH O O O O O O N N OH O O N O O N O N O O O O O O O O O
NCI 134141 NCI 11713 NCI 89112
NCI 147740 NCI 51480 NCI 19891
NCI 13414 NCI 11713 NCI 89112
REFERENCE
1. Leppard, J.B. and J.J. Champoux, Human DNA topoisomerase I: relaxation, roles, and
damage control. (0009-5915 (Print)).
2. Kato, S. and A. Kikuchi, DNA topoisomerase: the key enzyme that regulates DNA super
structure. Nagoya J Med Sci, 1998. 61(1-2): p. 11-26.
3. JA, H., DNA topoisomerases as anticancer drug targets: from the laboratory to the clinic.
Curr Med Chem Anticancer Agents., 2001. 1(1): p. 1-25.
4. Malik, M. and J.L. Nitiss, DNA Repair Functions That Control Sensitivity to
Topoisomerase-Targeting Drugs. Eukaryotic Cell, 2004. 3(1): p. 82-90.
5. Comeaux, E.Q. and R.C. van Waardenburg, Tyrosyl-DNA phosphodiesterase I resolves both
naturally and chemically induced DNA adducts and its potential as a therapeutic target. Drug
Metab Rev, 2014. 46(4): p. 494-507.
6. Interthal, H., J.J. Pouliot, and J.J. Champoux, The tyrosyl-DNA phosphodiesterase Tdp1 is a
member of the phospholipase D superfamily. Proc Natl Acad Sci U S A, 2001. 98(21): p.
7. Davies, D.R., et al., The crystal structure of human tyrosyl-DNA phosphodiesterase, Tdp1.
Structure, 2002. 10(2): p. 237-48.
8. Cortes Ledesma, F., et al., A human 5'-tyrosyl DNA phosphodiesterase that repairs
topoisomerase-mediated DNA damage. Nature, 2009. 461(7264): p. 674-8.
9. Nitiss, J.L. and K.C. Nitiss, Tdp2: a means to fixing the ends. PLoS Genet, 2013. 9(3): p.
e1003370.
10. Schellenberg, M.J., et al., Mechanism of repair of 5'-topoisomerase II-DNA adducts by
mammalian tyrosyl-DNA phosphodiesterase 2. Nat Struct Mol Biol, 2012. 19(12): p.
1363-71.
11. Shi, K., et al., Structural basis for recognition of 5'-phosphotyrosine adducts by Tdp2. Nat
Struct Mol Biol, 2012. 19(12): p. 1372-7.
12. Reddy, A.S., et al., Virtual screening in drug discovery -- a computational perspective. Curr
Protein Pept Sci, 2007. 8(4): p. 329-51.
13. Chothia, C. and A.M. Lesk, The relation between the divergence of sequence and structure
14. Kaczanowski, S. and P. Zielenkiewicz, Why similar protein sequences encode similar
three-dimensional structures? Theoretical Chemistry Accounts, 2010. 125(3-6): p. 643-650.
15. McCammon, J.A., B.R. Gelin, and M. Karplus, Dynamics of folded proteins. Nature, 1977.
267(5612): p. 585-590.
16. Beckford, S.J. and D.W. Dixon, Molecular dynamics of anthraquinone DNA intercalators
with polyethylene glycol side chains. J Biomol Struct Dyn, 2012. 29(5): p. 1065-80.
17. Meng, H., et al., Molecular dynamics simulation of the allosteric regulation of eIF4A protein
from the open to closed state, induced by ATP and RNA substrates. PLoS One, 2014. 9(1): p.
e86104.
18. Khalili-Araghi, F., et al., Molecular dynamics simulations of membrane proteins under
asymmetric ionic concentrations. J Gen Physiol, 2013. 142(4): p. 465-75.
19. Seibert, M.M., et al., Reproducible polypeptide folding and structure prediction using
molecular dynamics simulations. J Mol Biol, 2005. 354(1): p. 173-83.
20. Perez, A., et al., Refinement of the AMBER force field for nucleic acids: improving the
21. Schlick, T., E. Barth, and M. Mandziuk, Biomolecular dynamics at long timesteps: bridging
the timescale gap between simulation and experimentation. Annu Rev Biophys Biomol
Struct, 1997. 26: p. 181-222.
22. Ryckaert, J.-P., G. Ciccotti, and H.J.C. Berendsen, Numerical integration of the cartesian
equations of motion of a system with constraints: molecular dynamics of n-alkanes. Journal
of Computational Physics, 1977. 23(3): p. 327-341.
23. Verlet, L., Computer "Experiments" on Classical Fluids. I. Thermodynamical Properties of
Lennard-Jones Molecules. Physical Review 1967. 159: p. 98-103.
24. Stone, A.J., The Theory of Intermolecular forces. 1996: Clarendon Press.
25. Toxvaerd, S. and J.C. Dyre, Communication: Shifted forces in molecular dynamics. The
Journal of Chemical Physics, 2011. 134(8): p. 081102.
26. Wu, X.-W. and S.-S. Sung, Constraint dynamics algorithm for simulation of semiflexible
macromolecules. Journal of Computational Chemistry, 1998. 19(14): p. 1555-1566.
27. Brooks, C.L., B.M. Pettitt, and M. Karplus, Structural and energetic effects of truncating
long ranged interactions in ionic and polar fluids. The Journal of Chemical Physics, 1985.
28. Ewald, P.P., Die Berechnung optischer und elektrostatischer Gitterpotentiale. Annalen der
Physik, 1921. 369(3): p. 253-287.
29. Darden, T., D. York, and L. Pedersen, Particle mesh Ewald: An N⋅log(N) method for Ewald
sums in large systems. The Journal of Chemical Physics, 1993. 98(12): p. 10089-10092.
30. Patel, S. and C.L. Brooks, 3rd, CHARMM fluctuating charge force field for proteins: I
parameterization and application to bulk organic liquid simulations. J Comput Chem, 2004.
25(1): p. 1-15.
31. Patel, S., A.D. Mackerell, Jr., and C.L. Brooks, 3rd, CHARMM fluctuating charge force
field for proteins: II protein/solvent properties from molecular dynamics simulations using a
nonadditive electrostatic model. J Comput Chem, 2004. 25(12): p. 1504-14.
32. Schlick, T., Molecular Modeling and Simulation. 2002: Springer.
33. Hünenberger, P., Thermostat Algorithms for Molecular Dynamics Simulations, in Advanced
Computer Simulation, C. Dr. Holm and K. Prof. Dr. Kremer, Editors. 2005, Springer Berlin
Heidelberg. p. 105-149.
34. Martyna, G.J., D.J. Tobias, and M.L. Klein, Constant pressure molecular dynamics
35. Feller, S.E., et al., Constant pressure molecular dynamics simulation: The Langevin piston
method. The Journal of Chemical Physics, 1995. 103(11): p. 4613-4621.
36. Huang, S.Y. and X. Zou, Advances and challenges in protein-ligand docking. Int J Mol Sci,
2010. 11(8): p. 3016-34.
37. Totrov, M. and R. Abagyan, Flexible ligand docking to multiple receptor conformations: a
practical alternative. Curr Opin Struct Biol, 2008. 18(2): p. 178-84.
38. Archontis, J.M.H.a.G., MM-GB(PB)SA Calculations of Protein-Ligand Binding Free
Energies. 2012.
39. Homeyer, N. and H. Gohlke, Free Energy Calculations by the Molecular Mechanics
Poisson−Boltzmann Surface Area Method. Molecular Informatics, 2012. 31(2): p. 114-122.
40. Fe, S., EON 2.2.0.5: OpenEye Scientific Software, http://www.eyesopen.com.
41. Fe, S., ROCS 3.2.0.4: OpenEye Scientific Software, http://www.eyesopen.com.
42. Hawkins, P.C.D.S., A.G.; Warren, G.L.; Ellingson, B.A.; Stahl, M.T., OMEGA 2.5.1.4:
OpenEye Scientific Software, http://www.eyesopen.com.
43. Root Mean Square Deviation (RMSD), in Encyclopedia of Statistical Sciences. 2004, John
44. Humphrey, W., A. Dalke, and K. Schulten, VMD: Visual molecular dynamics. Journal of
Molecular Graphics, 1996. 14(1): p. 33-38.
45. Fiser, A., R.K. Do, and A. Sali, Modeling of loops in protein structures. Protein Sci, 2000.
9(9): p. 1753-73.
46. Fiser, A. and A. Sali, ModLoop: automated modeling of loops in protein structures.
Bioinformatics, 2003. 19(18): p. 2500-1.
47. Morris, G.M., et al., AutoDock4 and AutoDockTools4: Automated Docking with Selective
Receptor Flexibility. Journal of computational chemistry, 2009. 30(16): p. 2785-2791.
48. Phillips, J.C., et al., Scalable Molecular Dynamics with NAMD. Journal of computational
chemistry, 2005. 26(16): p. 1781-1802.
49. Essmann, U., et al., A smooth particle mesh Ewald method. The Journal of Chemical
Physics, 1995. 103(19): p. 8577-8593.
50. Tuckerman, M., B.J. Berne, and G.J. Martyna, Reversible multiple time scale molecular
51. Gohlke, H., C. Kiel, and D.A. Case, Insights into Protein–Protein Binding by Binding Free
Energy Calculation and Free Energy Decomposition for the Ras–Raf and Ras–RalGDS
Complexes. Journal of Molecular Biology, 2003. 330(4): p. 891-913.
52. Kim, H., et al., Structure-function studies of a plant tyrosyl-DNA phosphodiesterase provide
novel insights into DNA repair mechanisms of Arabidopsis thaliana. Biochem J, 2012.
443(1): p. 49-56.
2 CHAPTER 2. NETWORK ANALYSIS FOR EVOLUTION OF ALLOSTERIC
COMMUNICATION IN 3-KETOSTEROID RECEPTORS
2.1 INTRODUCTION
2.1.1 Structure and Function of 3-ketosteroid receptors
3-ketosteroid (3KS) receptors are a ubiquitous family of nuclear hormone receptors (NRs)
that regulate multiple biological pathways by either up-regulating transcription via binding to a
glucocorticoid response-activating element ((+)GRE) or down-regulating transcription via
binding to a glucocorticoid response-repressing element (nGRE). After diverging from the latest
common ancestor, Ancestral Steroid Receptor 2 (AncSR2) [1], members of the 3KS family have
evolved varying binding affinities for (+)GRE and nGRE elements that act as allosteric effectors
to influence protein structures and activity. [2] The mutations within the 3KS family cause no
significant perturbation to the secondary structure of the DNA binding domain (DBD) of the
receptor, making allosteric effects the most likely cause of differences in binding affinity
between the homologues. [3]
The 3KS DBD consists of two zinc fingers, a “reading helix,” responsible for making
D-box (distal box; see figure 2.1), and P-box (proximal box; see figure 2.1). The D-box is
primarily involved in dimerization, while the P-box interacts with the DNA. [4] [5]
2.1.2 Glucocorticoid Response Elements
(+)GREs consist of two hexameric, inverted half-sites that are separated by a three base
pair spacer, causing the 3KS DBD to bind as a homodimer (figure 2.2). Studies indicate that the
(+)GREs allosterically activates transcription [2, 5-7] by positively promoting the binding of a
second monomer after one monomer binds. In contrast to (+)GREs, 3KS receptors bind to nGRE
elements as monomers on opposing sides of the DNA duplex, with each monomer’s D-box
facing away from the other, separated by a 0-2 base pair spacer (figure 2.2). [8, 9]
2.1.3 Specific goal
Although 3-Ketosteroid nuclear receptors share similar structure, evolutionary mutations
occurring far from the dimerization and DNA binding interfaces cause differing GRE binding
affinities. [10] Therefore, we have investigated allosteric communication within selected
3-Ketosteroid DBD complexes, illustrating how network theory can be applied to elucidate the
2.2 METHOD
2.2.1 Dynamic network analysis
Network theory is a broad field that can be applied to a diverse range of complex systems,
such as social network or biological network analysis. A network is an analytically useful
representation of a collection of interacting components (nodes) and the communication
pathways between them (edges). In the case of protein-DNA systems, nodes are assigned to each
protein α-carbon and phosphorus and C1’ atoms in nucleotides. An edge is placed between two
nodes that are within a 4.5 Å cutoff for over 75% of the MD trajectory, with the weight of the
edge between nodes i and j calculated as 𝑊!" =−log(|𝐶!"|), where Cij is the cartesian
covariance between the nodes, calculated from eq. 2.1 and 2.2. [11, 12] According to this
network model, residues are defined to have strong correlation if their coordinates move in the
same way.
(2.1)
Here the expectation value represents time average, and is the cartesian position vector of the ith
node at the time t. In practice, these covariance values are calculated for every node pair in the
complex and organized in a covariance matrix from which the network data is derived.
2.2.2 Selected analysis methodologies for dynamical networks
Within a network, nodes tend to organize into clusters with dense intra-cluster connections.
These clusters are known as communities and yield insight into the global structure of the
network communication pathways. There are many ways to organize a network into communities,
with one of the more rigorous being the Girvan-Newman (GN) algorithm. [12, 13] In GN, the
shortest communication pathway between every node pair (the optimal path) is first determined,
based on edge weight. i.e. A very heavily weighted edge is conceptually shorter than a lighter
edge. Next, an edge is assigned a betweenness value that reflects the number of optimal paths
that proceed through it. The algorithm then begins removing edges, starting with those
possessing the highest betweenness, assessing the modularity (Q, eq. 2.3) after removing each
(2.3)
Here, 𝐴!" is an adjacency matrix (𝐴!" = 1 if node 𝑖 and node 𝑗 are connected, otherwise
𝐴!" =0), 𝐾! and 𝐾! is degree of node 𝑖 and 𝑗 to present the number of edges at each node,
and
𝑚
is the total number of the edges in the network. After nodes are assigned to communities,the betweennesses of the edges that lie between communities can be summed over, producing a
quantitative total-betweenness value that describes how closely intertwined two communities are.
For example, a pair of communities that exhibit a very high total-betweenness can be considered
close to merging into a single community.
2.3 EXPERIMENTAL PROCEDURE
Here we investigate allosteric signal transduction in (+)GRE complexes for six 3KS family
members: AncSR2, Ancestral Glucocorticoid Receptor (AncGR), Ancestral Glucocorticoid
Rreceptor 2 (AncGR2), the human Glucocorticoid Receptor (hGR), Ancestral Mineralocorticoid
Receptor (AncMR), and the human Mineralocorticoid Receptor (hMR); and in nGRE complexes
for the hGR and AncSR2 homologues. The unpublished crystal structures for these complexes
NaCl, TIP3P waterbox with 10Å distances between the edges of the solute and the box.
Simulations were run using the molecular dynamics program NAMD 2.9 [15] with the amber
ff99SB-parmbsc0 force field [16]. Bonded and short-range interactions were evaluated every 2fs,
with long-range electrostatics evaluated every 4 fs with the smooth particle mesh ewald method
[17]. Short-range nonbonded interactions were evaluated using a 10Å cutoff with a switching
function at 8.5 Å. The r-RESPA [18] multiple timestep integration scheme was employed with a
2fs timestep and SHAKE employed to fix bonds between hydrogens and heavy atoms. Each
system was subjected to 10,000 steps of conjugate gradient minimization, followed by 100ps of
dynamics in the NVT ensemble, during which the system was heated from 0 to 300 K with
positional restraints applied to the solute. Finally, 7 NPT ensemble simulations were performed
at 1 atm for 1ns, with each stage incrementally releasing the positional restraints, first on the
protein, followed by the DNA, with sidechains and bases released before backbone atoms. 220ns
of unrestrained NPT was performed, with the beginning 20ns discarded as equilibration,
2.4 RESULTS AND DISCUSSION
2.4.1 Sequence alignment and evolution tree
We have inferred the relative binding affinities of many members of the 3KS family to
(+)GRE and nGRE elements from two experimental lines of evidence: florescence anisotropy
probes and luciferase assays. Figure 2.3 displays the results of the fluorescence anisotropy
experiments. The results show little difference in (+)GRE binding for most of the homologues,
with the exception of the hMR variant that exhibits lower affinity than the rest, while the nGRE
binding data shows conclusively that AncGR2 and hGR are the homologues shown that bind to
nGRE elements with substantial affinity.
Luciferase reporter activity in HeLa cells shows that the orders for (+)GRE activation (figure
2.4) and nGRE repression (figure 2.5) for the 3KS homologues are AncGR > AncGR2 > hGR >
AncSR2 ~ AncMR > hMR and AncGR2 ~ hGR > AncSR2 ~ AncGR > AncMR ~ hMR ~ 0,
respectively. This data has been incorporated into the phylogenetic tree in figure 2.6 in order to
highlight the role of epistasis in this evolutionary pathway. From multiple sequence alignment of
3-ketosteroid receptor DBDs within GR and MR lineage, these DBDs are highly conserved with