www.hydrol-earth-syst-sci.net/19/1263/2015/ doi:10.5194/hess-19-1263-2015
© Author(s) 2015. CC Attribution 3.0 License.
Simulating past changes in the balance between water demand and
availability and assessing their main drivers at the river basin scale
J. Fabre1, D. Ruelland1, A. Dezetter2, and B. Grouillet1
1CNRS, HydroSciences Laboratory, Place Eugene Bataillon, 34095 Montpellier, France 2IRD, HydroSciences Laboratory, Place Eugene Bataillon, 34095 Montpellier, France
Correspondence to: J. Fabre ([email protected])
Received: 30 September 2014 – Published in Hydrol. Earth Syst. Sci. Discuss.: 4 November 2014 Revised: 4 February 2015 – Accepted: 4 February 2015 – Published: 5 March 2015
Abstract. In this study we present an integrative modeling framework aimed at assessing the balance between water de-mand and availability and its spatial and temporal variabil-ity over long time periods. The model was developed and tested over the period 1971–2009 in the Hérault (2500 km2, France) and the Ebro (85 000 km2, Spain) catchments. Nat-ural streamflow was simulated using a conceptual hydrolog-ical model. The regulation of river flow was accounted for through a widely applicable demand-driven reservoir man-agement model applied to the largest dam in the Hérault Basin and to 11 major dams in the Ebro Basin. Urban wa-ter demand was estimated from population and monthly unit water demand data. Water demand for irrigation was com-puted from irrigated area, crop and soil data, and climatic forcing. Water shortage was assessed at a 10-day time step by comparing water demand and availability through indica-tors calculated at strategic resource and demand nodes. The outcome of this study is twofold. First, we were able to cor-rectly simulate variations in influenced streamflow, reservoir levels and water shortage between 1971 and 2009 in both basins, taking into account climatic and anthropogenic pres-sures and changes in water management strategies over time. Second, we provided information not available through sim-ple data analysis on the influence of withdrawals and con-sumptive use on streamflow and on the drivers of imbalance between demand and availability. Observed past variations in discharge were explained by separating anthropogenic and climatic pressures in our simulations: 3 % (20 %) of the de-crease in the Hérault (Ebro) discharge were linked to anthro-pogenic changes. Although key areas of the Hérault Basin were shown to be highly sensitive to hydro-climatic variabil-ity, the balance between water demand and availability in the
Ebro Basin appears to be more critical, owing to high agri-cultural pressure on water resources. The modeling frame-work developed and tested in this study will be used to assess water balance under climatic and socioeconomic prospective scenarios and to investigate the effectiveness of adaptation policies aimed at maintaining the balance between water de-mand and availability.
1 Introduction
inter-actions between water uses and resources (including storage and regulation facilities).
Many authors have underlined the need for integrative assessments of the impacts of climate change on the bal-ance between water demand and availability (e.g., Füssel and Klein, 2006; Ludwig et al., 2011), and an increasing number of studies that deal with this issue can be found in the litera-ture. Studies at a global scale (e.g., Arnell et al., 2011) com-bined socioeconomic and hydro-climatic data from global databases, and identified the regions most susceptible to ex-perience water stress. Here water stress is defined as an im-balance between water demand and availability, i.e., when water demand is greater than water supply. However, wa-ter management decisions are more often made at the river basin scale. Water resources at this scale are generally highly influenced by human activities and the assessment of imbal-ance between water demand and availability implies a thor-ough analysis of the spatial and temporal dynamics of wa-ter resources and uses. In this mindset, recent studies com-paring water demand and availability were conducted at the river basin scale (e.g., Beck and Bernauer, 2011; Pulido-Velazquez et al., 2011; Varela-Ortega et al., 2011; Griffin et al., 2013; Koutroulis et al., 2013), with the aim of opti-mizing water allocation in given conditions or for the design of water management plans, which require a long-term per-spective.
Studies that compare water demand and availability at the basin scale rarely fully incorporate anthropogenic and climatic drivers. The studies generally focus on simulat-ing water resources (i.e., surface streamflow and/or ground-water levels) under varying climatic conditions. In some cases, water uses are dealt with by looking at population changes, without quantifying the corresponding water de-mand (i.e., the volumes associated; e.g., Griffin et al., 2013). In other cases, water demand is not simulated but data from historical series or estimates by local water managers are used (e.g., Pulido-Velazquez et al., 2011; López-Moreno et al., 2014). This limits the possibility of analyzing the drivers of the variations of demand in space and over time, even when sufficient data on withdrawals are available to ac-count for this variability. Moreover, the distinction between water demand and actual water withdrawals is unclear. If water demand is simulated and its variations over time ac-counted for, the impact of climate variability on the de-mand for irrigation water is not always taken into account (Koutroulis et al., 2013). Consequently, studies that do not fully incorporate anthropogenic and climatic drivers of wa-ter availability and demand may not completely grasp the ways in which river basins could be affected by future an-thropogenic and climatic changes.
In some studies, water demand is simulated based on an-thropogenic and climatic drivers and is compared to water availability based on climatic variability and water manage-ment rules (e.g., Purkey et al., 2008; Varela-Ortega et al., 2011; Collet et al., 2013; Milano et al., 2013a). However,
they often take a static view of the water balance, account-ing for average conditions over several years (Milano et al., 2013a) or characteristic situations such as particularly dry or wet years (Varela-Ortega et al., 2011). In the context of an-thropogenic and climatic changes, Krol et al. (2006) under-lined the importance of correctly representing the long-term variations in demand and availability which, to our knowl-edge, few studies have achieved so far (one exception being the study by Collet et al., 2013). Indeed, before looking into complex future changes, we need to be able to represent long-term variations, which implies accounting for the variability of anthropogenic and climatic drivers.
In this mindset, interactions between water demands and water resources should also be accounted for. Notably, few studies have actually simulated natural streamflow separately from influenced streamflow. In some cases, hydrological models are calibrated on observed (i.e., influenced) stream-flow data, and the simulated streamstream-flow is compared to wa-ter demand to assess wawa-ter stress (e.g., Collet et al., 2013). Also, a proper distinction should be made between water de-mand, withdrawals, and consumptive use, which was done for example in Collet et al. (2013) and Kiptala et al. (2014). Finally, a complex issue is the representation of the interac-tions between groundwater and surface water, i.e., the use of groundwater resources and the influence that their man-agement could have on streamflow, and the partition of re-turn flows from network losses and inefficient irrigation tech-niques between evaporation, groundwater recharge and re-turn to surface flow.
The balance between water demand and availability can be represented by using indicators. Sullivan and Meigh (2005) defined indicators as “a statistical concept, providing an indi-rect way of measuring a given quantity or state, and allowing for comparison over time”. Indicators should be dynamic and account for changes in the system under study. Some studies of the water balance (Varela-Ortega et al., 2011; Collet et al., 2013; Milano et al., 2013a) included indicators that represent the ability of supply to meet demand (e.g., water demand sat-isfaction rates or supply reliability) and the level of anthro-pogenic pressures on water resources (e.g., withdrawal to re-source ratios). These indicators usually account for the aver-age water balance (Pulido-Velazquez et al., 2011). In some cases, statistical components are included in the analysis, such as the return period of undesirable events (Asefa et al., 2014).
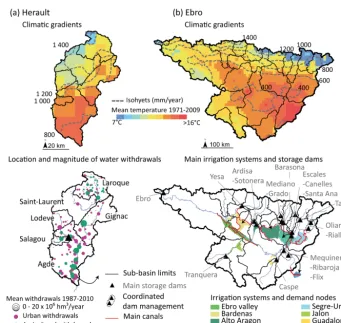
Figure 1. (a) The Hérault Basin (2500 km2, France) and the (b) Ebro Basin (85 000 km2, Spain): location of the main human pressures on water resources (urban and agricultural areas, main storage dams and water transfers).
delimited geographical entity) that fully incorporate the dif-ferent water uses and the influence that these uses may have on water resources, including storage and supply facilities. The need to better understand and represent interactions be-tween resources and demand and to account for the variabil-ity of anthropogenic and climatic drivers is particularly pro-nounced in the Mediterranean region, which faces significant climatic variability, rapid population growth and economic development, and increasing competition between different water uses (Milano et al., 2012, 2013b).
Before simulating changes in water demand satisfaction under prospective water use and climate scenarios, we need to show that the modeling approach used is able to rep-resent past variations in demand and availability, in space and over time. Also, giving historical context and explain-ing the past variations in water demand satisfaction can help us understand the vulnerability of hydrosystems to climatic and anthropogenic changes and design appropriate adapta-tion strategies. The aim of this study was thus to (i) com-bine socioeconomic and hydro-climatic data in an integrative modeling framework to represent water stress and its spa-tial and temporal variations over a past multi-decadal period, and (ii) use this framework and appropriate indicators to as-sess the sustainability of current water uses. The integrative modeling framework was developed and applied in two con-trasting Mediterranean catchments facing increasing climatic and anthropogenic pressures: the Hérault Basin (2500 km2, France) and the Ebro Basin (85 000 km2, Spain). This con-strains its conception to different spatial scales, stakes and water management issues (mainly population growth, irriga-tion and tourism for the Hérault Basin, and irrigairriga-tion for the Ebro Basin).
2 Study areas
2.1 Geographical context
The Hérault and the Ebro catchments differ in their geo-graphical characteristics. The Hérault Basin is located in the South of France (Fig. 1a). It is bordered in the north by the Cevennes Mountains. The Hérault River flows 150 km from Mont Aigoual (1565 m a.s.l.) in the north, through a crys-talline system of low permeability in the upstream part, a karstic system in the middle part, and an alluvial valley in the downstream part, into the Mediterranean Sea at the town of Agde.
The Ebro Basin is located in the north of Spain (Fig. 1b). The Ebro River flows 910 km in a northwest to southeast di-rection from Fontibre in the Cantabrian range (1027 m a.s.l.), to the town of Tortosa where it forms a large delta. It is bor-dered by the Pyrenean range (up to 3383 m a.s.l.) in the north, the Iberian range in the south and the Catalan coastal range in the east.
[image:3.612.129.470.64.256.2]respectively) were applied over 1000 m a.s.l.for the interpo-lation of TMAX andTMIN, based on observations from the 1969–2009 period (Dezetter et al., 2014). Since additional data for the calculation of Penman–Monteith ET0(e.g., wind and humidity) at the scale of the Ebro Basin from 1969 to 2009 were too scarce, the Hargreaves empirical equation (Hargreaves and Samani, 1985) was used to calculate ET0 at a daily time step. The calibration proposed by Martínez-Cob and Tejero-Juste (2004) in the Ebro Valley was applied to the whole basin using Eq. (1). Windy areas in the Ebro Basin were defined by García-Vera and Martínez-Cob (2004) based on available wind speed data. If a common formula in both basins were to be used, considering data availability it would have been based only on temperature (e.g., Oudin et al., 2005) and not necessarily adapted to agronomic stud-ies. Moreover, simulations of water demand and dam man-agement led to more realistic results with the Hargreaves formula than with the Oudin formula. Thus, we preferred to use the most accurate formula applicable in each basin rather than a common formula for both basins.
ET0=ω×(0.0864 Ra/λ)×(TMAX−TMIN)0.5
×(TMEAN+17.8), (1)
whereω=0.0023 in windy areas,ω=0.0020 otherwise, Ra is extraterrestrial radiation,λis latent heat flux,TMAXis max-imum daily temperature, TMIN is minimum daily tempera-ture, andTMEANis mean daily temperature.
Daily streamflow data were extracted from the French Ministry of Ecology and Sustainable Development’s database Banque Hydro (MEDDE, 2010) for the Hérault Basin and from the Anuario de aforos of the center of studies and experiments on hydraulic systems (CEDEX, 2012) for the Ebro Basin. Reservoir levels and outflow data were pro-vided by the General Council of the Hérault administrative region (Conseil Général de l’Hérault) and by the CEDEX for the Ebro Basin.
Population data were provided by national statistics insti-tutes (INSEE for France and INE for Spain), and information concerning irrigated areas and crop dynamics was extracted from agricultural censuses. The efficiency of water supply networks and of irrigation systems and data relating to unit water consumption and industrial activities were provided by the local water management agencies (adapted from CHE, 2013 and SMBFH, 2005).
2.3 Hydro-climatic context
The Hérault catchment is characterized by a Mediterranean climate influenced by the Cevennes Mountain range, with mild wet winters and hot dry summers. The average seasonal temperature in the period 1971–2009 ranged from 6◦C in the winter to 20◦C in the summer; average annual precip-itation was 1100 mm over the basin. Temperature and pre-cipitation follow a north-to-south gradient in the basin:
aver-age annual temperatures range from 8◦C in the north to over 15◦C in the south, and average precipitation ranges from over 1600 mm yr−1in the north to less than 600 mm yr−1in the south. Climatic conditions in the Ebro Basin are complex due to the contrasting influences of the Atlantic Ocean and the Mediterranean Sea and of the three mountain ranges, par-ticularly the Pyrenees (Vicente-Serrano and López-Moreno, 2006). Annual temperatures and precipitation range from 8◦C in the Pyrenees to 17◦C in the lower Ebro Valley and from over 2000 mm yr−1in the western Pyrenees to less than 400 mm yr−1in the semi-arid central Ebro Valley.
Mean annual streamflow was 36 m3s−1 (14 L s−1km−2) in the Hérault and 330 m3s−1(4 L s−1km−2) in the Ebro be-tween 1971 and 2009. The Hérault and its tributaries have a Mediterranean regime (severe low flows in summer and high flows in fall and winter with potentially severe floods in fall). Hydrological regimes in the Ebro Basin vary from nival to Mediterranean (Bejarano et al., 2010). Upstream sub-basins in the Pyrenean and the Cantabrian ranges produced an aver-age of 47 % of the Ebro Basin’s natural runoff between 1971 and 2009.
The period 1971–2009 comprises significant climate vari-ability: statistical breaks in temperature and discharge series were detected in both basins around the year 1980. Tempera-ture increased by 1◦C in both basins between 1971–1980 and 1981–2009 and discharge decreased by 41 and 37 % between 1971–1979 and 1980–2009 at the outlets of the Hérault and the Ebro basins, respectively. Although no statistically signif-icant break was detected, annual precipitation decreased by 10 % in the Hérault Basin and by 12 % in the Ebro Basin be-tween 1971–1980 and 1981–2009. Seasonal disparities were identified in the precipitation trends: while winter precipita-tion decreased by approximately 40 % between the two peri-ods in both basins, fall precipitation increased by 21 % over the Hérault Basin and by 12 % over the Ebro Basin. Similar hydro-climatic trends were detected by Collet et al. (2014) and Milano et al. (2013a) in the 1969–2010 and 1957–2002 periods in the Hérault and Ebro basins, respectively.
2.4 Water management issues
and August. Of the five dams in the basin with a total stor-age capacity of 8 % of total runoff (Fabre et al., 2014), the main one is the Salagou dam (102 hm3), built in 1968 to sup-ply water for irrigation but currently mostly used for recre-ational activities on the lake. The main irrigated areas are concentrated around the Gignac canal which distributes wa-ter from the Hérault River to an irrigated perimewa-ter of nearly 3000 ha. According to local stakeholders, until the 1990s the efficiency of the system barely reached 7 % but increased to 20 % in the late 2000s.
The Ebro is a complex and highly regulated hydrosystem with a total of 234 dams, amounting to a storage capacity of 60 % of total runoff (Fabre et al., 2014). Irrigated areas are concentrated in the semi-arid Ebro Valley and are sup-plied by a network of canals linked to large storage dams, most of which collect water from the Pyrenean Mountains. In 2007, agricultural water demand represented 92 % of the to-tal water demand (CHE, 2013). The Ebro Basin concentrates 60 % of Spain’s fruit production and 30 % of the country’s meat production (CHE, 2013). Agriculture in the basin con-tributes to a dynamic agro-industrial sector. Together with water demand for the open-air cooling systems of two nu-clear power plants, industrial water demand is similar to ur-ban water demand. The population density is mostly very low (under 10 inhab.km−2) except in a few urbanized areas such as Zaragoza or Pamplona. Transfers to cities outside the basin have been underway since 1927, the two main ones being ur-ban and industrial water transfers to Bilbao and Tarragona, underway since 1975 and 1989, respectively.
In both basins, hot dry conditions in summer lead to a peak in irrigation water demand associated with low flows. Since the 1970s, the population has doubled in the Hérault Basin and irrigated areas have increased by 30 % in the Ebro Basin. Increasing demand and drier conditions have led to water shortage events in both basins. The EU Water Framework Di-rective (European Commission, 2000), which applies to both basins, has also been the source of new constraints through the regulation of environmental flows. The Hérault Basin has been part of the territory managed by the Agence de l’eau Rhône-Méditerranée Corse since 1964. The Syndicat Mixte du Bassin du Fleuve Hérault (SMBFH) was created in the 2000s to ensure more local management and in response to issues that are specific to the Hérault Basin, including wa-ter availability (SMBFH, 2005). Studies on the balance be-tween water demand and availability have been launched by local authorities in the Hérault Basin and should lead to a wa-ter sharing plan for the basin. In contrast, the Confederación Hidrográfica del Ebro (CHE) was created in 1926 with the aim of increasing irrigation and water resource management in the Ebro Basin, with a strong emphasis on the develop-ment of the resource and of infrastructure. The CHE now has a wider role in water management, in line with integrated water resources management and water sustainability as a whole. Since the 2000s, efforts have been underway to im-prove network efficiency and increase demand management
(Lecina and Playán, 2002; Lecina et al., 2010; Salvador et al., 2011).
3 Method
3.1 Modeling approach used to assess the balance between water demand and availability 3.1.1 Integrative modeling framework
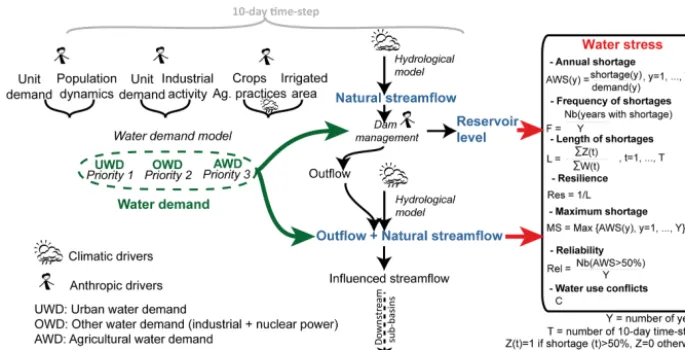
A modeling framework including hydro-climatic and anthro-pogenic dynamics and accounting for interactions between water resources and water demand at a 10-day time step was designed (Fig. 2). Climatic variability affects natural streamflow and water demand (mainly through crop irriga-tion requirements), while human activities affect water de-mand through population growth, industrial activity, irrigated areas and the types of irrigated crops, and the efficiency of the water supply networks. Water demand is defined as the amount of water that users would withdraw without re-strictions, i.e., the withdrawals that would enable users to have access to optimal amounts of water considering the effi-ciency of supply networks and irrigation techniques. Anthro-pogenic drivers of water balance include local water manage-ment rules through the operation of dams and canals, which affect water availability. These climatic and anthropogenic drivers were distributed and combined dynamically in space and over time to evaluate changes in water stress.
At each demand node, water demand is compared to water availability (based on streamflow and reservoir levels). If wa-ter availability is equal to or higher than wawa-ter demand, then water withdrawals are equal to water demand for all types of demand. If water availability is lower than water demand, then restrictions are applied to limit withdrawals. According to the order of priority defined locally, restrictions are first applied to agricultural water demand (AWD), then to other water demands (OWD) and lastly to urban water demand (UWD). Water shortage is calculated through the difference between water demand and effective water withdrawal. Only a part of the water withdrawn is actually used, the rest is considered to return to the sub-basin outlet as return flow. The quantification of consumptive use and return flows is ex-plained in Sect. 3.3.2. Natural streamflow is thus modified by dam management, water withdrawals and return flows.
Figure 2. General framework for the integrative modeling chain developed and applied to the Hérault and the Ebro basins at a 10-day time step over the 1971–2009 period. Water demand and natural streamflow were simulated based on climatic and anthropogenic drivers. Anthropogenic influence on streamflow was assessed through the simulation of demand-driven dam management and consumptive use. Water stress was assessed by comparing demand to availability and characterized through the use of indicators.
against observed streamflow data at each resource node (see Sect. 3.3.2.).
3.1.2 Mapping resource and demand management The spatial distribution of water demand and availability was mapped to correctly reproduce the spatial heterogeneity of water shortage in each study area: water stress assessments can vary depending on the spatial or temporal scale (Boithias et al., 2014). Thus, it is essential to properly account for the main heterogeneities in water demand and availability. Each basin was divided into sub-basins accounting for the water supply to one or more demand nodes. The Hérault Basin was divided into 6 sections and the Ebro into 20 (Fig. 3).
The map of the Hérault hydrosystem (Fig. 3a) was adapted from the work of Collet et al. (2013). It accounted for the north-south climatic gradient separating the milder wet-ter upstream catchments from the warmer drier area down-stream. Sub-basins were chosen based on their similar water withdrawal characteristics. Water withdrawals are low and mostly agricultural in the Laroque sub-basin, and minimal in the upstream sub-basins of the Saint-Laurent and Lodève. The sub-basin of the Hérault at Gignac was delimited to iso-late the Gignac canal and its irrigated areas. The southern section of the Hérault Basin (Agde) has both the highest ur-ban withdrawals in the basin and a high level of agricultural water demand.
Mapping the Ebro hydrosystem was mainly guided by the existence of extensive irrigation systems managed in associ-ation with large storage dams (see black triangles in Fig. 3b). The Pyrenean catchments influenced by a snowmelt hydro-logical regime were selected to accurately represent the cor-responding freshwater availability. The two main right bank systems were also selected, as they are representative of the
heterogeneous climatic and hydrological conditions in the Ebro Basin.
3.2 Simulation of water demand and natural streamflow
3.2.1 Modeling spatial and temporal variations in water demand
Three types of water demand were considered: (i) UWD, in-cluding domestic water consumption, irrigation of parks and gardens and commercial water use, (ii) AWD for crop irri-gation, and (iii) OWD linked to industrial processes and to power plant cooling systems. Details concerning the recon-stitution of past water demand at the sub-basin scale in the Hérault and the Ebro basins between 1971 and 2009 can be found in Grouillet et al. (2015).
The UWD of each municipality was assessed by multi-plying a unit water allocation per capita by the population at each 10-day time step. Unit water allocations were calculated from available urban water withdrawal and population data. These allocations depend on the water consumption rates of urban activities and on the efficiency of water supply net-works, and were assumed to remain stable throughout the study period. Annual variations in population over time were taken into account, as were the seasonal dynamics due to summer tourism in the Hérault Basin.
Figure 3. Maps of the main physical and human spatial characteristics of the two basins: (a) 6 sections were selected for simulation of water resources and water demand nodes in the Hérault Basin; (b) 20 sections for simulation of water resources and 8 demand nodes that matched the main irrigation systems were selected in the Ebro Basin.
[image:7.612.149.446.442.677.2]were extracted from the European soil database (European Commission, 2004) and averaged over each sub-basin.
OWD was not taken into account in the Hérault Basin because of the very limited industrial activity. In the Ebro Basin, industrial demand was estimated by the CHE (2013) at the municipality scale by assigning water allocation per employee and per year for each industrial sector. Energy de-mand in the Ebro Basin was assumed to correspond to the volume of water evaporated by the open-air cooling system of the nuclear reactors. Hydropower demand was not ac-counted for in this study as data for our two study areas were scarce. Moreover, in the Hérault Basin, the production of hy-dropower is limited to a few minor turbines, while in the Ebro Basin dams are operated primarily to satisfy agricultural wa-ter demand.
3.2.2 Modeling spatial and temporal variations in natural streamflow
Streamflow was modeled in the 6 sub-basins in the Hérault and the 20 sub-basins in the Ebro using GR4j (Perrin et al., 2003), a conceptual hydrological model run at a daily time step and calibrated/validated at a 10-day time step. The hy-drological model relies on precipitation (P) and potential evapotranspiration (ET0) inputs. It simulates streamflow via a production function (which determines effective precipita-tion, filling a production reservoir) and a routing function. A snow module based on mean basin temperature (Ruelland et al., 2011, 2014) was added and activated in the sub-basins with a snowmelt regime. GR4j relies on four parameters, and the snow module adds three more parameters. The model was calibrated using the drier period (1981–2009) and val-idated using the wetter period (1971–1980). Automatic cibration of the model was performed using a three-step al-gorithm as described in Dezetter et al. (2014). It combined a random draw of parameter sets and the succession of Rosen-brock and simplex algorithms aimed at minimizing a multi-objective function (Fagg) aggregating three goodness-of-fit criteria: the Nash–Sutcliffe efficiency index (NSE), the cu-mulative volume error (VE) and the mean annual volume error (VEM). NSE values were considered good when they were above 0.65, satisfactory when between 0.5 and 0.65, and poor when they were under 0.5.
To assess natural runoff in each sub-basin, the model was calibrated only against runoff data that were considered to be natural, i.e., not influenced by withdrawals or dam manage-ment. Withdrawals upstream from the Pyrenean dams were considered to be negligible, so all streamflow data were used for calibration. Data on discharge entering the dams were not directly available, so streamflow upstream from the dams was computed based on a balance between inflow, variations in the reservoir level, outflow, and evaporation. Runoff pro-duced in each downstream sub-basin was computed at a 10-day time step by subtracting the ingoing streamflow from the streamflow at the outlet of the section. However, these
downstream sections are also strongly influenced by water withdrawals, and natural streamflow could not be calculated based on observed streamflow and water withdrawal data because withdrawal data were not available with the ade-quate time step and time depth. Thus, assumptions had to be made in order to evaluate when streamflow was natural, i.e., not modified by consumptive use. Since AWD was con-sidered to have the highest consumptive use, we assumed that when negligible AWD was simulated, then consumptive use was negligible and flows were considered natural. Thus, the time steps for which simulated agricultural demand was greater than 0.1 hm310 days−1were not used to calculate the goodness-of-fit criteria. In the downstream sections, the 10-day periods left out of the calibration data correspond to low flow periods. Consequently, the calibration did not include the effect of withdrawals and consumptive use, which are most relevant under low flow conditions. The simulation of streamflow influenced by reservoir operations and consump-tive use was validated against observed data in a later step (see Sect. 3.3.2).
3.3 Comparing resource and demand considering water management rules
3.3.1 Modeling dam management
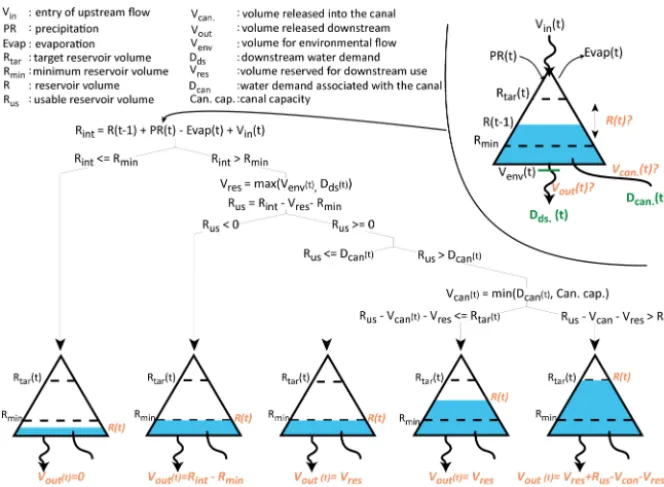
Accurate simulation of dam management is essential for sim-ulations of water availability in highly equipped hydrosys-tems. A demand-driven dam management model adapted from Fujihara et al. (2008) was set up and applied to the Salagou dam in the Hérault Basin and to 11 major dams or groups of dams in the Ebro Basin (see Fig. 3). The model outputs were the reservoir level, the volume of water re-leased into associated canals (if applicable) and into the river downstream from the dam during each 10-day time step. In the Ebro Basin, reservoirs managed for the supply of irriga-tion systems are managed with target and minimum levels. In most cases target levels vary throughout the year and the minimum level is fixed and corresponds to a safety reserve of the level of a canal inlet. Water is released to satisfy the demand as long as the reservoir level is above the minimum level. These basic management rules were used to design the dam management model.
ini-Figure 5. Demand-driven dam management model. The reservoir level (R) and volumes released downstream (Vout) and into the canal (Vcanal, if applicable) were calculated at a 10-day time stept.
tial reservoir level, water can be released to satisfy demand and/or minimum flow requirements as long as the reservoir level remains above the defined minimum levelRmin; (ii) if the reservoir exceeds the target levelRtar, additional water is released from the dam into the river downstream.
Target levels were defined for each 10-day time step ac-cording to maximum observed levels over a given time pe-riod in which the dam operation rules were similar. Changes in dam operation rules were accounted for throughout the study period. Data on the reservoir level of the Ebro dam, for example, revealed a change in reservoir level variability after 1980; so, target levels were defined separately for the periods 1971–1980 and 1981–2009. Minimum levels were provided by the stakeholders in charge of dam operations or, if the in-formation was not available, were defined as the minimum level observed over the period. The minimum levels of the reservoirs are kept as a safety reserve for a particular water use (e.g., 100 hm3in the Ebro dam are kept as a safety wa-ter supply to the city of Zaragoza) or to maintain reservoir levels above the elevation of a canal inlet (e.g., elevation of the Aragon and Catalunya canal inlet in the Barasona dam). In the case of the Salagou dam in the Hérault Basin, a mini-mum elevation of 137 m a.s.l.is maintained to enable tourist recreational activities on the lake.
Because dam management rules are driven by the demand associated with each individual dam, simulation of dam oper-ations is highly dependent on accurate mapping of resources and demand. In the Hérault Basin, the Salagou dam supplies water for irrigation in a clearly delimited area (Fig. 1a). In
[image:9.612.131.463.66.309.2]3.3.2 Modeling the influence of water uses on streamflow
At each time step, water withdrawals were evaluated ac-cording to water availability, simulated water demand, and the following order of priority: (i) UWD (ii) OWD and (iii) AWD. Return flows were also taken into account. For each type of water demand, a part of the water withdrawn was considered to return to the environment and, in fine, to the streamflow at the outlet of the sub-basin in which the wa-ter was pumped. For UWD, two types of return flows were considered. First, 80 % of the volume actually supplied to domestic and more generally urban users was considered to return to the sub-basin outlet as treated effluent. The volume actually supplied was calculated by subtracting losses from the supply network from withdrawals. Second, part of the losses from supply networks was considered to return to the sub-basin outlet. For OWD, 80 % of withdrawn water was considered to return to the sub-basin outlet. For AWD, only part of the losses from supply networks was considered to return to the sub-basin outlet. All the water actually available for crop irrigation was considered to be used by the crops (i.e., consumptive use).
The return flow rate from losses from urban and irrigation supply networks was estimated for the Hérault Basin as a whole, and for each sub-basin of the Ebro Basin, to account for soil and geological heterogeneities. Return flow rates were tested from 0 to 1 with a step of 0.1 and were calibrated by optimizing goodness-of-fit criteria including NSE on low flows (July–September included), noted NSELF, on modified runoff. The calculation of these criteria also allowed validat-ing the whole run of the integrative model. Therefore, al-though the hydrological model was not calibrated over low flows (see Sect. 3.2.2) we validated the simulations of influ-enced streamflow, including over low flows.
3.3.3 Sustainability indicators for the balance between water demand and availability
First, anthropogenic and climatic pressures on water re-sources were assessed. Anthropogenic impacts on stream-flow, i.e., consumptive use, were estimated as the difference between natural and modified streamflow. The part of natural streamflow and anthropogenic consumptive use variations in the cause of the decrease in streamflow observed was evalu-ated by comparing variations in simulevalu-ated natural and influ-enced streamflow.
Second, water shortage for each type of demand was char-acterized by the magnitude, frequency, and average length of withdrawal restrictions (see Fig. 2). These indicators were calculated for each demand node considering hydro-climatic and anthropic variability between 1971 and 2009. The per-centage of water demand that could not be satisfied due to lack of available water was computed for each type of de-mand at a 10-day time step. According to the local
stake-holders, withdrawal restrictions were acceptable as long as they did not exceed 50 % of AWD and 5 % of UWD. Wa-ter shortage analysis concentrated mostly on agricultural de-mand since it was last in order of priority (Fig. 2). The fre-quency of withdrawal restrictions (F) was expressed by the number of years out of 5 including at least one time-step in which restrictions on irrigation water withdrawals exceeded 50 % of the demand. The average length of a water shortage (L) was represented by the average number of consecutive time steps with restrictions exceeding 50 % of the demand. Years with urban water shortage exceeding 5 % of the de-mand during at least one 10-day time step were also identi-fied. These years corresponded to critical situations in which withdrawal restrictions also applied to non-agricultural users, pointing to potential water sharing conflicts (C). When re-strictions are applied to urban water withdrawals, it means that all three types of demands faced water shortage.
indica-J. Fabre et al.: Simulating past changes 1273
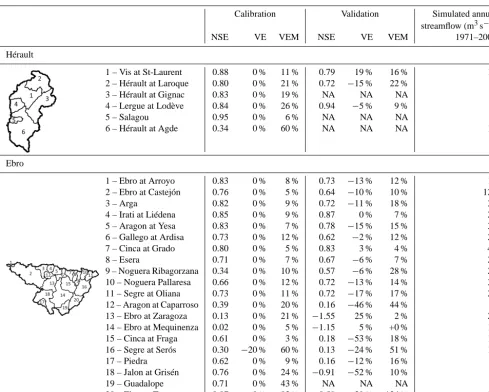
Table 1. Calibration and validation results of the simulation of natural streamflow in the Hérault and the Ebro basins. Optimal values of NSE, VE and VEM are 1, 0 and 0, respectively.
Calibration Validation Simulated annual streamflow (m3s−1)
NSE VE VEM NSE VE VEM 1971–2009
Hérault
Table 1.Calibration and validation results of the simulation of natural streamflow in the Herault and the Ebro
basins. Optimal values of NSE, VE and VEM are 1, 0 and 0 respectively.
Calibration Validation Simulated annual
streamflow (m3/s )
NSE VE VEM NSE VE VEM 1971–2009
Herault
1-Vis at St-Laurent 0.88 0% 11% 0.79 19% 16% 10
2-Herault at Laroque 0.80 0% 21% 0.72 -15% 22% 9
3-Herault at Gignac 0.83 0% 19% NA NA NA 8
4-Lergue at Lodeve 0.84 0% 26% 0.94 -5% 9% 4
5-Salagou 0.95 0% 6% NA NA NA 1
6-Herault at Agde 0.34 0% 60% NA NA NA 11
Ebro
1-Ebro at Arroyo 0.83 0% 8% 0.73 -13% 12% 10
2-Ebro at Castejon 0.76 0% 5% 0.64 -10% 10% 123
3-Arga 0.82 0% 9% 0.72 -11% 18% 38
4-Irati at Liedena 0.85 0% 9% 0.87 0% 7% 29
5-Aragon at Yesa 0.83 0% 7% 0.78 -15% 15% 38
6-Gallego at Ardisa 0.73 0% 12% 0.62 -2% 12% 25
7-Cinca at Grado 0.80 0% 5% 0.83 3% 4% 42
8-Esera 0.71 0% 7% 0.67 -6% 7% 21
9-Noguera Ribagorzana 0.34 0% 10% 0.57 -6% 28% 20
10-Noguera Pallaresa 0.66 0% 12% 0.72 -13% 14% 31
11-Segre at Oliana 0.73 0% 11% 0.72 -17% 17% 26
12-Aragon at Caparroso 0.39 0% 20% 0.16 -46% 44% 6
13-Ebro at Zaragoza 0.13 0% 21% -1.55 25% 2% 28
14-Ebro at Mequinenza 0.02 0% 5% -1.15 5% +0% 13
15-Cinca at Fraga 0.61 0% 3% 0.18 -53% 18% 13
16-Segre at Seros 0.30 -20% 60% 0.13 -24% 51% 11
17-Piedra 0.62 0% 9% 0.16 -12% 16% 3
18-Jalon en Grisen 0.76 0% 24% -0.91 -52% 10% 4
19-Guadalope 0.71 0% 43% NA NA NA 2
20-Ebro at Tortosa 0.07 0% 83% -0.59 39% 124% 30
30
1 – Vis at St-Laurent 0.88 0 % 11 % 0.79 19 % 16 % 10
2 – Hérault at Laroque 0.80 0 % 21 % 0.72 −15 % 22 % 9
3 – Hérault at Gignac 0.83 0 % 19 % NA NA NA 8
4 – Lergue at Lodève 0.84 0 % 26 % 0.94 −5 % 9 % 4
5 – Salagou 0.95 0 % 6 % NA NA NA 1
6 – Hérault at Agde 0.34 0 % 60 % NA NA NA 11
Ebro
basins. Optimal values of NSE, VE and VEM are 1, 0 and 0 respectively.
Calibration Validation Simulated annual
streamflow (m3/s )
NSE VE VEM NSE VE VEM 1971–2009
Herault
1-Vis at St-Laurent 0.88 0% 11% 0.79 19% 16% 10
2-Herault at Laroque 0.80 0% 21% 0.72 -15% 22% 9
3-Herault at Gignac 0.83 0% 19% NA NA NA 8
4-Lergue at Lodeve 0.84 0% 26% 0.94 -5% 9% 4
5-Salagou 0.95 0% 6% NA NA NA 1
6-Herault at Agde 0.34 0% 60% NA NA NA 11
Ebro
1-Ebro at Arroyo 0.83 0% 8% 0.73 -13% 12% 10
2-Ebro at Castejon 0.76 0% 5% 0.64 -10% 10% 123
3-Arga 0.82 0% 9% 0.72 -11% 18% 38
4-Irati at Liedena 0.85 0% 9% 0.87 0% 7% 29
5-Aragon at Yesa 0.83 0% 7% 0.78 -15% 15% 38
6-Gallego at Ardisa 0.73 0% 12% 0.62 -2% 12% 25
7-Cinca at Grado 0.80 0% 5% 0.83 3% 4% 42
8-Esera 0.71 0% 7% 0.67 -6% 7% 21
9-Noguera Ribagorzana 0.34 0% 10% 0.57 -6% 28% 20
10-Noguera Pallaresa 0.66 0% 12% 0.72 -13% 14% 31
11-Segre at Oliana 0.73 0% 11% 0.72 -17% 17% 26
12-Aragon at Caparroso 0.39 0% 20% 0.16 -46% 44% 6
13-Ebro at Zaragoza 0.13 0% 21% -1.55 25% 2% 28
14-Ebro at Mequinenza 0.02 0% 5% -1.15 5% +0% 13
15-Cinca at Fraga 0.61 0% 3% 0.18 -53% 18% 13
16-Segre at Seros 0.30 -20% 60% 0.13 -24% 51% 11
17-Piedra 0.62 0% 9% 0.16 -12% 16% 3
18-Jalon en Grisen 0.76 0% 24% -0.91 -52% 10% 4
19-Guadalope 0.71 0% 43% NA NA NA 2
20-Ebro at Tortosa 0.07 0% 83% -0.59 39% 124% 30
30
1 – Ebro at Arroyo 0.83 0 % 8 % 0.73 −13 % 12 % 10
2 – Ebro at Castejón 0.76 0 % 5 % 0.64 −10 % 10 % 123
3 – Arga 0.82 0 % 9 % 0.72 −11 % 18 % 38
4 – Irati at Liédena 0.85 0 % 9 % 0.87 0 % 7 % 29
5 – Aragon at Yesa 0.83 0 % 7 % 0.78 −15 % 15 % 38
6 – Gallego at Ardisa 0.73 0 % 12 % 0.62 −2 % 12 % 25
7 – Cinca at Grado 0.80 0 % 5 % 0.83 3 % 4 % 42
8 – Esera 0.71 0 % 7 % 0.67 −6 % 7 % 21
9 – Noguera Ribagorzana 0.34 0 % 10 % 0.57 −6 % 28 % 20
10 – Noguera Pallaresa 0.66 0 % 12 % 0.72 −13 % 14 % 31
11 – Segre at Oliana 0.73 0 % 11 % 0.72 −17 % 17 % 26
12 – Aragon at Caparroso 0.39 0 % 20 % 0.16 −46 % 44 % 6
13 – Ebro at Zaragoza 0.13 0 % 21 % −1.55 25 % 2 % 28
14 – Ebro at Mequinenza 0.02 0 % 5 % −1.15 5 % +0 % 13
15 – Cinca at Fraga 0.61 0 % 3 % 0.18 −53 % 18 % 13
16 – Segre at Serós 0.30 −20 % 60 % 0.13 −24 % 51 % 11
17 – Piedra 0.62 0 % 9 % 0.16 −12 % 16 % 3
18 – Jalon at Grisén 0.76 0 % 24 % −0.91 −52 % 10 % 4
19 – Guadalope 0.71 0 % 43 % NA NA NA 2
20 – Ebro at Tortosa 0.07 0 % 83 % −0.59 39 % 124 % 30
tor, an acceptable range of values was defined according to management criteria in the local basin agencies.
4 Results
4.1 Efficiency of the modeling chain 4.1.1 Simulation of natural streamflow
Calibration and validation results for the simulation of nat-ural streamflow are presented in Table 1. Overall, the re-sults were satisfactory except for some downstream sections in which discharge was significantly modified and few cali-bration data were consequently available on natural stream-flow. However, the sub-basins where the model performed poorly generally produced only a small proportion of total discharge.
In the Hérault Basin NSE values were over 0.80 and vol-ume error (VE) was negligible over the calibration period in all sub-basins except in the Agde section. In the upstream Saint-Laurent and Laroque sub-basins, NSE values over the validation period were slightly lower (0.79 and 0.72, respec-tively), and volume errors tended to increase slightly. The lack of observed streamflow in the 1970s in the Gignac, Salagou and Agde sub-basins prevented validation of natu-ral streamflow simulations in these areas.
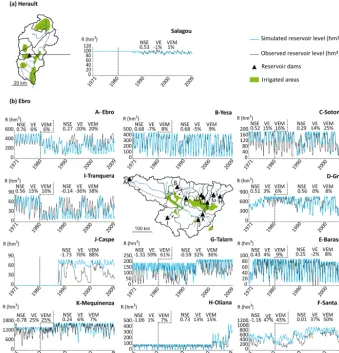
Figure 6. Simulated and observed reservoir levels (R) of the main dams in (a) the Hérault Basin and (b) the Ebro Basin. Results for the periods over which simulations of natural streamflow were calibrated (1981–2009) and validated (1971–1980) are marked with a grey dotted line. Optimal values of NSE, VE and VEM are 1, 0 and 0, respectively.
Ana dam. In this sub-basin the three dams (Escales, Canelles and Santa Ana) were simulated as one large dam in the loca-tion of Santa Ana (see Sect. 3.3.1), thus, multiplying possible errors in the calculation of the natural discharge at Santa Ana. In sub-basins 13, 14 and 20 (Ebro at Zaragoza, Mequinenza and Tortosa; see Table 1) results indicated poor calibration and validation scores. This can be explained by the high level of influence of withdrawals on streamflow, leaving very few data for calibration. The simulation of natural streamflow in these three sub-basins of the semi-arid Ebro Valley was thus considered to be unreliable. However, the climatic and to-pographic conditions of the middle and lower Ebro Valley suggest that the contribution of these areas to total discharge is minor. For the rest of the study, the contributions of sub-basins 13, 14 and 20 to the natural discharge of the Ebro River were set to zero.
4.1.2 Simulation of dam management
Figure 6 shows the simulated reservoir levels in comparison with observed reservoir levels. Seasonal dam operations were well represented for the majority of dams. Moreover, sim-ulated interannual variations of the reservoir levels were in good agreement with observations (e.g., the Ebro, Sotonera or Tranquera dams). Despite the complexity of their manage-ment, the reservoir levels of the Yesa and Grado dams were satisfactorily simulated, with NSE values of 0.68 and 0.56, respectively, and mean volume errors of 9 and 8 %.
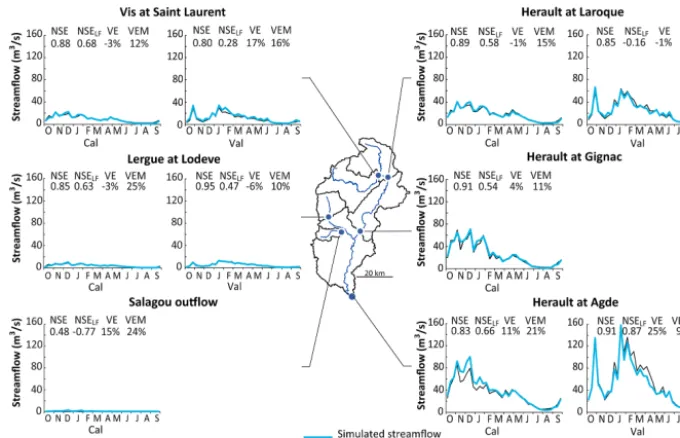
Figure 7. Simulation of influenced streamflow in the Hérault Basin from 1971 to 2009: results for the periods over which simulations of natural streamflow were calibrated (Cal: 1981–2009) and validated (Val: 1971–1980). Optimal values of NSE, NSELF, VE, and VEM are 1, 1, 0 and 0, respectively.
4.1.3 Simulation of influenced streamflow
Influenced streamflow was accurately simulated in the Hérault Basin (see Fig. 7) with NSE values above 0.80 in all sub-basins for the calibration and validation periods, except at the outlet of the Salagou dam where the outflow was only moderately well simulated by the dam management model. However, the contribution of the Salagou dam to streamflow at the outlet of the basin is very low.
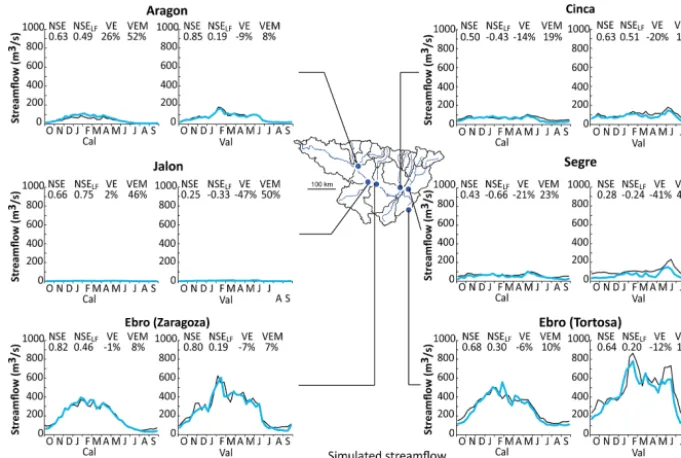
Results at the outlet of the Ebro Basin (see Fig. 8) showed that the influenced discharge in this complex hydrosystem was well simulated: aggregated simulations at the basin out-let led to NSE and volume error scores of 0.68 and −6 %, respectively, over the calibration period, and of 0.64 and −12 % over the validation period. The influenced discharge in the Cinca and Segre systems was poorly reproduced, with NSE values under 0.50 and negative low flow NSE (NSELF, see Sect. 3.3.2) values over the calibration period. Stream-flow in the downstream Segre sub-basin is influenced by out-flows from the Santa Ana, Talarn and Oliana dams, which have complex management rules.
The ability to represent observed low flows, which are highly influenced by storage and water withdrawals, is an indicator of the modeling chain’s efficiency. Low flows were well simulated at the outlet of the Hérault Basin (Hérault at Agde) with NSELFvalues of 0.66 and 0.87 over the 1981– 2009 and 1971–1980 periods, respectively. The low NSELF values in the Vis at Saint-Laurent and Hérault at Laroque sub-basins over the 1971–1980 period (0.28 and−0.16), re-spectively, are most likely due to difficulties of the hydrolog-ical model to reproduce the functioning of the karstic system
in wet periods, as it was calibrated over a drier period. Low flows in some of the Ebro sub-basins were poorly simulated, particularly in the Cinca and Segre sub-basins, where low flows are highly influenced and depend almost exclusively on the outflow from the various storage dams.
4.2 Analysis of the causes of past changes in observed streamflow
4.2.1 Variations in water demand under anthropogenic and climate variability
Total water demand in the Hérault Basin doubled between the 1970s (24 hm3yr−1) and the 2000s (53 hm3yr−1) mainly because of a significant increase in UWD (from 18 hm3yr−1 in the 1970s to 36 hm3yr−1 in the 2000s over the whole basin), particularly for the Florensac transfer in the Agde section where UWD more than doubled (see Fig. 10a). To-tal AWD also increased (from 6 to 17 hm3yr−1between the 1970s and the 2000s) with heterogeneities throughout the basin. In the Laroque upstream section, AWD decreased in the 1990s due to agricultural decline and stabilized in the 2000s. In the other upstream sections, AWD increased sig-nificantly, but volumes nevertheless remained very low. The simulated increase in AWD over the Hérault Basin is mostly due to warmer and drier conditions from the 1980s on, which led to a threefold increase in AWD in the Gignac area (see Fig. 10a).
Figure 8. Simulation of influenced streamflow in the Ebro Basin from 1971 to 2009: results for the periods over which simulations of natural streamflow were calibrated (Cal: 1981–2009) and validated (Val: 1971–1980). Optimal values of NSE, NSELF, VE, and VEM are 1, 1, 0 and 0, respectively.
shown in Fig. 10b, the main increase in AWD occurred in the Bardenas and Alto Aragon irrigation systems (from 400 to 880 hm3yr−1and from 320 to 950 hm3yr−1, respec-tively, between the 1970s and the 2000s). In the Ebro Valley, Aragon and Catalunya and Segre systems, AWD increased between the 1970s and the 1980s and stabilized (or even slightly decreased in the case of the Ebro Valley) after 1990. On the right bank, AWD remained almost unchanged, with a peak in the 1980s in the Jalon sub-basin.
4.2.2 Impact of climatic variability on natural streamflow
Simulated changes in natural streamflow at the outlet of the Hérault and the Ebro basins are illustrated in Fig. 9. The 1980s and 2000s appear to have been particularly dry com-pared to the 1970s and the 1990s, mainly in the Hérault Basin. In both basins, simulated natural streamflow de-creased by approximately 20 % between 1971–1980 and 1981–2009.
At Agde, the natural streamflow of the Hérault River de-creased in the winter, spring and summer (−52, −30 and −39 %, respectively) and increased in the fall (+36 %). Sim-ilar changes were observed in upstream sections, with a big-ger decrease in the streamflow in summer at Laroque and Gignac (−47 and−48 %, respectively). The natural stream-flow of the Ebro River at Tortosa also decreased in the win-ter, spring and summer (−21,−29 and−23 %, respectively) and increased slightly (+8 %) in the fall. In sub-basins in-fluenced by a snowmelt regime such as the Cinca and Segre
catchments, peak flow occurred 1 month earlier (May instead of June) after 1980, and streamflow decreased in spring and summer.
The changes in natural streamflow simulated in both basins are in agreement with the climatic trends described in Sect. 2.3., i.e., a decrease in winter precipitation and an increase in fall precipitation between 1971–1980 and 1981– 2009, associated with a 1◦C annual increase in temperature.
4.2.3 Relative impact of anthropogenic and climatic drivers on streamflow
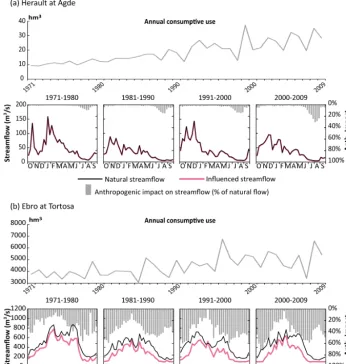
Figure 9 also shows that the consumptive use increased be-tween 1971 and 2009 in both basins, in absolute terms and relative to natural streamflow: average annual consumptive use increased from 11 hm3yr−1(1 % of mean annual natural streamflow) in the 1970s to 27 hm3yr−1(2 % of mean annual natural streamflow) in the 2000s in the Hérault Basin, and from 3 830 hm3yr−1(24 % of mean annual natural stream-flow) in the 1970s to 5000 hm3yr−1(38 % of mean annual natural streamflow) in the 2000s in the Ebro Basin. Annual water consumption stabilized in the 2000s in both basins.
In the Hérault Basin the impact of water use was high-est in the summer: it reached 30 % of natural flow between mid-July and mid-August in the 2000s (Fig. 9a). In the Ebro Basin the storage role of reservoirs is clearly visible, with anthropogenic impacts decreasing in July and August, when withdrawals were made from reservoirs (Fig. 9b).
con-Figure 9. Comparison of natural vs. influenced simulated streamflow: anthropogenic impacts (consumptive use and water storage) on (a) the Hérault River and on (b) the Ebro River.
sumptive use variations. In the upstream sections of the Hérault Basin (Saint-Laurent, Laroque and Lodève, data not shown) the decrease in streamflow between 1971–1980 and 1981–2009 was linked to a natural decrease in streamflow only, whereas in Gignac and Agde, respectively, 1 and 3 % of the decrease in annual influenced streamflow was linked to an increase in consumptive use. Simulations linked 80 % of the decrease in influenced discharge at the outlet of the Ebro Basin between 1971–1980 and 1981–2009 to a decrease in natural discharge, and 20 % to the increase in consumptive use. These proportions varied throughout the basin: 75–25 % in the Aragon sub-basin, 50–50 % in the Cinca sub-basin and a decrease in consumptive use in the Segre sub-basin.
4.3 Analysis of the balance between water demand and availability
4.3.1 Simulation of water shortages over the period 1971–2009
[image:15.612.128.475.70.435.2]Figure 10. Frequency and intensity of agricultural and urban water shortage in the period 1971–2009 considering the spatial and temporal dynamics of water uses and hydro-climatic conditions (a) in the Hérault Basin and (b) in the Ebro Basin.
results are consistent with the information provided by lo-cal stakeholders on the occurrence of water supply problems in the Hérault Basin in the past 40 years: the main stakes concerning the supply of agricultural water are concentrated around the Gignac canal, while user conflicts may appear in the downstream area of Agde. The year 2005 was indeed no-table for tensions around water resources, with strict regu-lations concerning the use of water and special negotiations that led to the release of additional water from the Salagou dam to compensate for low flows in the Hérault River.
Figure 10b shows the results of the simulation of wa-ter shortage for the eight main management systems in the Ebro Basin. The systems on the right bank are very exposed to water shortage, particularly the Guadalope sub-basin. Al-though some agricultural water withdrawal restrictions may have been applied in all areas except the lower Ebro, be-tween 1971 and 2009, only the Ebro Valley, Bardenas and Alto Aragon areas faced shortages exceeding 50 % of de-mand. In the case of the Bardenas irrigation system, the in-crease in water shortage mirrored an inin-crease in water de-mand. The storage capacity of the Yesa dam is currently be-ing increased by about 600 hm3. In the Alto Aragon system, the Sotonera and Grado dams have been managed together since 1982, which helped improve the balance between wa-ter demand and availability despite a significant increase in demand (from 320 to 950 hm3yr−1between the 1970s and
the 2000s). However, agricultural water shortage periods did occur in the 2000s. The construction of new storage facilities to increase the storage capacity by about 400 hm3is planned in this area.
4.3.2 Sustainability of current water uses in the hydro-climatic conditions of the recent past
Figure 11. Frequency and intensity of agricultural and urban water shortage under current water uses (2009) and hydro-climatic conditions in the period 1971–2009 (a) in the Hérault Basin and (b) in the Ebro Basin.
According to the results shown in Fig. 12, the Aragon and Catalunya, Ebro Valley, Segre–Urgel and lower Ebro sections in the Ebro Basin appear to have found a sustainable balance between water use and availability if climatic conditions re-main in the range of variability as that observed in the recent past. Comparison of Figs. 10b and 11b shows an improve-ment in the water balance in the Segre–Urgel irrigation sys-tem due to the construction of the Rialb dam in the early 2000s, which was added to the storage capacity of the Oliana dam. The combined operation of the two dams reduces an-nual agricultural water shortage rates (Fig. 11b) compared to the Oliana dam without the additional storage capacity of Ri-alb (Fig. 10b). On the other hand, the expansion of irrigated areas in the Bardenas and Alto Aragon systems appears to have contributed to the increase in water stress revealed in Fig. 10b. Figure 11b shows that the current uses of water in the Bardenas system would not match water availability in the hydro-climatic conditions of the recent past. With its cur-rent water use and water management and under unchanged climate variability, in the future, this area could face many long severe shortage events (MS=75 % and Res=0.2), even though, generally speaking, the system can still be consid-ered to be reliable since years with a total deficit of over 50 % occur in our simulations less frequently than once ev-ery 5 years (see Fig. 12). Finally, the Jalon and Guadalope ar-eas appear to be particularly unbalanced (see Fig. 12), even
though no conflicts between users have arisen in the Jalon (C=0) due to very low UWD.
5 Discussion and conclusion 5.1 Outcome
sig-Figure 12. Sustainability of current water uses (2009) under the hydro-climatic conditions of the recent past (1971–2009) for (a) the Hérault and (b) the Ebro basins: frequency of agricultural water shortage (F) and of water use conflicts (C) in years out of 5 years, resilience (Res), maximum agricultural water shortage (MS), and reliability (Rel) at the main demand nodes of each catchment. Only demand nodes with at least one non-null indicator value are represented in the radar charts.
nificant water use and climate variability. Second, the simu-lations enabled us to understand the relative influence of an-thropogenic and climatic pressures on water stress and, thus, provided knowledge on the processes leading to water stress, which was not available through simple data analysis.
The modeling framework was validated by comparing simulated reservoir levels and influenced streamflow with observed data over a nearly 40-year period. Influenced streamflow was represented by accounting for the significant variability of water use and climate during the period, and by properly simulating anthropogenic pressures on water re-sources (i.e., water withdrawals, consumptive use and dam management). A combination of socioeconomic and hydro-climatic data based primarily on the mapping of resource and demand nodes enabled us to account for heterogeneities in water use and management practices in the two basins. The main heterogeneities in resource availability were identified by isolating the catchments that contributed most to runoff in the Hérault Basin and the catchments with a snowmelt hydro-logical regime in the Ebro Basin, and by defining the dams most important for the satisfaction of water demands. Also, local water management was taken into account and the de-mand nodes in our study represent actual management units, a scale at which water allocations are discussed.
To our knowledge, other studies did not simulate natural and influenced streamflow at the mesoscale and over this long period, and did not achieve a historical reconstruction of water demand and the influence of water use on streamflow over such a long period. Lanini et al. (2004) designed an inte-grated model of the Hérault socio-hydrosystem, with detailed accounts of hydrogeological processes and decisions on wa-ter use. However, this model was calibrated and validated over a short period and only covers an area of approximately
100 km2in the Hérault Valley. Collet et al. (2013) success-fully modeled influenced streamflow with simulations of wa-ter demand satisfaction and consumptive use; however, the hydrological model was calibrated using observed stream-flow data, i.e., influenced streamstream-flow. In the Ebro Basin, some studies such as López-Moreno et al. (2014) success-fully simulated natural streamflow in snowmelt sub-basins, and demand-driven dam management, although with water demand assumed constant from 1 year to another and there-fore an incomplete integration of drivers of water stress. Fi-nally, Milano et al. (2013a) proposed a representation of wa-ter stress over the whole Ebro Basin, accounting for three storage dams and with a simulation of natural streamflow. However, the natural streamflow data used for calibration of the hydrological model in this case were based on outputs from another model, and the hydrological model did not ac-count for snowmelt’s influence on runoff. Moreover, water stress was assessed at a monthly time step, and water demand was considered constant over a 20-year period.
[image:18.612.128.469.66.251.2]trends matched the situations described by local managers. Our simulation results made it possible to analyze the im-pacts of climate variability and variations in water uses and water management practices on the balance between demand and availability.
In the Hérault Basin, the irrigation needs of vineyards in-creased and were subject to great variability (standard devi-ation reached 60 % of the mean water demand over 1971– 2009). Urban water demand also increased significantly, and water use conflicts started to appear in the basin. AWD sat-isfaction in the Gignac area appears to be sensitive to hydro-climatic variability (the 1970s were wetter whereas the 1980s and the 2000s were warmer and drier). However, the im-provement in irrigation efficiency in the 2000s succeeded in limiting agricultural water shortages in the Gignac area. In the Agde section, an imbalance between demand and avail-ability emerged in the 2000s because of the combined in-crease in AWD and UWD and the dein-crease in natural stream-flow. Although UWD also increased in the Ebro Basin, it re-mained very low compared to AWD. The main driver of the decrease in water demand satisfaction in the Ebro was the increase in demand triggered by the expansion of irrigated land, which exceeded the water supply capacity in some ar-eas (under current management and storage capacity).
Although key areas of the Hérault Basin were highly sen-sitive to hydro-climatic variability, the balance between wa-ter uses and availability in the Ebro Basin appears to be more critical, owing to high agricultural pressure on water resources. All the same, water demand and availability were shown to be in balance in large systems of the Ebro Basin such as the Ebro Valley, Aragon and Catalunya, Segre, and lower Ebro, which concentrate 60 % of the water demand from the large irrigation systems in the basin. In compari-son, water demand in the Gignac area represented, on aver-age, 70 % of total AWD over the Hérault Basin over the past 40 years. What is more, the vineyards in the Hérault Basin may be more vulnerable to an unreliable water supply than the cereal and fodder crops grown in the Ebro Basin, where cropping patterns can be adjusted on a yearly basis to adapt them to the hydro-climatic conditions. The spatial distribu-tion of our integrative approach enabled us to identify the most vulnerable areas: the main stakes for maintaining or reaching water balance are concentrated in the Gignac and Agde areas in the Hérault Basin, and on the right bank and in the Bardenas and Alto Aragon systems in the Ebro Basin.
5.2 Limitations
The widespread anthropogenic influence on streamflow made calibration and validation of natural streamflow diffi-cult, particularly in the Ebro Basin. The challenge was that no water withdrawal data were available at a finer timescale than annual values; consequently reconstructing series of natural streamflow through data analysis would have been impossi-ble. Another way of simulating natural flow would have been
to integrate the water withdrawals and return flows in the calibration procedure by simulating natural flows, modify-ing them with simulated withdrawals (accordmodify-ing to simulated demand and availability) and return flows, and applying the performance criteria to the influenced flow (e.g., Beck and Bernauer, 2011). Although this method could be conceivable in a simple system of, for example, one or two sub-basins with few storage dams, here the calibration on influenced flow would have taken into account the bias in streamflow regulation, withdrawal simulations, etc., thus, not guarantee-ing the quality of natural streamflow simulations. Since the influence of consumptive use is highest during low flow riods, the hydrological model was mostly calibrated over pe-riods of mid and high flows.
The other components of the modeling chain (the dam management model, the simulation of water demand, and the simulation of influenced streamflow) were validated against observed data, if available. As shown in Sect. 4.1.2, the func-tioning of some dams was poorly simulated. In the case of the Caspe and Talarn dams, this may be due to the streamflow regulations by other dams located upstream and not included in this study. Furthermore, the Talarn dam is mostly operated for hydropower production, which was not included in this study. In the case of the Caspe dam, the irrigated areas ac-tually linked to the dam may have been underestimated. The Sotonera and Grado dams are operated jointly since 1981. The reconstruction of the changes in irrigated areas and their attribution to one dam or the other was a difficult task and a misrepresentation of the links between irrigated areas and each dam might have led, for example, to the Sotonera dam to be undersolicited in our simulations. The same can be said of the jointly operated Barasona and Santa Ana dams. Moreover our simulations considered the three dams Escales, Canelles and Santa Ana as one large dam in the location of Santa Ana (see Sect. 3.3.1). This may be an oversimplification of the real-life management of these dams.
management of the Grado dam (operated jointly with the So-tonera dam) and of the Barasona dam (operated jointly with the Santa Ana dam) at the outlet of the Cinca sub-basin, and by the management of the Santa Ana dam and of the jointly operated Talarn and Oliana dams at the outlet of the Segre Basin.
Although the long-term reconstruction of past water de-mands produced valuable information that was not available using regular data sources, accurate validation of water de-mand simulations in space and over time was not possible due to the lack of appropriate data on withdrawals. Nonethe-less, the orders of magnitude, seasonal distributions, and past dynamics appear to be in agreement with the data that were available as well as with the knowledge of local managers (see Grouillet et al., 2015). For example, in this study an av-erage agricultural water demand of 6820 hm3yr−1was simu-lated in the 2000s, while the CHE (2013) indicated an AWD of 8500 hm3yr−1.
Another point to consider is the assumption made on groundwater simulation and the groundwater–surface flow links. The hydrological model used in this study does not fully account for groundwater and groundwater–surface flow links. It simulates streamflow coming from both surface and groundwater sources. Other models that properly account for surface–groundwater interactions exist (e.g., Pulido-Velazquez et al., 2007, 2012). However, the application of such models at the scale of the Hérault or the Ebro basins is complex, considering the heterogeneity of hydrogeological contexts (e.g., the Hérault Basin varies from schist to karstic and alluvial zones) and the availability of piezometric data too sparse in space and in time to allow for acceptable cali-bration and validation of a more complex hydrological model over the 40-year period. Considering the small contribution of groundwater to the water supply in the Ebro Basin (4 %; see CHE, 2013), this modeling issue probably has a limited impact on the simulation of streamflow. In the Hérault, the sub-basins of the Vis at Saint-Laurent, Hérault at Gignac and Lergue at Lodève have developed karstic systems, and low flows are comprised almost exclusively of streamflow from karstic springs. Our simulations somewhat underesti-mate low flows of the Vis at Saint Laurent and the Hérault at Gignac, which could be explained by the inability of the GR4j model to represent the complex karstic system. How-ever the main water withdrawal in these areas is by far the Gignac irrigation canal, which takes water directly from the Hérault River upstream from Gignac. In the downstream sub-basin of the Hérault (the Agde area), most of the water sup-ply comes from the alluvial aquifer a few meters from the riverbed. In our simulations, we assumed these withdrawals impacted surface flow directly, since surface and groundwa-ter flows have been shown to be tightly linked in this area (Weng and Dörfliger, 2002).
Simulations of water shortages at a 10-day time step should be interpreted with caution, as no real-time water management adjustments were considered in this modeling
framework. Indeed, the order of priority for the supply of water to different uses was fixed in our model, and no re-strictions were imposed on industrial and urban demand be-fore agricultural withdrawal restrictions reached 100 % of demand. In real life, water use restrictions can be decided on in advance to limit non-essential urban uses before supplies to irrigators are entirely cut off. Likewise, in the Ebro Basin each Junta de Explotación can decide on the water volumes allocated to different users at the beginning of the irrigation season, based on the filling level of the associated reservoirs. Thus, if the irrigation season begins with low reservoir levels, withdrawals can be partially restricted throughout the season instead of waiting until the reservoirs are at their minimum level before limiting withdrawals. Sometimes farmers decide on their cropping patterns according to the reservoir level and/or snow cover (Salvador et al., 2011). In systems with no storage capacity like the Gignac canal or the Agde section in the Hérault Basin, water shortages may be more irregular. In future studies, anticipated water reallocation should be in-corporated in the model to better integrate the human aspects of water management.
Finally, the simulation of UWD, OWD and AWD does not provide a comprehensive view of water uses. Notably, the de-mand for hydropower production was only partly accounted for through reserved flows at the dams concerned for the sat-isfaction of AWD. This could be a source of bias in the mod-eling of influenced streamflow, as the operation of dams for the production of hydropower can have a major impact on the downstream streamflow and hence significantly affect down-stream users. Also, despite the increasing attention paid to environmental flows, these flows were not included in this study, except for reserved flows at dam outlets in the Ebro Basin. However, considering the time depth of the study, one could argue that water withdrawals would not have been lim-ited by environmental concerns during the majority of the study period. In future studies, environmental flows should be taken into account when assessing the sustainability of a hydrosystem’s water balance.
5.3 Prospects