ScholarWorks @ Georgia State University
ScholarWorks @ Georgia State University
Physics and Astronomy Dissertations Department of Physics and Astronomy
Fall 11-26-2012
J Psi Measurement in Au+Au Collisions at sqrt (sNN) = 39 and
J Psi Measurement in Au+Au Collisions at sqrt (sNN) = 39 and
62.4 GeV
62.4 GeV
Abhisek Sen
Georgia State University
Follow this and additional works at: https://scholarworks.gsu.edu/phy_astr_diss
Recommended Citation Recommended Citation
Sen, Abhisek, "J Psi Measurement in Au+Au Collisions at sqrt (sNN) = 39 and 62.4 GeV." Dissertation, Georgia State University, 2012.
https://scholarworks.gsu.edu/phy_astr_diss/59
This Dissertation is brought to you for free and open access by the Department of Physics and Astronomy at ScholarWorks @ Georgia State University. It has been accepted for inclusion in Physics and Astronomy
Dissertations by an authorized administrator of ScholarWorks @ Georgia State University. For more information,
by
ABHISEK SEN
Under the Direction of Prof. Xiaochun He
ABSTRACT
J/ψ production is considered a very important probes for studying the properties of
quark gluon plasma (QGP). At the PHENIX experiment at Brookhaven National
Labora-tory, a large suppression of J/ψ production in Au+Au collisions at 200 GeV center of mass
energy as compared to the binary collision scaled p+p collisions was observed. The level of
suppression is similar to that observed at other energies at CERN’s SPS and LHC
experi-ments. This work addresses the PHENIX J/ψ measurements at √sN N = 39 and 62.4 GeV
Au+Au collisions. These allow for the energy dependent J/ψ suppression measurements
in order to disentangle the important contributing factors of J/ψ production. J/ψ results
over a wide range of center of mass energies (39-200 GeV) from PHENIX are discussed, in
addition to a comprehensive comparison with other experiments.
by
ABHISEK SEN
A Dissertation Submitted in Partial Fulfillment of the Requirements for the Degree of
Doctor of Philosophy
in the College of Arts and Sciences
Georgia State University
by
ABHISEK SEN
Committee Chair: Dr. Xiaochun He
Committee: Dr. Murad Sarsour
Dr. Steven T. Manson
Dr. Misty Bentz
Electronic Version Approved:
Office of Graduate Studies
College of Arts and Sciences
Georgia State University
DEDICATION
To my dad.
ACKNOWLEDGEMENTS
Writing of this dissertation has been one the most significant academic challenges I ever
faced. Without the support, patience and guidance from the following people the work would
not have been completed. So, I would like to take the opportunity to thank all those who
made this possible.
First of all, I am indebted to my advisor Prof. Xiaochun He, an exceptional mentor.
Working with you was filled with fun and excitement. You have oriented and supported me
with promptness and care, and have always been patient and encouraging in times of new
ideas and difficulties. You always backed me when I needed, even helped me in my very
earlier days in US which made me feel a friend, which I appreciate from my heart.
Thanks to Laura Patel, for being my lab-mate, english mentor and a very good friend
when I needed one. You kept the lab environment fun-filled, pleasant and productive.
Furthermore, I like to thank the whole GSU group and I had pleasure working with
you. Special thanks to Dr. Murad Sarsour, Dr. Jun Ying, Dr. Liang Xue, Carola Butler,
Kanishka Dayananda, Christopher Oakley, Xiaohong Zhang, David Camp, Maggie Jezghani,
Matthew Haddad and Hari Guragain. Thanks for your support and encouragement.
In addition, as a part of PHENIX collaboration, I have been privileged to get to know
and collaborate with great many people in the last several years. This work would not have
been possible without help from Jamie Nagle, Mike Leitch, Hugo Pereira, Cesar Da Silva,
Matthew Wysocki, Tony Frawley and Marzia Rosati. Thanks for the encouraging discussions
and teaching me a great deal of physics as well as technical groundwork.
Finally, I would like to thank my family for all their support and encouraging my
education. My mom, dad, younger brother and my cousins, I would not be where I am
TABLE OF CONTENTS
DEDICATION . . . iv
ACKNOWLEDGEMENTS . . . v
LIST OF TABLES . . . ix
LIST OF FIGURES . . . xi
LIST OF ABBREVIATIONS . . . xv
CHAPTER 1 INTRODUCTION . . . 1
1.1 Standard Model . . . 1
1.2 QCD Phase Space . . . 6
1.3 Heavy Ion Collision . . . 8
CHAPTER 2J/ψ MESONS . . . 12
2.1 J/ψ Production . . . 12
2.2 J/ψ Production in Heavy Ion Collisions . . . 17
2.3 Cold Nuclear Matter Effects. . . 18
2.4 Final State Effects . . . 20
2.5 Experimental J/ψ Measurements . . . 23
2.6 Motivation For This Study. . . 31
CHAPTER 3 EXPERIMENT . . . 32
3.1 RHIC . . . 32
3.2 PHENIX Experiment . . . 34
3.3 Muon Spectrometers . . . 37
3.5 Data Acquisition . . . 42
CHAPTER 4 MUON SOFTWARE . . . 45
4.1 Muon Software Algorithm . . . 47
CHAPTER 5 DATA ANALYSIS . . . 52
5.1 Au+Au Collisions At √s= 39 and 62.4 GeV . . . 52
5.2 Collision Centrality . . . 54
5.3 Quality Assurance . . . 57
5.4 Data Quality Cuts . . . 62
5.5 Signal Extraction . . . 64
5.6 Invariant Mass Fit Function . . . 69
5.6.1 62.4 GeV J/ψ Yields . . . 71
5.6.2 39 GeV J/ψ Yields . . . 74
5.7 Acceptance and Efficiency . . . 74
5.7.1 MuID Tube Efficiencies . . . 76
5.7.2 Flat Mass Simulation . . . 76
5.7.3 Pythia Particle Generator . . . 78
5.7.4 PISA and Detector Response . . . 80
5.7.5 Embedding . . . 82
5.8 Real Data and MC Matching . . . 84
CHAPTER 6 SYSTEMATIC ERRORS . . . 90
6.1 Introduction . . . 90
6.2 Signal Extraction . . . 90
6.3 Acceptance×efficiency Calculation . . . 91
6.4 Detector Acceptance . . . 92
6.5 Detector Efficiency . . . 92
6.7 Number of Nucleon-Nucleon Collisions . . . 93
6.8 BBC Efficiency . . . 93
CHAPTER 7 RESULTS . . . 94
7.1 Arm Average . . . 95
7.2 Nuclear Modification, RCP . . . 101
CHAPTER 8J/ψ RAA . . . 107
8.1 Proton-Proton Reference . . . 107
8.1.1 200 GeV . . . 108
8.1.2 39 GeV . . . 109
8.1.3 62.4 GeV . . . 111
8.2 RAA Calculations . . . 114
CHAPTER 9 DISCUSSION . . . 116
9.1 Summary . . . 119
Appendix A KINEMATIC VARIABLES . . . 120
A.1 Transverse Momentum . . . 120
A.2 Rapidity . . . 121
Appendix B QUALITY ASSURANCE . . . 122
B.1 62.4 GeV . . . 122
B.2 39 GeV . . . 124
Appendix C DIMUON MASS FITS . . . 126
LIST OF TABLES
Table 1.1 Forces and their strengths . . . 3
Table 2.1 Quarkonia dissociation temperatures . . . 22
Table 2.2 Particle collider experiments. . . 24
Table 3.1 PHENIX detectors . . . 37
Table 4.1 Interface objects implemented in MUTOO software framework . . 48
Table 5.1 39 and 62.4 GeV Au+Au collisions. . . 53
Table 5.2 Glauber results for 39 GeV . . . 57
Table 5.3 Glauber results for 62.4 GeV . . . 57
Table 5.4 Cluster statistics . . . 61
Table 5.5 Analysis cuts . . . 64
Table 5.6 Fitting parameters for J/ψ signal extraction. . . 70
Table 5.7 Raw J/ψ counts in centrality bins at 62.4 GeV . . . 73
Table 5.8 Raw J/ψ counts inpT bins at 62.4 GeV . . . 73
Table 5.9 Raw J/ψ counts in centrality bins at 39 GeV . . . 74
Table 5.10 Raw J/ψ counts inpT bins at 39 GeV . . . 75
Table 5.11 MuID tube efficiencies. . . 76
Table 5.12 Summary of the generated J/ψ in flat mass simulation. . . 78
Table 5.13 Acceptance×efficiency in each centrality bin of 62.4 GeV data set. 84 Table 5.14 Acceptance×efficiency as a function of pT for 62.4 GeV. . . 85
Table 5.15 Acceptance×efficiency as a function of centrality for 39 GeV. . . . 86
Table 5.16 Acceptance×efficiency as a function of pT at 39 GeV. . . 86
Table 6.1 Systematic uncertainties . . . 93
Table 7.1 Invariant yields vs centrality in south arm at 62.4 GeV . . . 98
Table 7.2 Invariant yields vs centrality in north arm at 62.4 GeV . . . 98
Table 7.4 Invariant yields vspT in south arm at 62.4 GeV . . . 99
Table 7.5 Invariant yields vspT in north arm at 62.4 GeV . . . 99
Table 7.6 Averaged invariant yields vs pT at 62.4 GeV . . . 99
Table 7.7 Invariant yields vs centrality in south arm at 39 GeV . . . 100
Table 7.8 Invariant yields vs centrality for north arm at 39 GeV . . . 100
Table 7.9 Averaged invariant yields at 39 GeV . . . 100
Table 7.10 J/ψ RCP at 39 and 62.4 GeV . . . 104
Table 8.1 ISR Measurements of J/ψ in p+p collisions . . . 112
Table 8.2 p+p Extrapolations at 39 and 62.4 GeV . . . 113
LIST OF FIGURES
Figure 1.1 Quark and Lepton family . . . 2
Figure 1.2 Feynman diagrams for QED and QCD vertices’s. . . 3
Figure 1.3 Running coupling constant as a function of Q . . . 5
Figure 1.4 QCD phase diagram . . . 7
Figure 1.5 Heavy ion collisions . . . 10
Figure 1.6 Stages of heavy ion collisions at RHIC. . . 10
Figure 2.1 Charmonia states and their decay modes . . . 13
Figure 2.2 Heavy flavor productions . . . 13
Figure 2.3 The feed-down fromψ0 . . . 15
Figure 2.4 The feed-down fromχC toJ/ψ . . . 15
Figure 2.5 200 GeV J/ψ rapidity distribution . . . 16
Figure 2.6 200 GeV J/ψ pT distribution . . . 16
Figure 2.7 Gluon nPDF modifications . . . 19
Figure 2.8 Gluon modification in EPS09 . . . 19
Figure 2.9 J/ψ potential in vacuum and QGP . . . 21
Figure 2.10 J/ψ suppression at SPS . . . 25
Figure 2.11 J/ψ modification at Fermilab measurements . . . 26
Figure 2.12 J/ψ suppression in d+Au collisions . . . 28
Figure 2.13 J/ψ suppression in Au+Au collision . . . 29
Figure 2.14 Prompt J/ψ suppression at CMS . . . 30
Figure 2.15 Non-prompt J/ψ suppression at CMS . . . 30
Figure 3.1 The Relativistic Heavy Ion Collider Facility. . . 33
Figure 3.2 PHENIX detector. . . 35
Figure 3.3 PHENIX detector configuration during 2010 . . . 36
Figure 3.5 PHENIX muon tracking spectrometer (south arm) . . . 40
Figure 3.6 Muon arm magnetic fields . . . 40
Figure 3.7 Cutaway view of two-pack with MuID Iarocci tubes . . . 41
Figure 3.8 PHENIX Muon Identifier . . . 41
Figure 3.9 DATA collection by PHENIX data acquisition system. . . 44
Figure 4.1 Track reconstruction at PHENIX muon arm. . . 51
Figure 5.1 Run10 62.4 GeV Au+Au data taking. . . 53
Figure 5.2 Run10 39 GeV Au+Au data taking. . . 54
Figure 5.3 Glauber NBD fit to PC1 hit distributions at 39 GeV. . . 56
Figure 5.4 Glauber NBD fit to PC1 hit distributions at 62.4 GeV. . . 56
Figure 5.5 Disabled MuTr high voltage channels . . . 59
Figure 5.6 Cluster charge distribution . . . 60
Figure 5.7 BBC z-vertex distribution at 62.4 GeV Au+Au collisions. . . 62
Figure 5.8 Dimuon signal at 62.4 GeV . . . 67
Figure 5.9 Background subtraction . . . 68
Figure 5.10 Background subtracted dimuon spectra at 62.4 GeV . . . 71
Figure 5.11 J/ψ signal in dimuon spectra . . . 72
Figure 5.12 MuID tube efficiencies for south arm panels (horizontal plane) . . 77
Figure 5.13 Dimuon mass acceptance in pT bins . . . 78
Figure 5.14 Dimuon mass acceptance in centrality bins . . . 79
Figure 5.15 J/ψ input rapidity distributions . . . 80
Figure 5.16 J/ψ input pT distributions . . . 80
Figure 5.17 MuTr track multiplicity at different energies in MuTr south. . . . 83
Figure 5.18 MuTr track multiplicity at different energies in MuTr north. . . . 83
Figure 5.19 J/ψ acceptance×efficiency for four centrality bins at 62.4 GeV. . 84
Figure 5.20 J/ψ acceptance×efficiency for four pT bins at 62.4 GeV. . . 85
Figure 5.21 J/ψ acceptance×efficiency for two centrality bins at 39 GeV. . . 85
Figure 5.23 Radial distribution . . . 88
Figure 5.24 Theta distributions . . . 88
Figure 5.25 φ distributions . . . 89
Figure 7.1 Invariant yield ratio . . . 97
Figure 7.2 J/ψ invariant yields vs Npart at 39, 62.4 and 200 GeV . . . 102
Figure 7.3 J/ψ invariant yields vs pT at 39 and 62.4 GeV . . . 103
Figure 7.4 J/ψ RCP at 62.4 and 200 GeV . . . 105
Figure 7.5 J/ψ RCP at 39 and 200 GeV . . . 106
Figure 8.1 J/ψ cross section at 200 GeV . . . 108
Figure 8.2 J/ψ cross-sectiion at 39 GeV CEM . . . 109
Figure 8.3 J/ψ cross-section at 62.4 GeV . . . 109
Figure 8.4 J/ψ cross-section vs xF at 39 GeV . . . 110
Figure 8.5 Nuclear modifications at 39 GeV . . . 110
Figure 8.6 39 GeV p+p extrapolation . . . 111
Figure 8.7 62.4 GeV p+p extrapolation . . . 112
Figure 8.8 J/Ψ RAA at 39, 62.4 and 200 GeV . . . 115
Figure 9.1 J/ψ per produced charm pairs in Au+Au collisions . . . 117
Figure 9.2 Model comparison . . . 118
Figure A.1 PHENIX coordinates. . . 120
Figure A.2 PHENIX rapidity acceptance. . . 121
Figure B.1 Landau fit results for south arm at 62.4 GeV . . . 123
Figure B.2 Landau fit results for north arm at 62.4 GeV . . . 123
Figure B.3 Number of disabled HV channels at 39 GeV . . . 124
Figure B.4 Landau fit results for south arm at 39 GeV . . . 125
Figure B.5 Landau fit results for north arm at 39 GeV . . . 125
Figure C.1 62.4 GeV dimuon spectrum in south arm for pT (0-5) GeV/c . . . 126
Figure C.2 62.4 GeV dimuon spectrum in north arm for pT (0-5)GeV/c. . . . 126
Figure C.4 62.4 GeV dimuon spectrum in north arm for pT (0-1) GeV/c . . . 127
Figure C.5 62.4 GeV dimuon spectrum in south arm for pT(1-2)GeV/c . . . . 128
Figure C.6 62.4 GeV dimuon spectrum in north arm for pT (1-2) GeV/c . . . 128
Figure C.7 62.4 GeV dimuon spectrum in south arm for pT (2-3) GeV/c . . . 129
Figure C.8 62.4 GeV dimuon spectrum in north arm for pT (2-3) GeV/c . . . 129
Figure C.9 62.4 GeV dimuon spectrum in south arm for pT (3-5) GeV/c . . . 130
Figure C.10 62.4 GeV dimuon spectrum in north arm for pT (3-5) GeV/c . . . 130
Figure C.11 62.4 GeV dimuon spectrum in south arm for centrality (0-100) . . 131
Figure C.12 62.4 GeV dimuon spectrum in north arm for centrality (0-100). . 131
Figure C.13 62.4 GeV dimuon spectrum in south arm for centrality (0-20). . . 132
Figure C.14 62.4 GeV dimuon spectrum in north arm for centrality (0-20). . . 132
Figure C.15 62.4 GeV dimuon spectrum in south arm centrality (20-40). . . . 133
Figure C.16 62.4 GeV dimuon spectrum in north arm for centrality (20-40). . 133
Figure C.17 62.4 GeV dimuon spectrum in south arm for centrality (40-60) . . 134
Figure C.18 62.4 GeV dimuon spectrum in north arm for centrality (40-60). . 134
Figure C.19 62.4 GeV dimuon spectrum in south arm for centrality (60-100) . 135
Figure C.20 62.4 GeV dimuon spectrum in north arm for centrality (60-100). . 135
Figure C.21 39 GeV dimuon spectrum in south arm for centrality (0, 86) . . . 136
Figure C.22 39 GeV dimuon spectrum in north arm for centrality (0, 86) . . . 136
Figure C.23 39 GeV dimuon spectrum in south arm for centrality (0, 40) . . . 137
Figure C.24 39 GeV dimuon spectrum in north arm for centrality (0, 40) . . . 137
Figure C.25 39 GeV dimuon spectrum in south arm for centrality (40, 86) . . 138
LIST OF ABBREVIATIONS
• BNL - Brookhaven National Laboratory
• RHIC - Relativistic Heavy Ion Collider
• PHENIX - Pioneering High Energy Nuclear Interaction eXperiment
• STAR - Solenoidal Tracker at RHIC
• QGP - Quark Gluon Plasma
• CNM - Cold Nuclear Matter
• HNM - Hot Nuclear Matter
• CERN - European Organization for Nuclear Research
• LHC - Large Hadron Collider
• CMS - Compact Muon Solenoid
• ALICE - A Large Ion Collider Experiment
• FNAL - Fermi National Accelerator Laboratory
• MB - Minimum Bias
CHAPTER 1
INTRODUCTION
The Relativistic Heavy Ion Collider (RHIC) is located at the Brookhaven National
Lab-oratory (BNL) on Long Island near New York city, USA. The main goal for the experimental
programs at RHIC is to study matter in extreme conditions and understand the properties
of the Quark Gluon Plasma (QGP), a deconfined state of nuclear matter at very high
tem-perature and high baryon density [1]. It is thought that the universe was created from a
“Big Bang” and was initially in a QGP state (just after the creation) [2]. Then the universe
expanded and the energy density decreased which lead to the transition to ordinary
(con-fined) matter. In experiments performed at BNL, RHIC collides different particle species
traveling at very close to the speed of light. In 2005, four experiments at RHIC jointly
pub-lished articles summarizing the key measurements at RHIC and announcing the discovery of
a state of matter similar to QGP produced at heavy ion collisions [1]. Such a medium, where
the relevant degrees of freedom over nuclear volumes, are expected to be those of quarks
and gluons and the predictions of Quantum Chromodynamics (QCD), a fundamental theory
which describes the role of quarks and gluons in nuclear matter, can be explored. Results
indicate that the matter created at RHIC reflects properties of a perfect fluid, analogous to
a strongly coupled plasma state, sometimes referred asstrongly coupled quark gluon plasma,
or sQGP.
1.1 Standard Model
The primary objective for nuclear and particle physics research is to study the
funda-mental forces and their symmetries and to be able to understand elementary particles in
nature. Matter has a hierarchy of constituents: macroscopic matter consists of molecules
Figure 1.1: Quark and lepton family, the fundamental constituents of matter in Standard
Model. Masses are taken from Particle Data Book [3].
and neutrons (together they are called nucleons) which are composed by quarks, anti-quarks
and gluons (called partons).
Throughout history, physicists have been working with scattering experiments at higher
and higher energies to achieve information on smaller and smaller scales. Scattering efficiency
and behavior depends on the size of the scatters relative to the wavelength of radiation (x
∼λ∼1/E). Quarks and leptons are considered the two basic type of fundamental elementary
particles. At the moment the hierarchy ends at quarks and leptons, no substructure has been
observed. They are considered as point like particles. According to modern Standard Model,
there are 6 quarks, up, down, charm, strange, top and bottom and 6 leptons, electron, muon,
tau and their corresponding neutrinos (shown in Fig. 1.1).
There are four fundamental forces: the gravity, the weak force, the electromagnetic force
and the strong force. Each of these forces are carried by different force carriers called bosons
as shown in Table. 1.1. They are responsible for all interactions between them. The Photon
is the carrier for the Electromagnetic force, the Gluon is for the Strong Force, the W and
the Z bosons are for the Weak Force. The theory which describes all fundamental particles
Figure 1.2: Feynman diagrams for QED and QCD vertices’s.
Table 1.1: Forces and their strengths relative to strong force [3].
Name Relative strength Range Exchange particle
gravity 10−38 ∞ graviton
weak 10−13 <10−18m Z0, W+, W−
electromagnetic 10−2 ∞ photon
strong 1 ∞ gluon
The branch of the standard model that deals with electro-magnetic and weak
inter-actions are called Quantum Electrodynamics (QED) and the calculations are very
accu-rate. These interactions are typically perturbative calculations that expand in powers of
αEM ∼1/137. Strong interactions between quarks and gluons are better described by
Quantum Chromodynamics (QCD), “chromo” for additional quark color quantum
num-bers. Fig. 1.2 shows few Feynman diagrams for QED and QCD processes. According to
the Standard Model quarks have six flavors. Each quark flavor has a corresponding type
of antiparticle called the anti-quark, with same the magnitude but opposite charge. There
are three types of “color” charge, arbitrarily labeled as red, green and blue and their
corre-sponding anti-colors are anti-red, anti-green and anti-blue. The quark carries a color while
the anti-quark carries an anti-color. Gluons, the strong force carriers can have two colors
and known as color octet. This encode the fact that when a gluon interacts with a quark
corresponds to the color charges.
Unlike leptons, quarks have not been observed as independent particles. Only a
com-bination of quarks and anti-quarks “confined” into color-neutral hadrons can exist. There
are two types of hadrons, masons and baryons. Mesons (π, K, ρ, η) carry a quark and an
anti-quark (qq¯), where baryons (p,Λ,Ω, n) consist of three quarks, qqq(or ¯qq¯q¯). All hadrons
found experimentally are color neutral. So when three quarks form a baryon, they must
combine in colorless combination red-green-blue, irrespective of quark flavors. Quarks have
baryon number B=1/3 and anti-quarks have baryon number B=-1/3. Hence baryons will
have baryon number B= ±1 and mesons have B= 0. Though it was proposed that baryons
can have more than three quarks, called “exotic baryons”, such as pentaquarks formed by 4
quarks and 1 anti-quark but they were never observed.
In QCD framework quarks interacts with themselves through mass-less gauge fields,
gluons. There are eight types of spin-1 gluon which can interact with quarks as well as with
other gluons, shown in the basic Feynman diagram in Fig. 1.2. These interactions between
two quarks (q and ¯q) can be describe with the potential energy,
V(r) =Kr−αs
r (1.1)
Where r is distance between q and ¯q. At small distances quarks behaves just like electrons
with a coulumbic potentialαs/rbut at large distances this interaction becomes much stronger
since gluons can interact with themselves. At sufficiently high separation the potential energy
increases and it eventually becomes energetically favorable for the original pair to splits into
two quark anti-quark pairs. αs in the above equation is the coupling constant, also known as
the running coupling constant. To be precise, this coupling is not actually a constant term;
it changes with the four momentum transfer (Q2) and can be written as,
αs ≈
12π
(33−2Nf)ln(Q2/ΛQCD2)
(1.2)
ΛQCD is a constant QCD scale parameter, which needs to be determined experimentally
(ΛQCD ≈250M eV /c). As shown in Fig. 1.3 the effective coupling between quarks is infinitely
strong at low Q, exhibiting confinement phenomena. The coupling constant decreases with
increasing Q. At large Q or short separation, the effective coupling constant becomes so small
that partons can move freely and their interactions may be calculated with perturbation
theory. This phenomena, called “asymptotic freedom”, was discovered by Wilczek,Politzer
and Gross in 1973 who won Nobel Prize in 2004 because of this discovery [5, 6]. So in normal
conditions quarks and gluons are confined into hadrons but at higher temperature and density
a new state of matter Quark Gluon Plasma (QGP) can exists which is composed of deconfined
quarks and gluons. Lattice QCD is one of the theories that describes the interaction between
quarks and gluons in non-perturbative regime [7]. Lattice QCD calculations show that
there is a phase transition from hadronic matter, where quarks and gluons are confined into
hadrons, to QGP at an extremely high temperatureTC ∼170M eV and high energy density
C ∼1GeV /f m3 [8, 9].
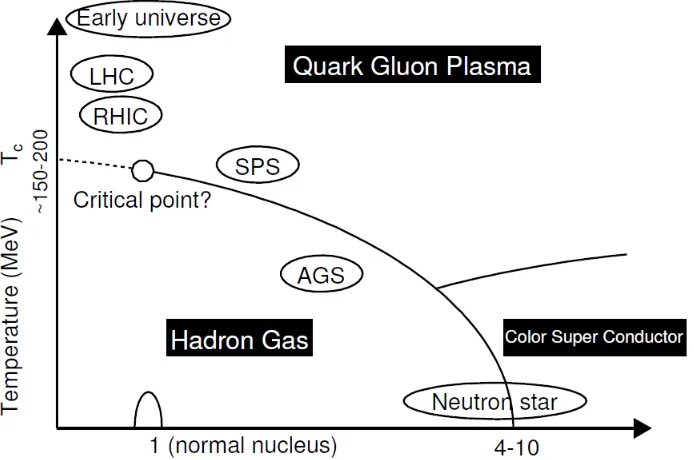
1.2 QCD Phase Space
The behavior of QCD at extreme high temperatures and densities has long been of
interest. According to the standard model of cosmology, our universe originated in a “Big
Bang” from a state of almost infinite energy and temperature [10]. At this initial state of the
universe, quarks, antiquarks and gluons were deconfined and occupied the whole universe
in a thermalized state of QGP. As time passed and the energy density dropped below the
critical limit C ∼1GeV /f m3 and the temperature dropped below TC ∼ 170 MeV, a phase
transition occurred between the QGP and normal matter, where colored degrees of freedom
became confined and hadrons were formed. A schematic phase diagram of hadronic matter
including QGP is shown in Fig. 1.4, shows the normal nuclear matter, hadronic gas and
the QGP phase. The horizontal axis is the baryon density normalized to the density of
normal nuclear matter (∼0.15 GeV /f m3) and the vertical axis is the temperature. However,
Figure 1.4: QCD phase diagram
surface of the cosmic microwave background which came at later stage of universe’s early
history [11]. So a direct study of QGP from astronomical observations of the early universe
is not possible. There have been some predictions that radio-quiet neutron stars, a new type
of “quark” star might also allow for astronomical observations of the deconfined phase of
matter [12]. However at this time, heavy nuclei collisions at high energy laboratories can
provide the only opportunity to carry out the studies of the nature of quark gluon plasma,
The QCD phase diagram is very similar to the phase space of water. In the phase space
diagram of water there are three possible states: water, ice and vapor. The point at very high
temperature and pressure, where the liquid and gaseous phases become indistinguishable is
called the critical point. The critical point for water is 647K (374◦ C) at pressure 600Nm−2.
ForT < Tcthe transition between liquid and vapor is first order, implying discontinuities in
entropy and volume and beyond that its second order having discontinuities in specific heat
parameters are T and baryon density. In the bottom left-hand corner of the phase diagram
where temperature and baryon density are both small, the thermodynamic behaviors of
QCD can be described in terms of a vapor of hadrons, which are composite states of quarks
and anti-quarks. Eventually there comes a point where either a transition or a crossover
occurs to a phase where the dominant degrees of freedom are no longer hadrons but quarks
themselves together with gluons in a state of Quark Gluon Plasma. Different phases have
different symmetries of their own and are separated by critical lines.
Unfortunately, the transition near QGP is in an inherently non-perturbative regime
and it is not easy to perform calculations. Lattice QCD, which makes use of Euclidean
space-time grid to calculate the path integral of the QCD partition function, is used to
perform numerical calculations. Experimentally it is hard to map the whole phase diagram
because of the difficulties in tuning the temperature and the density in the laboratory.
However, the phase transition between confined and deconfined phases of QCD is being
studied extensively in heavy ion collisions experiments and in lattice QCD. It has been
confirmed that the QGP undoubtedly exists at sufficiently high energies produced in heavy
ion collisions. In lattice QCD calculations, a purely gluonic (SU(3) gauge symmetric) system,
for which the Equation of State (EoS) has been computed without approximations, the
deconfinement phase transition is found to be of the first order and the critical temperature
is TC ≈ 170M eV [8, 9]. Once QGP is formed, it must quickly expand and cool down due
to fast expansion and as temperature T falls below Tc, hadrons started forming, this called
chemical freeze-out.
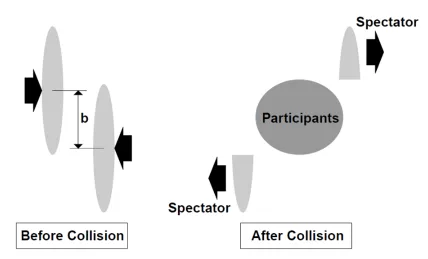
1.3 Heavy Ion Collision
The Relativistic Heavy Ion Collider (RHIC) is able to recreate Quark Gluon Plasma
state by colliding heavy ions moving at very close to the speed of light. Heavy ion collisions
are schematically shown in Fig. 1.5, where two nuclei collide with impact parameter b. As
seen in the figure, due to their relativistic speed, the colliding nuclei are Lorentz contracted
plane participate in the collision and called “participants”. Other nucleons, which do not
participate in the collision are called “spectators”. Participants deposit a large amount
of energy in a very small region creating a hot and dense state of matter of high energy
density. The energy density is proportional to the number of participants. For small impact
parameter b∼0, almost all the nucleons participate in the collision and, is called a “central
collision”. On the other hand, at larger impact parameters, only a few nucleons collide and
those collisions are called “peripheral collisions”.
In proton-proton collisions, after such collisions, the produced quarks and gluons fly
away practically free, dress with a gluon cloud and rapidly form color singlet bound states,
hadrons. But in a heavy ion environment the situation radically changes. When many
par-tons are scattered simultaneously into the same volume element and a hot-dense medium
of partons is formed, where the interactions of quarks, antiquarks and gluons are so
effec-tively screened that the formation of bound states is inhibited and QGP is formed. As the
medium expands and cools down, it passes through different phases, as shown in Fig. 1.6.
Hadronization is the phase, when the temperature becomes low enough for free partons to
become confined into hadrons. Next, kinetic freeze-out occurs when the expanding hadrons
are too sparse to interact with one another. At this point they will continue along their
trajectories and can be experimentally observed. It is important to mention that in order to
understand any QGP medium properties through the nature of the particle production the
evolution through other phases must be accounted for as well. Hadronization in particular
is not understood well.
It is challenging to study the properties of the medium experimentally due to its
exceed-ingly short lifetime. Over the past 25 years of heavy ion collision history, many experimental
probes have been suggested to study the properties of QGP states. One interesting way
to probe QGP experimentally is through heavy quarkonium(qq¯) suppression in heavy
ion collisions. Heavy quarks (HQ), charm and bottom quarks are produced through hard
scattering in the very early stage of the collisions in the medium. Their bound states are
ef-Figure 1.5: The view of the colliding nuclei before and after the collisions. Two nuclei with
impact parameter b were bring into collision at almost the speed of light. System divides
[image:27.612.92.520.97.356.2]into components after the collision, the spectator and participants.
fected by the final state interactions like hadronization. If a hot-dense medium like QGP
is formed, Quarkonia bound states will dissolve or never form in the medium due to color
screening. This probe was first proposed by Matsui and Satz in 1986 [13]. The presence of
QGP will prevent production of qq¯pairs and lead to a suppression. This quarkonia bound
state suppression phenomena can be tested experimentally in order to quantify the medium
properties. Furthermore, this feature behaves like a thermometer of the medium, as the
dissociation temperature will be different for different quarkonium states depending on their
binding energies. For my thesis I will be focusing on J/ψ (a charmonium, cc¯(1S) bound
state) analysis at various center of mass energies, to explore the QGP signature by analyzing
CHAPTER 2
J/ψ MESONS
For many years studying J/ψ has been a very interesting topic in both experimental
and theoretical particle physics. The reason is that J/ψ carries important signatures of the
initial state medium properties which created in heavy ion collisions. TheJ/ψdiscovered in
1974, is the first charmonium (made of one charm and another anti-charm quark), has a rest
mass of 3096.87±0.04 M eV /c2 and a mean lifetime of 7.2×10⁻²¹ s [3]. It was discovered
by two independent research groups simultaneously. SLAC (Stanford Linear Accelerator
Center) and BNL both announced the discovery of this particle simultaneously on the date
of 11th November 1974 [14, 15]. Burton Richter from SLAC and Samuel Ting from BNL were
awarded Nobel prize in physics in 1976 for this discovery. It primarily decays into hadrons,
branching ratio B(J/ψ→hadrons)=87.7±0.5% but it also decay through the lepton channels
toe−e+(B(J/ψ→e−e+)=5.94±0.06%) and µ−µ+ (B(J/ψ →µ−µ+)=5.93±0.06%), which
experimentalists use to study J/ψ [3]. Since its discovery, many more charmonium states
have been discovered: ψ0, ηC and χC etc. Several charmonia states are shown in Fig. 2.1,
with their major decay modes between the those charmonia states.
2.1 J/ψ Production
This section briefly describes theJ/ψproduction mechanisms. The production of heavy
quarkonia is expected to be perturbative, since charm quarks are heavy compared to the
typical QCD scale ΛQCD ∼ 0.2 GeV, which corresponds to αs(c) << 1. Fig. 2.2 shows
different heavy quark production diagrams, where (a)-(c) are leading order processes and
(d)-(f) are higher order processes. The dominant source ofJ/ψproduction at RHIC energies
is gluon fusion (a) of Fig. 2.2), which takes place at very short time τpert≈1/2∗mC.
heavy-Figure 2.1: Charmonia states and their decay modes [16].
Figure 2.2: Heavy flavor production diagrams: (a) Gluon fusion (leading order) (b)
Quark-antiquark annihilation (leading order) (c) Pair creation with gluon emission (d) Flavor
quarkonium production to explain the experimental results. These include the
Non-relativistic QCD (NRQCD) factorization approach, the color-singlet model (CSM) and the
color-evaporation model (CEM) etc.
Non-relativistic QCD (NRQCD)
NRQCD is an effective field theory that describes the behavior of bound states of a
heavy-quark (Q) and a heavy-antiquark( ¯Q). The model is non-relativistic because the
ve-locity v of Q and ¯Q in the QQ¯ rest frame is non-relativistic (v << c) [18]. One might
think that the large mass of the charm quarks as the reason to neglect relativistic effect and
quarkonia production can be calculated accurately by perturbative theory. However, low
momentum and nonperturbative nature associated with the dynamics of the quarkonium
production make it questionable. NRQCD carries out the perturbative process, with which
one can factorize the production cross section of the cc¯pairs as a powers of αs.
Color-singlet model (CSM)
In CSM, a QQ¯ pair is in a color-singlet bound state, where Q and ¯Q are separated by
distance ∼ 1/mQv which is smaller than ΛQCD. CSM postulates that the formation of a
meson out of two heavy quarks can be factorized. It also assumes that the color and spin
of the qq¯pair do not change during binding and therefore the qq¯pairs are required to be
produced in color singlet states. The model describes the J/ψ photo-production very well
but fails to describe the Tevatron data in p+ ¯p collisions at √s =1.8 TeV by a factor of
∼60 [19, 20]. Recently, it has been found that very large corrections to the CSM appear at
next-to-leading order (NLO) and next-to-next-leading order (NNLO) in αs [21]. Given the
large corrections at NLO and NNLO, it is not clear that the perturbative expansions in αs
are convergent.
Color-evaporation model (CEM)
CEM is able to reproduce a number of experimental results very well. The model
assumes that the color state of the produced c¯c is completely random and there is one out
Figure 2.3: The feed-down from ψ0 as a
function of center of mass energies [24].
Figure 2.4: The feed-down from χC
de-cay to J/ψ as a function of √s,
along-with prediction from NRQCD and CSM
models [25].
assumed to end up in open charm (or D) mesons, where one charm quark paired with another
quark of lesser mass. This can be written as
σ(J/ψ) = ρ
9
Z 2mD
2mC
dmdσcc¯
dm (2.1)
where dσcc¯
dm is the differential cc¯production cross-section with respect to mass m. mC and
mD are the masses of open charm and D mesons. The natural value ofρis the inverse of the
number of quarkonia states between 2mC and 2mD, basically determined from experimental
results. CEM has the restriction on the mass ofc¯cpairs, which should be below the mass of
DD¯. The reason it is called “color evaporation” model is because cc¯pairs are assumed to
neutralize its color by interacting with collision gluon field [22, 23].
Feed-down
Feed-down effects are an important feature to be noted in J/ψ production. Total J/ψ
y
-3 -2 -1 0 1 2 3
/dy [nb]
σ
d
llB
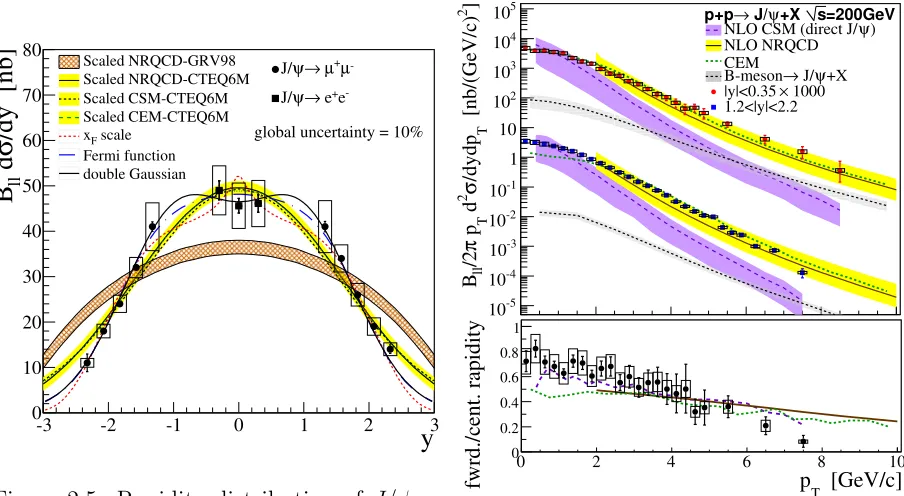
0 10 20 30 40 50 60 70 80 Scaled NRQCD-GRV98 Scaled NRQCD-CTEQ6M Scaled CSM-CTEQ6M Scaled CEM-CTEQ6M scale F x Fermi function double Gaussian -µ + µ → ψ J/ -e + e → ψ J/ [image:33.612.76.528.72.320.2]global uncertainty = 10%
Figure 2.5: Rapidity distribution of J/ψ
production at 200 GeVp+pcollisions [26].
0 2 4 6 8 10
] 2 [nb/(GeV/c) T /dydp σ 2 d T p π /2ll B -5 10 -4 10 -3 10 -2 10 -1 10 1 10 2 10 3 10 4 10 5
10 p+p→ J/ψ+X s=200GeV
)
ψ
NLO CSM (direct J/ NLO NRQCD CEM +X ψ J/ → B-meson 1000 × |y|<0.35 1.2<|y|<2.2 [GeV/c] T p
0 2 4 6 8 10
fwrd./cent. rapidity 0 0.2 0.4 0.6 0.8 1
Figure 2.6: Pt distribution of J/ψ
pro-duction at 200 GeV p+p collision [26].
J/ψ produced from decay of three χC states (∼30−40%), (c)J/ψ produced fromψ0 decay
(∼ 5−10%), and (d) J/ψ produced from open bottom decay (∼ 6%). Fig. 2.4 show the
ratio of χC production cross section which decayed to J/ψ to the production cross sections
of inclusive J/ψ as a function of collision energy. The world average is around ∼35% [25].
Fig. 2.3 is the ratioB(ψ0 →µ+µ−)σ(ψ0)/B(J/ψ →µ+µ−)σ(J/ψ), with an average of∼1.6%.
This corresponds to a feed-downB(ψ0 →J/ψ)σ(ψ0)/σ(J/ψ))∼ 6% [24].
PHENIX has measuredJ/ψproduction at √s=200 GeV p+p collisions, in a very wide
range of acceptance in rapidity and pT [27, 26]. Where rapidity (y) and pT are kinematic
variables as defined in Appendix. A. Fig. 2.5 and Fig. 2.6 show the J/ψ production in
a very wide range of rapidity and pT, compared to predictions from CSM, NRQCD and
CEM models. It is worthwhile to mention that there has been a lot of work done towards
understanding J/ψ production, but there is still a way to go before there is a complete
will review the J/ψ properties in heavy ion collisions as compare of ap+p system. A clear
understanding of p+penvironment is required before quantifying the heavy ion collisions.
2.2 J/ψ Production in Heavy Ion Collisions
Since the mass of the charm quarks is heavy, the creation of the charm quark pairs takes
place at the very early in the collision. Then J/ψ were formed from those pre-resonance cc¯
pairs at a very short time and it is thought that J/ψ may be formed before the formation
of QGP [28]. After creation, J/ψ or the pre-resonance ofc¯cpairs evolve with the evolution
of the hot dense medium created in heavy ion collisions. Thus the produced J/ψ’s contain
signatures which are sensitive to the initial conditions inside the colliding nuclei. Due to
their heaviness they are barely affected through hadronization as well.
Medium effects on J/ψ production in heavy-ion collisions can be categorized into two
groups. One is the effects on the J/ψ production after the formation of QGP, called “final
state effects”. The other is the effects before the formation of QGP, called the “cold nuclear
matter effects (CNM)” or “initial state effects”. As the cold nuclear matter effects, following
effects can contribute towards the J/ψ production:
• Modification of gluon distribution function in heavy nuclei.
• Interaction of pre-resonancecc¯state orJ/ψwith the participant nucleons (a.k.a nuclear
absorption).
• Multiple interactions of partons inside nuclei (Cronin effect).
Final state effects including the following mechanisms those are responsible for
modifi-cation of J/ψ production in heavy ion collisions:
• Color screening and dissociation ofc¯cpairs.
• Re-combinations ofJ/ψ from uncorrelated c¯cpairs.
2.3 Cold Nuclear Matter Effects
In addition to the effect of QGP (sometimes called as hot matter effects and discussed
in next section), the explanation of J/ψ suppression has gotten more complex in the last
15 years, due to the suppression of J/ψ within normal nuclear matter (called cold nuclear
matter effects), which was missing from the prediction of Matsui and Satz [13].
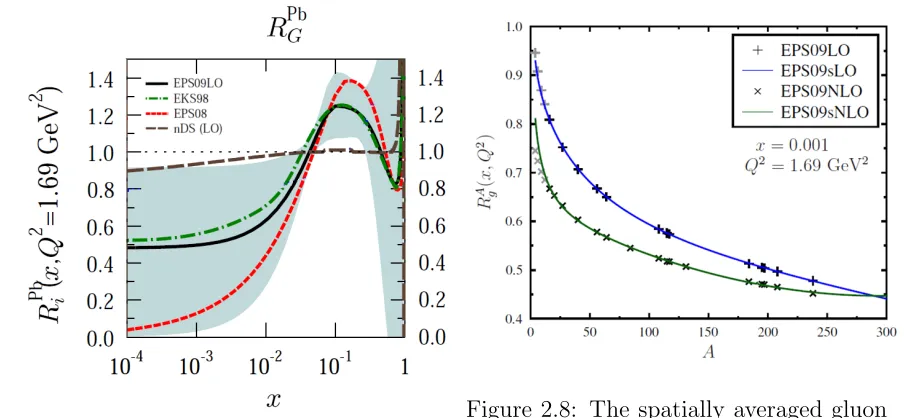
Gluon shadowing
The quark and anti-quark distributions as a function of momentum fraction (i.e. fraction
of total momentum carried by a parton, x) and momentum transfer Q2 have been probed
through the deep inelastic scattering (DIS) of leptons and neutrinos from nuclei.
x= m√T
se
y (2.2)
where mT =
p p2
T +m2 is the transverse mass of J/ψ. The European Muon Collaboration
(EMC) experiment shows that the nuclear Parton Distribution Functions (nPDF) deviate
from those of free nucleons [29]. Nucleons shadow each other modifying the nPDFs
rel-ative to those of the free nucleons, a phenomenon called “shadowing”, which depends on
the momentum fraction x and square of the momentum transfer Q2. At 0.01≤ x ≤0.3,
some experiments found an enhancement of partons compared to free nucleons, called
“anti-shadowing”, shown in Fig. 2.7. The nuclear-modified PDF reflects the modification of parton
density which results in a modified number of the hard scatterings that create cc¯pairs from
g+g, q+g and q+ ¯q interactions. At RHIC energies the J/ψ production is dominated by
g+g interactions and gluon distributions will be modified as shown in Fig. 2.7, which will
result inJ/ψ modification as well. It can be seen that the nPDFs are not well constrained,
particularly at the low x region of gluon distribution which dominates at RHIC forward
energies. EPS09, EKS98 and nDS are different parametrizations, which are very model
dependent at present [30, 31]. Experimental measurements are needed to reduce these
Figure 2.7: Gluon nPDF modifications in
[image:36.612.84.542.69.278.2]Au nuclei (A=208) compared top+p[31].
Figure 2.8: The spatially averaged gluon
modification at a fixed value of x and Q2
for EPS09 LO and NLO models [31].
the J/ψ suppression, depending on the parton momentum fraction x and the square of the
momentum transfer Q2. The modifications to the gluon PDF in a nucleus relative to that
in a proton at a fixed x and Q2 is shown in Fig. 2.8 as a function of mass number A.
Nuclear absorption
In addition to modified nPDFs, there is a significant chance that J/ψ will fail to form
becausec¯cprecursors will interact with the medium while moving through the nucleus. This
is called the “break-up cross-section” as in break up of a pair. Sometimes this is also referred
as “absorption cross-section”, which is a mis-leading term since charm quark pair still exists
even if they become uncorrelated. In a Glauber formalism of p+A collisions [32], this can
be written as:
σpa=
σ0 σbr
Z
db[1−(1−TA(b)σbr)A] (2.3)
where σ0 is the nucleon-nucleon charmonium production cross-section, σbr is the cc¯
break-up cross-section, TA(b) is the nuclear thickness seen by the impacting proton as a function
of impact parameter b and A is the mass number of the nucleus. Currently there are no
from data.
Cronin effect
Partons undergo multiple scattering while they traverse the nuclei before producing
J/ψ’s. For instance, gluons from the projectile collide with various target nucleons modifying
their transverse momentum at each collision vertex, will lead to a wider pT distribution of
J/ψ, compared to those in p+p collisions, referred as the “Cronin effect” [33]. This leads to
an increase of the average transverse momentum squared in A+A collisions
hp2TiAA =hp2Tipp+
hδp2
Ti
λgN
hLgNi (2.4)
wherehp2Tippis the average squared transverse momentum ofJ/ψ inp+pcollisions. hδp2Tiis
the average of added squared transverse momentum by one gluon-nucleon scattering andλgN
and hLgNi are the mean free path and average path length of the gluon in uniform nuclear
matter before it produces a charmonium.
2.4 Final State Effects
Final state effects of J/ψ production are detailed in this section:
Color screening
While the discovery ofJ/ψwas a big milestone in our understanding of quark-antiquark
bound states, the suppression of J/ψ would indicate the existence of Quark Gluon Plasma.
In the hot-dense QCD medium produced in heavy ion collision, when the temperature is well
above the critical temperature, theJ/ψand it’s excited states are expected to melt. This was
first predicted by Matsui and Satz in 1986 [13]. If a QGP medium is formed, production of
J/ψand other quarkonium bound states would be suppressed by color screening. Suppression
does not imply thatc¯cwas not produced, but rather a depletion of the observedJ/ψ’s relative
to the expected yield either because c¯c pair fails to form a J/ψ or J/ψ itself is destroyed
Figure 2.9: c¯cpair potential energy in (a) vacuum and (b) in QGP [34].
deconfinement and phase transition.
In a medium of charged particles Debye screening occurs when the interactions of one
charge is reduced or canceled through screening by the surrounding medium. The idea was
taken from electro-magnetic interactions but it applies to color-charge as well. Inside QGP,
since quarks are freely floating, we would expect a color-screened coulombic potential [34],
V(r) =−αef f
r exp[−r/λD] (2.5)
where λD is called the Debye screening radius, the radius at which the effective charge of
a particle is reduced by a factor of 1/e. Fig. 2.9 shows the potential energy between a
charm and anti-charm quark in vacuum and QGP. Note that the linear term in the (Eq. 1.1)
of quark potential model, would disappear as the plasma temperature T approaches the
transition temperature. When the screening radiusλD becomes less than the binding radius
rJ/ψ of theJ/ψ bound state, the confining force can no longer hold the quarks together and
deconfinement sets in. This phenomena is true for any other quarkonia (qq¯) states as well.
Lattice QCD also predicted the presence of strong screening above deconfinement,
de-termined from the free energy of a static quark-antiquark pair [35]. The dissociation
Table 2.1: Dissociation temperature TD/Tc for quarkonia inferred from lattice QCD
calcu-lations [35].
Resonance J/ψ χc(1P) ψ0 (2S) Υ (1S) χb (1P) Υ (2S) χb (2P) Υ (3S)
TD/Tc 2.10 1.16 1.12 ≥4.0 1.76 1.60 1.19 1.17
in Table. 2.1. However, the picture as laid out by Matsui and Satz “We thus conclude,
that there appears to be no mechanism for J/ψ suppression in nuclear collisions except the
formation of a deconfining plasma, and if such a plasma is produced, there seems to be no
way to avoid J/ψ suppression”, is not entirely correct, because there are also other possible
effects as discussed next, which also could lead to suppression of J/ψ.
Recombination of J/ψ
Recent theoretical models predict that the J/ψ yield would be enhanced due to the
recombination of uncorrelated cc¯pairs at RHIC energy, where these charm quarks are in
abundance created by many nucleon-nucleon collisions [36, 37, 38]. In this scenario, it is
assumed that the number of J/ψ is from recombination is approximately proportional to
N2
c/Nh, where Nc and Nh are the number of created charm quarks and produced hadrons.
Though the relative scale is unknown but this effect is not negligible at RHIC energies
because charm production cross section increases faster with√sand scales with the number
of nucleon-nucleon collisions. In some statistical models it is assumed that the initially
produced J/ψ’s from hard scattering are all dissociated in QGP and those which observed
experimentally are mainly due to regeneration from charm and anti-charm quarks in the
QGP [39]. It is difficult to discriminate the two models based on the finally produced J/ψs.
It should be noted that the charm production, such as cross section as function of charmpT,
rapidity and its modification in hot and dense medium need to be understood first in order
to study the recombination of J/ψ. At RHIC energy, the charm production cross-section
is factor ∼2 compared to theory calculations and the rapidity shape is flatter than that
that charm quarks loose sufficient energy in hot dense medium [41]. These effects needed to
be well accounted for before predicting the regenerations in heavy ion collisions.
Comover Interactions of J/ψ
The comover scattering of charmonia is an additional absorption of charmonia states
by secondary hadrons, called comovers, which occurs in the hadronic phase [42, 43]. The
survival probability of charmonia,Sco, can be expressed as follows:
Sco=exp(−
Z
dτ ρco(τ)σcov) (2.6)
Where ρco(τ) is the comover density at the proper time τ, σco is the charmonium
absorp-tion cross secabsorp-tion by comovers and v is the velocity of charmonium relative to a comover.
Although it is difficult to theoretically model the dissociation cross section of J/ψ with
co-mover’s model, there are few models which takes into account the dissociation process by
comovers, and can reproduce the J/ψ suppression at SPS energies with dissociation cross
section σco of 0.65 mb [44, 45].
Furthermore, directly produced J/ψ with high pT may escape from QGP produced
in heavy ion collisions without any interaction, which is called “leakage effect”. Another
physical effect that has been proposed is that of initial state parton energy loss. In a recent
calculation [46], the initial-state parton energy loss is presented and its impact on J/ψ
production in p+A collisions. In the case of initial-state radiative energy loss, they modeled
∆E/E∝L2, assuming a quadratic path dependence for energy loss.
2.5 Experimental J/ψ Measurements
To date, chamonia productions and their suppression have been extensively studied
experimentally at various particle colliders. In 1980’s various experiments were carried out
at Alternating Gradient Synchrotron (AGS) at BNL and Super Proton Synchrotron (SPS) at
the European Center for Nuclear Research (CERN) [47, 32, 48]. The RHIC at BNL started
operations at the highest level of energy ever achieved by any other experiments [49, 50].
Table. 2.2 shows a list of the collider experiments. In the next sections a brief review of
experimental J/ψ studies from those experiments are discussed.
Table 2.2: Particle collider experiments.
Accelerator Collision energies Collision species
per nucleon
AGS (BNL, 1986-) ∼5 GeV p+A,O+A,Si+A,Au+Au
SPS (CERN, 1986-) 17.3, 19.4 GeV p+A,S+U,P b+P b, In+In
Tevatron (FNAL) (1987-2011) 39 - 1.8 TeV p+ ¯p p+Be,p+F e,p+W
RHIC (BNL, 2000-) 39, 62.4, 200, p+p,d+Au, Au+Au, Cu+Cu,
500 GeV Cu+Au, U +U
LHC (CERN, 2008-) 2.76, 5.5, 7 TeV p+p, P b+P b,p+P b
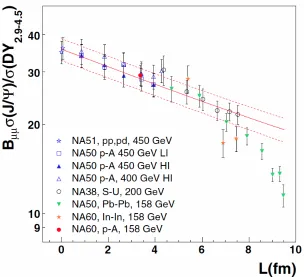
SPS Measurements
The NA38, NA50, NA51 and NA60 experiments at the CERN-SPS studied J/ψ
pro-duction in light and heavy-ion collisions through their decay into dimuon pairs [47, 32, 48].
Nuclear targets include Be, Au, Cu, Ag, W, O, U and Pb with proton beams. The
pro-duction cross-section was extracted relative to the propro-duction of Drell-Yan (DY) pairs. It is
assumed that the DY production gets scaled with the number of inelastic nucleon-nucleon
collisions without any modifications. Fig. 2.10 shows the J/ψ production relative to DY as
a function of the effective path lengths of J/ψ’s in nuclear collisions. As seen in the figure,
except for the centralP b+P bcollisions, the relativeJ/ψcross-section follow an exponential
function, which suggests that the nuclear absorption was the cause for modifying the J/ψ
yield. An absorption cross-section of σabs =4.18±0.35 mb was extracted for SPS [51]. A
clear deviation of J/ψ suppression from the normal nuclear absorption pattern is seen for
Figure 2.10: J/ψ production relative to DY production as a function with path Length L
for several collision systems. Normal nuclear absorption pattern is also shown in solid line.
A clear deviation from normal nuclear absorption is seen for P b+P b collision.
The additional suppression in P b+P b collisions suggests a medium similar to Quark Gluon
Plasma was formed in heavy ion collisions.
Fermilab Measurements
Fermilab E866/NuSea measured J/ψ and ψ0 nuclear dependence for proton-nucleus
collisions, while throwing proton beams on Be, Fe and W fixed targets at √s=39 GeV [52].
As shown in Fig. 2.11, the nuclear modification factor α decreases at higher xF. The xF
is Feynman x which refers to the fraction of the maximum allowed momentum that the
J/ψ or cc¯ have, or roughly speaking how fast they are going. The nuclear modification
α was obtained assuming the cross-section dependence on the nuclear mass, A, has the
functional form, σA = σN ×Aα, where σN is the cross-section of a nucleon. As can be
Figure 2.11: nuclear modifications for J/ψ and ψ0 vs xF at E866/NuSea experiments [52].
becomes comparable to that for the J/ψ for xF >0.6. The J/ψ nuclear modification α can
be represented for convenience by a simple parametrization α(xF) = 0.960(1−0.0519xF +
0.338x2
F).
RHIC measurements
At the RHIC collider J/ψ production has been measured by the PHENIX and STAR
experiments [53, 54]. In PHENIX measurements, the J/ψyield atp+pwas used as baseline
measurement and relative modifications in d+Au and Au+Au are used to quantify the
nuclear modifications e.g. CNM and QGP effects on J/ψ production [26, 55, 56]. At
mid-rapidity (|y|<0.35),J/ψwas measured viae−e+pairs and at forward and backward rapidity
(1.2 < |y| < 2.2) via µ+µ− pairs. PHENIX p+p results are shown in Fig. 2.5 for J/ψ
differential cross section times di-lepton branching ratio over a very wide rapidity range of
acceptance. The data slightly favors a flatter distribution at mid-rapidity. The total cross
section times the branching ratio determined forJ/ψproduction in 200 GeVp+pcollisions is
Bllσ J/ψ
p+p collisions. Mid-rapidity measurements were scaled up by 103 for a visual clarity. The
theoretical curves show that, the next-to-leading order of NRQCD was able to successfully
reproduce both the rapidity and pT distribution in p+p collisions at RHIC.
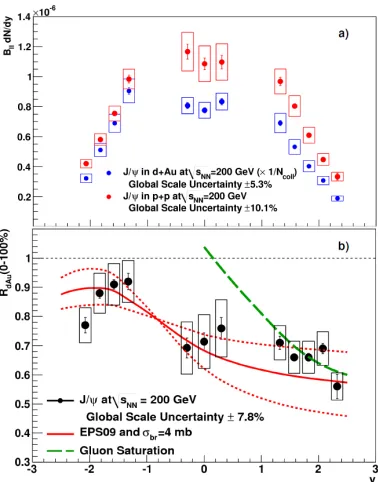
Phenix recorded d+Au collisions at√s =200 GeV in order to study cold nuclear matter
effects. The modification ofJ/ψ yield due to the nuclear target provides important insights
into the evolution ofqq¯pairs through nuclear matter. PHENIX wide acceptance in kinematic
phase-space, rapidity andpT provides a unique opportunity to study the nuclear environment
over a broad kinematic range in order to disentangle different mechanisms. It was found that
J/ψ is significantly suppressed in the deuteron going direction compared to p+p collisions
scaled by the number of binary collisions:
RdAu =
1
hNcolli
dσdAu/dy
dσpp/dy (2.7)
where hNcolli is the average number of nucleon-nucleon collisions and is determined from
Glauber simulations [57]. The top panel of Fig. 2.12 shows the J/ψrapidity yields ind+Au
minimum bias (MB) collisions scaled byhNcollialong-withp+pyields for comparison. A clear
suppression can be seen at forward rapidity, the bottom panel shows the nuclear modification
factorRdAat
√
s=200 GeV. A model prediction, including the nPDF shadowing from EPS09
parametrization and an absorption cross section of σabs = 4 mb is also shown in the same
figure. A higher suppression ofJ/ψ is observed as one goes in the forward direction (in the
d-going direction), corresponding to a region sensitive to initial state low-x gluons in the Au
nucleus. The value of the break-up cross section is consistent within uncertainties with that
measured in SPS [55].
Measuring J/ψ modifications in heavy ion collisions (A+A) can help us quantify the
color screening length in the QGP. In order to quantify those hot nuclear matter effects,
PHENIX also measured the J/ψ modification in Au+Au collisions. But before extracting
the QGP effects onJ/ψproduction, a detailed understanding of the baselineJ/ψproduction,
Figure 2.12: (a) J/ψ rapidity distribution in p+p and d+Au collisions and a higher
sup-pression can be seen at forward rapidity than backward rapidity. (b) RdAu nuclear
modifi-cations [55].
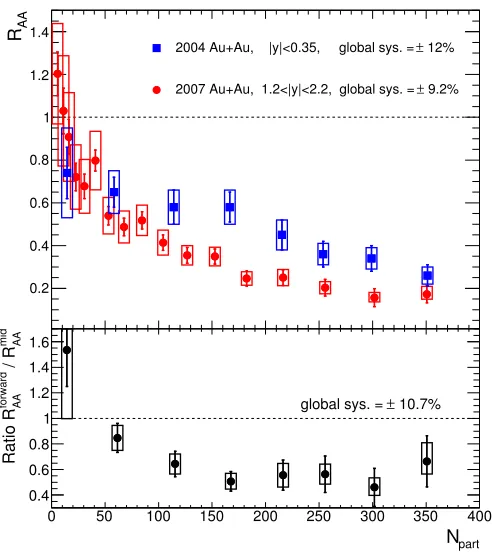
modification factor as a function of number of participant nucleons at √s=200 GeV [56].
RAA =
1
hNcolli
dNA+A/dy
dNp+p/dy (2.8)
A strong suppression by a factor of 4 and 6 is observed in central collisions at mid and
forward rapidity respectively. However, the observed PHENIX RAA is at the similar level to
that seen in the NA50 experiment. This was very surprising, since the RHIC energy density
is much higher than that achieved by SPS and a higher suppression was expected. Adding
more to the puzzle, the forward-rapidity suppression is higher than that at mid-rapidity. The
ratio of forward/mid rapidity RAA first decreases then reaches about 0.6 for Npart > 100.
This contradicts simple energy density picture of suppression, where the energy density is
supposed to be higher at mid-rapidity than forward rapidity. Hence a less J/ψ suppression
0 50 100 150 200 250 300 350 400
AA
R
0.2 0.4 0.6 0.8 1 1.2 1.4
12%
±
2004 Au+Au, |y|<0.35, global sys. = 9.2%
±
2007 Au+Au, 1.2<|y|<2.2, global sys. =
part
N
0 50 100 150 200 250 300 350 400
mid AA
/ R
forward AA
Ratio R
0.4 0.6 0.8 1 1.2 1.4 1.6
10.7%
±
[image:46.612.181.427.73.349.2]global sys. =
Figure 2.13: J/ψnuclear modification factorRAAas a function of number of participants for
Au+Au collisions. Blue points are mid-rapidity points and red points are forward-rapidity
points [56].
puzzle for theorists.
LHC measurements
The LHC collider, started its operation at 2010 in much higher energy regime than any
particle collider ever built. In 2010, four experiments CMS, ALICE, ATLAS and LHCb
collected data at 7 TeV p+p and 2.76 TeV P b+P b collisions [49, 50]. It is obvious that
at this energy, the medium created by heavy ion collisions was well above the critical
tem-perature. In particular, at the energies available at LHC a large number of heavy quarks
are produced which could lead to an increased production of quarkonia via statistical
re-combination. Hence, in addition to CNM and QGP effects on J/ψ production a significant
Figure 2.14: The nuclear modification
factor of promptJ/ψas a function of
[image:47.612.316.495.86.265.2]cen-trality [49].
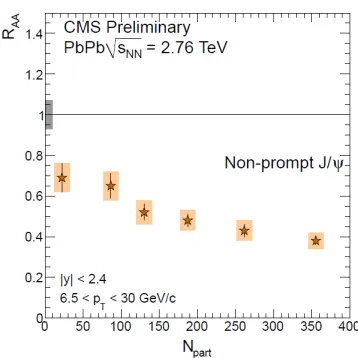
Figure 2.15: The nuclear modification
factor of non-prompt J/ψ as a function
of centrality [49].
The CMS experiment is the first experiment to be able to separate non-prompt and
prompt J/ψ production in heavy ion collisions through the dimuon channel. Non-prompt
J/ψ’s from b-hadron decays and prompt J/ψ’s were separated by a two dimensional fit to
the invariant mass and the transverse distance between the collision vertex and reconstructed
secondary vertex of the µ+µ− pair [49]. Fig. 2.14 shows a strong centrality-dependent
sup-pression for prompt and non-prompt J/ψ. In peripheral P b+P b collisions, the suppression
is three times smaller than in the most central collisions. A high-pT J/ψ measurement by
STAR at RHIC shows much smaller suppression, while the suppression is similar to the one
measured by PHENIX. The ALICE RAA measurement of low-pT inclusive J/ψ’s at forward
rapidity shows almost no centrality dependence [58]. It is noteworthy that the difference
between the strong suppression measured at high-pT J/ψ and low-pT J/ψ, might be a sign
of significant recombination.
At LHC energies the inclusive J/ψ yield would contain a significant non-prompt
longer than the formation of QGP (∼ 10f m/c), this contribution should not suffer from
color screening. Instead the reduction in the non-promptJ/ψ yield could reflect the b-quark
energy loss in the medium. Fig. 2.15 shows that non-promptJ/ψ’s are also suppressed by a
factor of ∼2.6 with respect to thep+pcollisions for the central collision.
2.6 Motivation For This Study
The motivation for this study is to perform a systematic study of hot and dense matter
created in heavy-ion collisions at RHIC. As discussed in previous sections, the J/ψ
sup-pression is surprisingly similar in SPS, RHIC and LHC. The consensus is that the different
competing effects contributing to the modification of J/ψ yields varies with energy, but
their cumulative of those effects might be similar at those measured energies. In order to
distinguish those effects, as well as to determine the onset of the quark gluon plasma, we
need measurements at a very wide range of energies. There are energy gaps between SPS
(∼ 20GeV) to RHIC (∼ 200GeV) to LHC (∼ 2.6T eV). The RHIC energy scan program,
started in 2010, provides a unique opportunity to study J/ψ production in heavy ion
colli-sions as a function of medium energy density and system sizes by exploring the energy gap
between SPS and RHIC. This effort is crucial for quantifying the significance of J/ψ as a
probe for studying the signatures of the formation of Quark Gluon Plasma in relativistic
heavy ion collisions. During 2010, PHENIX recorded 600 million Au+Au MB events over
three weeks of running at√sN N = 62.4 GeV and 200 million MB events at 39 GeV. In this
study, the details of the analysis and results ofJ/ψ measurement at PHENIX muon arm at
CHAPTER 3
EXPERIMENT
3.1 RHIC
The Relativistic Heavy Ion Collider (RHIC) located at Brokhaven National Laboratory,
NY, is a hadron collider, made to accelerate a wide variety of nuclei and ions from protons
to deuterium, copper, gold and uranium ions. It started its operation in 2000. The main
purpose of RHIC is to recreate the extreme densities and temperature of the hadronic matter
and study their properties. Early investigations of such experimental facilities at Berkeley
Bevalac (1975-1985), the BNL AGS (1987-1995) and the CERN SPS (1987-present) have
reached their culmination with the commissioning of BNL’s RHIC, a dedicated facility for
the study of nuclear collisions at ultra-relativistic energies. A schematic view of RHIC is
in Fig. 3.1. At the beginning, four RHIC experiments BRAHMS, PHENIX, PHOBOS and
STAR were built at four of the six intersection points to study these collisions.
• BRAHMS: Broad RAnge Hadron Magnetic Spectrometers Experiment.
• PHENIX: Pioneering High Energy Nuclear Interaction eXperiment.
• STAR: Solenoidal Tracker at RHIC
• PHOBOS: Named after the moon of Mars.
RHIC has been able to deliver collisions with the different nuclei species (Au+Au,
Cu+Cu, d+Au) at over a wide range of center of mass energies, √s=7-200 GeV, as well as
protons up to√s= 500 GeV. The RHIC complex consists of Tandem Van de Graaff, Booster
Accelerator, Linear Accelerator Complex (LINAC), Alternating Gradient Synchrotron (AGS)
and the main rings of the Relativistic Heavy Ion Collider (RHIC). The process for accelerating
then by the Booster Synchrotron up to 95 MeV and finally by the Alternating Gradient
Synchrotron (AGS) to 10.8 GeV and then the beam get injected into RHIC’s blue and
yellow rings. At this stage heavy ions have been stripped of all the electrons and are finally
accelerated to the desired energies at RHIC ring.
Four experiments start taking data in 2000. By 2006 BRAHMS and PHOBOS had
achieved their physics goals and have been decommissioned. Among current experiments,
PHENIX is designed specially to measure electrons, muons and photons from rare probes
and STAR is designed to use a large time projection chamber to track charged particles over
a large geometrical acceptance.
3.2 PHENIX Experiment
The PHENIX experiment probes several fundamental features of the strong interaction.
PHENIX is able to probe different phases of heavy ion collisions by virtue of it’s ability to
measure the rare processes that involves photons, electrons and muons as well the
predom-inant hadronic production. A recent photograph of PHENIX detector is shown in Fig. 3.2.
The PHENIX detector consists of a number of subsystems which can be categorized into four
groups: beam detectors, magnets, central arms and muon arms. The beam detectors are
used for triggering and event characterization. One central magnet and two muon magnets
generate magnetic fields to enable us to measure the momenta of charged particles [59]. The
rapidity coverage and azimuthal acceptance of this subsystem is given in Table 3.1. They
consist of Zero-Degree Calorimeters (ZDC) and Beam- Beam Counters (BBC). A pair of
ZDC’s detect neutrons from grazing collisions and form a trigger for the most peripheral
collisions. The ZDC is used by all four RHIC detectors. A pair of BBCs provide a measure
of the time-of-flight of forward particles to determine the time of a collision, provide a trigger
for the more central collisions and provide a measure of the collision position along the beam
axis [60]. A side view of the PHENIX detectors are shown in Fig 3.3. The top panel shows
the central arm, which located on each side of the interaction region and consist of
Figure 3.2: PHENIX detector.
outermost subsystem on the central arms and provides measurements of both photons and
energetic electrons. The rapidity coverage of the central arm is |η| < 0.35. It includes the
Drift Chamber (DC), two layers of Pad Chambers (PC1 and PC3), Ring Imaging Cerenkov
Counter (RICH), Time Expansion Chamber (TEC), Time of Flight detector (TOF) and
Electromagnetic Calorimeter (EMCal) [61, 62, 63]. The bottom panel of Fig. 3.3 shows the
muon arms, which optimized for detection of muons in the forward and backward rapidity
regions (1.2<|η| <2.4). Each arm consists of a Muon Tracker (MuTr), a Muon Identifier
(MuID) and Resistive Place Chambers (RPC) [64]. The beam pipe is at the center and is
76 mm in diameter and 1.0 mm in thickness. Since this work is based on the J/ψ
analy-sis through the dimuon channel detected in the muon arms, we are only going to discuss
PHENIX muon arm detectors in detail. Details about central and global detectors can be
West
South Side View Beam View PHENIX Detector 2010 North East MuTr MuID MuID RxNP HBD MPC RxNP HBD PbSc PbSc PbSc PbSc PbSc PbGl PbSc PbGl TOF-E PC1 PC1 PC3 PC2 Central Magnet Central Magnet North Muon Mag net Sou th M uo n M agn et TEC PC3 BBC MPC BB RICH RICH DC DC ZDC North ZDC South Aerogel
TOF-W 7.9 m
=
26 ft
10.9 m
= 36 ft
[image:53.612.163.451.175.551.2]18.5 m = 60 ft
Figure 3.3: PHENIX detector configuration during Run-10. Top half is the XY plane view
![Figure 1.3: Running coupling constant as a function of Q [4]](https://thumb-us.123doks.com/thumbv2/123dok_us/9220733.990083/22.612.113.490.177.582/figure-running-coupling-constant-function-q.webp)
![Figure 2.11: nuclear modifications for J/ψ and ψ′ vs xF at E866/NuSea experiments [52].](https://thumb-us.123doks.com/thumbv2/123dok_us/9220733.990083/43.612.122.479.74.318/figure-nuclear-modications-j-ps-ps-nusea-experiments.webp)