ScholarWorks @ Georgia State University
ScholarWorks @ Georgia State University
Mathematics Theses Department of Mathematics and Statistics
Spring 4-19-2013
Antiretroviral Regimens in HIV-Infected Adults Receiving Medical
Antiretroviral Regimens in HIV-Infected Adults Receiving Medical
Care in the United States: Medical Monitoring Project, 2009
Care in the United States: Medical Monitoring Project, 2009
Yunfeng Tie
Follow this and additional works at: https://scholarworks.gsu.edu/math_theses
Recommended Citation Recommended Citation
Tie, Yunfeng, "Antiretroviral Regimens in HIV-Infected Adults Receiving Medical Care in the United States: Medical Monitoring Project, 2009." Thesis, Georgia State University, 2013.
https://scholarworks.gsu.edu/math_theses/128
This Thesis is brought to you for free and open access by the Department of Mathematics and Statistics at ScholarWorks @ Georgia State University. It has been accepted for inclusion in Mathematics Theses by an authorized administrator of ScholarWorks @ Georgia State University. For more information, please contact
CARE IN THE UNITED STATES: MEDICAL MONITORING PROJECT, 2009
by
YUNFENG TIE
Under the Direction of Gengsheng Qin
ABSTRACT
Effective antiretroviral therapy (ART) is essential for viral suppression (VS) in HIV-infected
patients. However, there is a lack of nationally representative data on types of ART regimens
used and their impact on VS. This thesis used self-reported interview and abstracted medical
record from 2009 Medical Monitoring Project (MMP) to study ART regimen type and related
health outcomes. Results showed that 88.6% of HIV-infected adults in care was prescribed ART,
and about half took regimens designated as ‘preferred’ according to U.S ART guidelines. Among
MMP participants prescribed ART, 62.7% achieved durable VS, 77.8% achieved recent VS,
83.5% were 100% dose-adherent, and 17.1% reported side effects. Multivariate regression
analyses revealed that although ART was critical for VS, there were minor differences in health
outcomes among the major ART classes in the U.S. ART guidelines or six most-commonly used
regimens. This study could be potentially useful for future strategic planning of HIV care.
CARE IN THE UNITED STATES: MEDICAL MONITORING PROJECT, 2009
by
YUNFENG TIE
A Thesis Submitted in Partial Fulfillment of the Requirements for the Degree of
Master of Science
in the College of Arts and Sciences
Georgia State University
Copyright by Yunfeng Tie
CARE IN THE UNITED STATES: MEDICAL MONITORING PROJECT, 2009
by
YUNFENG TIE
Committee Chair: Dr. Gengsheng Qin
Committee: Dr. Emma L. Frazier
Dr. Ruiyan Luo
Electronic Version Approved:
Office of Graduate Studies
College of Arts and Sciences
Georgia State University
ACKNOWLEDGEMENTS
First, I want to express my sincere appreciation to Dr. Jacek Skarbinski, my team leader at
Clinical Outcomes Team (COT), Division of HIV/AIDS Prevention, CDC, for his generosity in
allowing me use the Medical Monitoring Project (MMP) data for my thesis and for all his
valuable guidance on setting up, implementing, and assessing the thesis topic. I would like to
thank my advisor at GSU—Dr. Gengsheng Qin and advisor at CDC—Dr. Emma L. Frazier for
all of their patience, encouragement, and guidance. They provided me freedom, as well as
supports throughout my degree period. I have learned so much from them, which can be of
benefit for my career as well as for my whole life. I am also very thankful to my other committee
member, Dr. Ruiyan Luo, for her interest, advice and critical review of my thesis. A “Thank
you!” note should be given to my team members at COT, especially Dr. Shuyan Zhang and Dr.
Christopher Johnson. Their wisdom and enthusiasm have been a great encouragement to me.
Finally, the supports from my family are greatly appreciated. Without the trusts and supports
from my family, I wouldn’t have made it this far.
Best wishes to everyone who had supported me! I hope one day I will be able to help them as
TABLE OF CONTENTS
ACKNOWLEDGEMENTS.……….... iv
LIST OF TABLES..……….. vii
LIST OF FIGURES...………... ix
LIST OF ABBREVIATIONS……….. x
CHAPTER 1 INTRODUCTION.……….…….……….. 1
1.1 HIV/AIDS...……….……….…….……….. 1
1.1.1 Background on HIV/AIDS…...……….…….…… 1
1.1.2 HIV/AIDS in the United States....……….…….……… 2
1.1.2.1 Persons Living with a Diagnosis of HIV Infection……….…….……… 2
1.1.2.2 Persons Living with an AIDS Diagnosis ………...……….…….……… 2
1.1.2.3 HIV Incidence……… ………...……….…….……… 2
1.1.3 Current HIV/AIDS Treatments....……….…….……… 2
1.2 Data Source..……….……….. 5
1.2.1 Background of MMP...……….…….……… 5
1.2.1.1 Sampling Design of MMP ……….…….………. 5
1.2.1.2 Data Collection ……….…….…….………. 6
1.2.2 Sources of Error in the MMP..……….…….……… 9
1.2.3 Design Variables Related to Data Analysis.……….….……… 11
1.3 Purpose of Study……….……… 11
CHAPTER 2 METHODS..……….……… 13
2.1.1 Facility and Participant Response Rates….……….….……… 13
2.2 Study Variables ……….………... 14
2.2.1 Characteristics of Participants (Self-reported)….….………... 14
2.2.2 ART Treatment and Adherence to ART (Self-reported).….….……… 14
2.2.3 MRA Variables……….……….….……… 18
2.3 Statistical Analysis.……….……… 19
CHAPTER 3 RESULTS……….………. 21
3.1 Frequencies and Descriptive Statistics...……….. 21
3.1.1 General Characteristics………. 21
3.1.2 Characteristics of Clinical Status………...………... 24
3.1.3 Characteristics of HIV/AIDS Treatments.………... 25
3.2 Detail Categories of ART Regimens ………... 27
3.3 Factors Associated with Major ART Regimens Groups ………... 32
3.4 Comparison of ART Regimens………...……… 34
3.4.1 Comparison of Major Regimen Types ………...………... 34
3.4.2 Comparison of Top Six Popular Regimens………...………... 36
CHAPTER 4 DISCUSSIONS….……….…….………... 51
CHAPTER 5 STUDY LIMITATIONS...……….……….. 58
CHAPTER 6 CONCLUSIONS….……….…….……… 59
REFERENCES...….……….…….……...
…
LIST OF TABLES
Table 2.1 Mapping of interview/MRA variables to commercial available medicines 15
Table 2.2 Initial antiretroviral regimens for antiretroviral therapy in naïve patients 17
Table 3.1 General characteristics of HIV-infected adults receiving medical care in the
United States—Medical Monitoring Project, 2009
22
Table 3.2 Characteristics of clinical status of HIV-infected adults receiving medical care
in the United States—Medical Monitoring Project, 2009
24
Table 3.3 Characteristics of ART treatments of HIV-infected adults receiving medical
care in the United States—Medical Monitoring Project, 2009
26
Table 3.4 Comparison of individual self-reported and prescribed ART regimens of HIV-
infected adults in MMP 2009 data
30
Table 3.5 Most recently prescribed ART regimens of HIV-infected adults receiving
medical care in the United States—Medical Monitoring Project, 2009
31
Table 3.6 Correlation of major ART regimen groups and demographic characters of patients
receiving medical care for HIV infection—Medical Monitoring Project, 2009
32
Table 3.7 Logistic regression model of factors associated with prescription of preferred-
regimens—Medical Monitoring Project, 2009
33
Table 3.8 Crude comparison of major regimens by outcomes of interest—Medical
Monitoring Project, 2009
37
Table 3.9 Logistic regression models of factors associated with viral suppression in patients
receiving ART prescription—Medical Monitoring Project, 2009
Table 3.10 Logistic regression models of factors associated with dose-adherence and side
effect in patients receiving ART prescription—Medical Monitoring Project, 2009 40
Table 3.11 Crude comparison of top six popular regimens by outcomes of interest—
Medical Monitoring Project, 2009
45
Table 3.12 Logistic regression models of factors associated with viral suppression in patients
receiving top six popular ART regimens—Medical Monitoring Project, 2009
45
Table 3.13 Logistic regression models of factors associated with dose-adherence and side
effect in patients receiving top six popular ART regimens—Medical Monitoring
Project, 2009
48
Table 4.1 Crude comparison of prescription vs. medication by outcomes of interest—
Medical Monitoring Project, 2009
LIST OF FIGURES
Figure 1.1 Weighted percentage of sampled patients receiving medical care in the United
States—Medical Monitoring Project, 2009
7
Figure 3.1 Self-reported and most recently prescribed ART regimens of HIV-infected
patients receiving medical care in the United States—Medical Monitoring Project,
2009
29
Figure 6.1 Number and percentage of HIV-infected persons engaged in selected stages of
the continuum of HIV care—United States, 2009
LIST OF ABBREVIATIONS
3TC Epivir, Lamivudine
ABC Abacavir, Ziagen
ABC/3TC Epzicom
ABC/3TC/AZT Trizivir
AIDS Acquired immunodeficiency syndrome
APV Agenerase, Amprenavir
ATV Atazanavir, Reyataz
AZT Azidothymidine, Retrovir, ZDV, Zidovudine
AZT/3TC Combivir
d4T Stavudine, Zerit
ddC Dideoxyinosine, Hivid, Zalcitabine
ddI Didanosine, Dideoxycytidine, Videx
DLV Delavirdine, Rescriptor
DRV Darunavir, Prezista, TMC 114
EFV Efavirenz, Sustiva
ETV Etravirine, Intelence, TMC 125, ETR
FEI Fusion/entry inhibitor
FPV Fosamprenavir, FOS-APV
FPV Lexiva
FTC Emtricitabine, Emtriva
FTC/TDF/EFV Atripla
HIV Human immunodeficiency virus
IDV Indinavir, Crixivan
INI Integrase inhibitor
LPVr Lopinavir with Ritonavir boosted, Aluvia, Kaletra, Meltrex
MMP Medical Monitoring Project
MVC Celsentri, Celsentri, Maraviroc, Selzentry, UK-427857
NFV Nelfinavir, Viracept
NNRTI Non-nucleoside reverse transcriptase inhibitor
NRTI Nucleoside analogue reverse transcriptase inhibitor
NTI Reverse transcriptase inhibitor
NVP Nevirapine, Viramune
PI Protease inhibitor
RAL Isentress, MK-0518, Raltegravir, RGV, MK-0518
RTV Ritonavir, Norvir
SQV Saquinavir, Fortovase, Invirase, SQV-HGC
T20 Enfuvirtide, Fuzeon
TDF Tenofovir, Viread
CHAPTER 1 INTRODUCTION
1.1 HIV/AIDS
1.1.1 Background on HIV/AIDS
Since 1981 when the first case of the acquired immunodeficiency syndrome (AIDS) was
recognized by Centers for Disease Control and Prevention (CDC) in the United States [1], AIDS
has caused nearly 30 million deaths as of 2009 [2]. AIDS is now the fourth-biggest killer
globally. Up to 2010, approximately 34 million people were living with human
immunodeficiency virus infection (HIV)—the cause of AIDS [3, 4]. AIDS is a pandemic—a
disease that is actively spreading globally [5].
Genetic research has suggested that HIV originated in west-central Africa during the early
twentieth century [6]. The initial stage after the contraction of HIV is called acute HIV,
following by a period of clinical latency, it develops to chronic HIV. Without treatment, the
clinical latency can last from about three years to over 20 years [7], with an average of about
eight years. HIV will eventually progress to AIDS, defined by either a CD4+ T cell count below
200 cells/µL or the occurrence of specific diseases [8]. In 2008, CDC has updated the
classification system for HIV into three stages based on CD4 count and clinical symptoms [9]:
Stage 1: CD4 count ≥ 500 cells/µL and no AIDS defining conditions
Stage 2: CD4 count 200 to 500 cells/µL and no AIDS defining conditions
Stage 3: CD4 count ≤ 200 cells/µL or AIDS defining conditions
Major transmission pathways of HIV include unprotected sexual intercourse, contaminated
blood transfusions, and from mother to child through pregnancy, delivery, or breastfeeding [10].
Therefore, a key strategy for the prevention of HIV is to promote safe-sex behaviors and
1.1.2 HIV/AIDS in the United States
1.1.2.1 Persons Living with a Diagnosis of HIV Infection
At the end of 2009, an estimated 1,148,200 persons aged 13 and older were living with HIV
infection in the United States, including 207,600 (18.1%) persons whose infections had not been
diagnosed [11]. The estimated number of persons living with a diagnosis of HIV infection in the
46 states and 5 U.S. dependent areas with confidential name-based HIV infection reporting was
803,771. In the 46 states only, this included 781,756 adults and adolescents, and 2,945 children
aged less than 13 years at the end of the year [11].
1.1.2.2 Persons Living with an AIDS Diagnosis
At the end of 2009, the estimated number of persons living with an AIDS diagnosis in the
United States and 6 U.S. dependent areas was 487,968. In the 50 states and the District of
Columbia, this included 476,186 adults and adolescents, and 546 children aged less than 13 years
at the end of the year [11].
1.1.2.3 HIV Incidence
The estimated incidence of HIV has remained stable overall in recent years, at about 50,000
new HIV infections per year [12]. Within the overall estimates, however, some groups are
affected more than others. For instance, MSM continue to bear the greatest burden of HIV
infection [12].
1.1.3 Current HIV/AIDS treatments
Currently, there is no cure or effective vaccine for HIV or AIDS [13]. However, modern
clinical treatments are available to extend and improve the lives of patients infected with HIV.
anticancer agent, was the first antiretroviral drug for treating AIDS approved by the U.S. Food
and Drug Administration (FDA) in 1987. HIV is a member of retroviruses that possess complex
genomes and exhibit cone-shaped capsid core particles [14, 15]. As a characteristic of all
retroviruses, HIV's genome is encoded by RNA. The virus replication cycle starts with the
binding to CD4 on the cell surface, and then followed by fusion into the cell membrane [16, 17],
reverse transcription catalyzed by reverse transcriptase, integration catalyzed by integrase, and
viral maturation operated by protease [18, 19]. Therefore, four categories of HIV drugs—
targeting at four important stages of viral replication cycle, have been developed. They are
entry/fusion inhibitors (EFI), reverse transcriptase inhibitors (NTI, including non-nucleoside
reverse transcriptase inhibitor (NNRTI) and nucleoside analogue reverse transcriptase inhibitor
(NRTI)), integrase inhibitors (INI), and protease inhibitors (PI). FDA has approved nine NRTIs,
including zidovudine (AZT), tenofovir (TDF), lamivudine (3TC), emtricitabine (FTC), abacavir
(ABC), zalcitabine (ddC), didanosine (ddI), stavudine (d4T), apricitabine (ATC), and five
NNRTIs, including rilpivirine (RPV), etravirine (ETV), delavirdine (DLV), efavirenz (EFV) and
nevirapine (NVP) [20]. The PIs are saquinavir (SQV), amprenavir (APV, off-market now),
fosamprenavir (FOS-APV), indinavir (IDV), nelfinavir (NFV), ritonavir (RTV), atazanavir
(ATV), lopinavir (LPV), darunavir (DRV) and tipranavir (TPV) [20]. EFI and INI are relatively
new categories of HIV drugs. There are one fusion inhibitor, enfuvirtide (T-20), one entry
inhibitor, maraviroc (MVC) and one INI, raltegravir (RAL) available on the market [20]. In
1996, combination antiretroviral treatment, known as Highly Active Antiretroviral Therapy
(HAART), was proposed for its high effectiveness against HIV. Many clinical studies had shown
that HAART substantially reduce the death rate and illness caused by AIDS, including [21-24].
of antiretroviral agents [25, 26]. Typically two NRTIs form the backbone of the treatment and
then enhanced with one more NNRTI or one PI or one INI [25].
Clinical interventions, such as ART, can delay the progression to AIDS and prolong life after
HIV infection. ART regimens significantly improves current life qualities and decreases the risk
of opportunistic infections and cancer—two major causes of death from HIV/AIDS, which
probably are the result of the progressive failure of the immune system [27-30]. For instance,
there is a 70% reduced risk of acquiring tuberculosis with treatment [25]. In the developing
world treatment also improves physical and mental health [31]. Moreover, timely treatment
reduces the risk of transmission, including both sexual partners’ transmission and
mother-to-child transmission [25]. The United States recommends ART treatment for all HIV-infected
people regardless of CD4 count or symptoms [32].
The effectiveness of treatment largely depends on adherence [33]. Therefore, accessibility of
medical care, strength of social supports, as well the quality of treatment regimens (complexity
and adverse effects), play important roles in controlling HIV [34, 35].
This thesis takes advantages of Medical Monitoring Program (MMP), a unique surveillance
program that combined personal interviews and medical records, to study the status of HIV
treatment and health conditions of HIV patients receiving medical care in the United States. The
information gathered here are nationally representative; therefore, they can be valuable for
reviewing the quality of current medical services of HIV/AIDS, strategic prevention planning,
1.2Data Sources
1.2.1 Background of MMP
The data used in this study were obtained from MMP, a unique supplementary surveillance
project designed to provide representative, population-based data on clinical status, care,
outcomes, and behaviors of HIV-infected persons receiving care in the United States [36]. It is
supported by several government agencies and conducted by state and local health departments
along with the CDC. The MMP was first piloted in 2004 [37]. It is designed to achieve following
objectives [38, 39]:
• describe the clinical and virological status of HIV-infected persons in care;
• describe the prevalence of co-morbidities related to HIV disease;
• describe HIV care and support services received and the quality of such services determine
prevalence of ongoing risk behaviors and access to, and use of, prevention services among
persons living with HIV;
• identify met and unmet needs for HIV care and prevention services to inform prevention
and care planning groups, health care providers, and other stakeholder [39].
1.2.1.1 Sampling Design of MMP
MMP uses three stages sampling design to achieve annual representative samples of adults
receiving out-patient care for HIV infection in the U.S. [36]:
First Stage: State Level
All 50 states, the District of Columbia, and Puerto Rico were eligible for inclusion in MMP.
A sample was selected proportional to size based on existing HIV/AIDS cases within each area.
selected states included 6 separately funded cities, resulting in 23 participating project areas. The
project areas selected are estimated to include 73% of the total HIV/AIDS cases in the U.S. [36].
Second Stage: Health Care Facility Level
Outpatient HIV medical care facilities in the sampled project areas are sampled every two
years based on the number of patients seen at the facilities. The annual sample of facilities
includes about 25-50 facilities from each project area representing small, medium, and large HIV
medical care facilities. Facilities are eligible to participate if they prescribe antiretroviral
medications or order CD4 and/or HIV viral load (VL) tests in the context of treating and
managing HIV. Healthcare facilities that participate are expected to represent similar healthcare
facilities that were not selected to participate [36].
Third Stage: Patient Level
A sample of about 100 to 800 patients from each project area was selected from participating
health care facilities in 2009. Patients must be at least 18 years old, diagnosed with HIV, and
receiving care during January to April 2009. Patients who are selected are asked to participate in
an interview and answer questions about their demographics, behavior pattern and HIV
care. Patients who participate are expected to represent patients like them that were not selected
to participate [36].
1.2.1.2 Data Collection
A total of 23 project areas were involved in data collection activities for the 2009 MMP data
collection cycle: Chicago, Illinois; Delaware; Florida; Georgia; Houston, Texas; Illinois; Indiana;
Los Angeles County, California; Michigan; Mississippi; New Jersey; the state of New York;
New York City, New York; North Carolina; Oregon; Pennsylvania; Philadelphia, Pennsylvania;
selected 16 states and 1 U.S. territory and color-coded weighted percentage of sampled patients
in 2009 data collection cycle. Selected HIV patients ≥18 years of age and who received medical
care during January–April 2009 at an MMP participating facility, if agreed to participate, were
interviewed once during June 2009–April 2010 regarding their behaviors and medical status
during the 12 months preceding the interview. In addition, these patients’ medical records were
abstracted for documentation of medical care for the 12 months preceding the interview.
Moreover, data were extracted from the National HIV Surveillance System for every patient who
was selected to participate in MMP in order to provide basic descriptive information [39].
Figure 1.1 Weighted percentage of sampled patients receiving medical care in the United
States—Medical Monitoring Project, 2009
Personal Interview: The MMP interview is a face-to-face structured interview with two different
questionnaire s: the Standard Questionnaire and Short Questionnaire. The Standard Interview
Standard Questionnaire which takes about 20 minutes. Both questionnaires are available in both
English and Spanish. Generally the Standard Questionnaire was preferred for collecting
interview data. Under certain circumstances, patients who are too ill, or English,
non-Spanish speaking patients who need a translator, were administered the Short version [39].
The 2009 Standard Questionnaire consists of 10 modules: Preliminary Information;
Demographics; Access to Health Care; HIV Treatment and Adherence; Sexual Behavior; Drug
and Alcohol Use; Prevention Activities; Anxiety and Depression; Health Conditions and
Preventive Therapy; and Gynecological and Reproductive History. Electronic versions of all
questionnaires are provided by CDC, including handheld-assisted personal interview (HAPI)
device or computer-assisted personal interview (CAPI) device. HAPI and CAPI interview
applications were developed using Questionnaire Development System (QDS) software (NOVA
Research Company, Bethesda, Maryland). Paper versions of the questionnaires are provided for
use in the event of HAPI/CAPI break down. Local questions may be added by individual project
area. These questions are not transmitted to CDC[39].
Medical Record Abstraction (MRA): Medical records are abstracted by project area staff trained
to abstract clinical information from medical charts and enter the abstracted information into an
electronic application provided by CDC. The electronic medical record abstraction consists of 4
data collection forms: Medical History Form (MHF); Surveillance Period Visit Form (SPVF);
Surveillance Period Summary Form (SPSF); and Surveillance Period Inpatient Form (SPIF). The
information abstracted reflects patient’s clinical condition from the time first diagnosed as HIV
positive to the time of interview. Information collection will include the diagnosis of
opportunistic illnesses, provision of preventive therapies, prescription of antiretroviral
services utilization. If a patient cannot be located for recruitment, the patient’s medical record is
abstracted without interview, if allowed under local surveillance authority. To collect complete
information on the entire surveillance period, which is the 12 months prior the interview, project
staff needs to abstract medical record information from all facilities where a participant has
received medical care for HIV infection during the surveillance period.
Minimal Data Set (MDS): Regardless of level of participation, minimum data are collected on all
sampled patients. The minimum data set contains basic demographic and clinical data abstracted
from the same source for each project area, which is the Enhanced HIV/AIDS Reporting System
(eHARS). Minimal Data is important as it is the most complete dataset from MMP sampling. It
provides basic descriptive information regarding the population of inference and is critical for
assessing potential non-response bias for the data collected through interview and medical record
abstraction [39].
1.2.2 Sources of Error in the MMP
Non-coverage Error: The non-coverage error in MMP may come from three sources: (1)
sampled HIV patients are those older than eighteen and received medical care during January–
April 2009 at an MMP participating facility, therefore those younger patients, or those received
care only during May—December 2009, or those received care from non-selected or
refused-participation facilities, are not covered; (2) HIV-infected adults who received all of their care
solely from emergency departments or inpatient facilities will be excluded from MMP as these
facilities are not covered by MMP facility sampling frame; (3) patients in prisons or military
bases are excluded from the sampling frame. The first group seems to be the major source of
non-coverage error. However, a study focused on “time to first annual HIV care visit” using
months, respectively, therefore, an enrollment period of four-six months should sufficiently
reflect the patient population seen in a one-year period, including those attending care
infrequently [40]. On the other hand, the sub-population from 2nd and 3rd sources is relatively
small comparing to the national disease population of HIV-infected persons.
Sampling Error: Similar to all of other surveys, interview/MRA data in MMP are collected on
only a small sample size of the entire disease population. This may lead to sampling error. Strict
adherence to sampling rules at each of three sampling stages may reduce some of the sampling
error.
Non-response Error: Non-response error is a common problem in all surveillance studies. This is
especially critical for MMP because it uses a three-stage sampling strategy; therefore,
non-response error may occur at each stage. There are unit non-non-response and item non-non-response. Unit
non-response can arise at multiple levels of MMP data collection, for instance, when a selected
facility refuses to participate, or when a selected patient refuses to participate in the interview or
cannot be located, or when the provider denies MMP staff access to the medical records. Item
non-response may arise when data are not completely obtained for all questionnaire or medical
records items. The advantage of MMP is that data from the minimal data set which contains
information on all sampled persons, both respondents and non-respondents can be used to create
non-response weights to reduce non-response bias.
Measurement Error: The quality of MMP interview data can be disturbed by the question order,
question wording, response-code precision, recall error, length of interview, interviewer
relying on the accuracy and completeness of medical records, as well as abstractor’s technique,
coding errors and data entry errors.
1.2.3 Design Variables Related to Data Analysis
Each participant is coded by a 12-digits ID which consists of 4 digits which identifies the
project area ID, 4 digits which represents the facility ID, and 4 digits for an assigned patient ID.
The design of 2009 MMP data comprised 18 strata and 228 clusters which can be identified by
variables:
nat_strat_owt = strata variable in matched interview-MRA dataset
nat_clust_owt = cluster variable in matched interview-MRA dataset
nat_owt = stratum weight variable in matched interview-MRA dataset
The weights had been calculated to adjust for probability of selection and non-response [41].
1.3 Purpose of Study
ART therapy is a key component of clinical care for HIV/AIDS patients. Studies have shown
that successful ART can significantly reduce the HIV viral load and delay disease progression
[42-45]. Consistently suppressed HIV viral load is associated with reduced mortality and a
lower probability of sexual transmission [46, 47]. Therefore, the pattern of ART prescription and
adherence are of great interest and has been studied using several large databases [48, 49], such
as HIV Insight™ (APACHE), Target Management Services (TMS) and Clinical Partners (CP).
Although such databases provide a rich source of information, none of them are nationally
representative. In this thesis, we use MMP, a supplementary surveillance program designed to
cover all HIV patients receiving medical care in the U.S., to achieve the following goals:
(1) To provide a nationally representative profile of HIV treatments of HIV-infected adults
(2) To project a nationally representative picture of clinical and virological status of HIV
infected adults in care;
(3) To characterize patterns of antiretroviral use in HIV infected adults receiving care and
explore variations in clinical outcomes resulting from different regimens and patient
characteristics.
Ultimately, this information can be used to evaluate current clinical services and guide policy
and funding decisions aimed at improving the quality of care for people living with HIV/AIDS
CHAPTER 2 METHODS
2.1 Study Population
HIV infected adults with age of ≥18 years old and received care from any MMP-participating
facilities were utilized in analysis. Data files for the 2009 data collection cycle were encrypted
and transmitted to CDC through a secure data network. Analyses were done on site at MMP data
management office, Clinical Outcomes Team, Division of HIV/AIDS Prevention, CDC.
2.1.1 Facility and Participant Response Rates
For 2009 data collection cycle, the median facility participation rate was 77.8%, ranging
from 45.2% to 100% in 23 project areas. The median patient participation rate was 61.9 %
among eligible patients, varying from 26.4 % to 70.5 % in all project areas. Data were collected
at both the facility level and the patient level. Patient level data was collected for interview,
MRA and MDS. The raw national response rates for the 2009 cycle were calculated for all
datasets: Facility (76.5%), Interview (55.5%), MRA (66.1%) and MDS (87.8%). The combined
response rate is calculated by: overall response rate = Project area response rate × Facility
response rate × Individual response rate. So the combined national response rates for Interview,
MRA and MDS were 42.4%, 50.5% and 67.2%, respectively [50]. Overall, of a total of 9400
persons who were eligible for participation in MMP, 4620 participated, in which 4415
participants completed standard interview and 4217 participants had matched pairs of interview
and medical record abstraction. Therefore, to facilitate analysis of self-reported and clinical data,
we used the matched interview-MRA data with 4217 samples, representing 421,186 patients in
2.2 Study Variables
As mentioned earlier, MMP collected three kinds of dataset in 2009 data cycle: self-reported
interview dataset, medical records abstraction, and minimal dataset. Our study focused on two
sections: “HIV Treatment and Adherence” from interview and “Clinical status” from medical
records abstractions. Viral load, drug adherence, and side effects are the outcome variables of
interest, while ART regimens and general demographic/behavior characteristics are the risk
factors.
2.2.1 Characteristics of Participants (Self-reported)
Characteristics of participants were obtained from MMP interviews and were covered in two
parts: demographic characteristics and behavioral characteristics. Demographic characteristics
included gender, race/ethnicity, age at interview, education level, country or territory of birth,
time since HIV diagnosis, availability of health insurance, types of health insurance coverage,
poverty level, yearly income and access to care. The behavioral characteristics included alcohol
use, smoking, drug use, depression and sexual risk behavior. The detailed categories for each
characteristic were listed in Table 3.1 and were computed based on one or more interview
questions.
2.2.2 ART Treatment and Adherence to ART (Self-reported)
In the interview process, ART treatment status was asked in two time courses: the history of
ART use (asked by question T1. Have you ever taken any antiretroviral medicines for your
HIV?), and the current status of ART use (asked by question T5. Are you currently taking any
antiretroviral medicines for your HIV?), each followed by a list of commercially available
antiretroviral medications. The mapping of interview variables to commercial available
ART was asked, while for those who are currently taking ART, the adherences to dose,
instruction and schedule, reason for missed doses, trouble with side effect, insurance for ARTs,
and satisfaction with ARTs were asked. [Questionnaire available at
[image:28.612.107.508.226.713.2]http://www.cdc.gov/hiv/topics/treatment/mmp/data.htm]
Table 2.1 Mapping of interview/MRA variables to commercial available medicines
Drug category Drug abbreviation Variable name in Interview Variable name in SPVF Variable name in SPIF Combo (total 5) AZT/3TC
COMBCUR combivir1_vf combivira1_if combivir2_vf combivira2_if combivir3_vf combivira3_if
ABC/3TC/AZT
TRIZCUR trizivir1_vf trizivira1_if trizivir2_vf trizivira2_if trizivir3_vf trizivira3_if
ABC/3TC
EPZICUR epzicom1_vf epzicoma1_if epzicom2_vf epzicoma2_if epzicom3_vf epzicoma3_if
FTC/TDF
TRUVCUR truvada1_vf truvadaa1_if truvada2_vf truvadaa2_if truvada3_vf truvadaa3_if truvada4_vf truvadaa4_if truvada5_vf truvadaa5_if
FTC/TDF/EFV
ATRIPLA atripla1_vf atriplaa1_if atripla2_vf atriplaa2_if atripla3_vf atriplaa3_if
NRTI (Total 8)
3TC
LAMICUR lamivudine1_vf lamivudinea1_if lamivudine2_vf lamivudinea2_if lamivudine3_vf lamivudinea3_if
ddI
DAECCUR didanosine1_vf didanosinea1_if DIDACUR didanosine2_vf didanosinea2_if didanosine3_vf didanosinea3_if didanosine4_vf didanosinea4_if
FTC
EMTRCUR emtricitabine1_vf emtricitabinea1_if emtricitabine2_vf emtricitabinea2_if emtricitabine3_vf emtricitabinea3_if
TDF
TENOCUR tenofovir1_vf tenofovira1_if tenofovir2_vf tenofovira2_if tenofovir3_vf tenofovira3_if
ddC
ZALCCUR zalcitabine1_vf zalcitabinea1_if zalcitabine2_vf zalcitabinea2_if zalcitabine3_vf zalcitabinea3_if zalcitabine4_vf zalcitabinea4_if
d4T
Drug category Drug abbreviation Variable name in Interview Variable name in SPVF Variable name in SPIF AZT
ZIDOCUR zidovudine1_vf zidovudinea1_if zidovudine2_vf zidovudinea2_if zidovudine3_vf zidovudinea3_if zidovudine4_vf zidovudinea4_if zidovudine5_vf zidovudinea5_if
ABC
ABACACUR abacavir1_vf abacavira1_if abacavir2_vf abacavira2_if abacavir3_vf abacavira3_if
NNRTI (Total 4)
DLV
DELACUR delaviridine1_vf delavirdinea1_if delaviridine2_vf delavirdinea2_if delaviridine3_vf delavirdinea3_if
NVP
NEVICUR nevirapine1_vf nevirapinea1_if nevirapine2_vf nevirapinea2_if nevirapine3_vf nevirapinea3_if
EFV
EFAVCUR efavirenz1_vf efavirenza1_if efavirenz2_vf efavirenza2_if efavirenz3_vf efavirenza3_if
ETV
TMC etravirine081_vf etravirinea081_if etravirine082_vf etravirinea082_if etravirine083_vf etravirinea083_if etravirine084_vf etravirinea084_if
PI (Total 10)
APV
AMPRCUR amprenavir1_vf amprenavira1_if amprenavir2_vf amprenavira2_if amprenavir3_vf amprenavira3_if
SQV
SACQCUR saquinavir081_vf saquinavira1_if SAC2CUR saquinavir082_vf saquinavira2_if saquinavir083_vf saquinavira3_if saquinavir084_vf saquinavira4_if saquinavir085_vf saquinavira5_if
LPVr
LOPICUR LPVRTV1_VF LPVRTVA1_IF
LPVRTV2_VF LPVRTVA2_IF
LPVRTV3_VF LPVRTVA3_IF
LPVRTV4_VF LPVRTVA4_IF
LPVRTV5_VF LPVRTVA5_IF
LPVRTV6_VF LPVRTVA6_IF
IDV
INDICUR indinavir1_vf indinavira1_if indinavir2_vf indinavira2_if indinavir3_vf indinavira3_if
FPV
FUSACUR fosamprenavir1_vf fosamprenavira1_if fosamprenavir2_vf fosamprenavira2_if fosamprenavir3_vf fosamprenavira3_if fosamprenavir4_vf fosamprenavira4_if
ATV
ATAZCUR atazanavir1_vf atazanavira1_if atazanavir2_vf atazanavira2_if atazanavir3_vf atazanavira3_if
RTV
Drug category Drug abbreviation Variable name in Interview Variable name in SPVF Variable name in SPIF
nelfinavir2_vf nelfinavira2_if nelfinavir3_vf nelfinavira3_if
TPV
TIPRCUR tipranavir1_vf tipranavira1_if tipranavir2_vf tipranavira2_if tipranavir3_vf tipranavira3_if
DRV
PREZCUR darunavir081_vf darunavira1_if darunavir082_vf darunavira2_if darunavir083_vf darunavira3_if darunavir084_vf darunavira4_if
EFI (Total 2)
T20
ENFUCUR enfuvirtide081_vf enfuvirtidea1_if enfuvirtide082_vf enfuvirtidea2_if enfuvirtide083_vf enfuvirtidea3_if enfuvirtide084_vf enfuvirtidea4_if
MVC
MARAVIRO maraviroc1_vf maraviroca1_if maraviroc2_vf maraviroca2_if maraviroc3_vf maraviroca3_if maraviroc4_vf maraviroca4_if maraviroc5_vf maraviroca5_if
INI
(Only 1) RAL
RALTEGRA raltegravir1_vf raltegravira1_if raltegravir2_vf raltegravira2_if raltegravir3_vf raltegravira3_if raltegravir4_vf raltegravira4_if raltegravir5_vf raltegravira5_if
After the status of individual drug was programmed, the participants were further grouped
into two categories: took ART vs. not took ART. For those who took ART, they were separated
into five major categories including preferred-regimens, alternative-regimens,
maybe-selected-regimens, not-recommended-maybe-selected-regimens, and other-regimens. The details of first four categories
were abstracted from the clinical guideline by Department of Health & Human Services (DHHS)
[32], as listed in Table 2.2. Other medications that were not on DHHS recommendation list were
[image:30.612.79.537.616.722.2]grouped into other-regimens.
Table 2.2 Initial antiretroviral regimens for antiretroviral therapy in naïve patients [32]
Regimen group Name Combination
Preferred Regimens
Regimens with optimal and durable efficacy, favorable tolerability and toxicity profile, and ease of use
NNRTI-Based Regimen 1-1.EFV/TDF/FTC*(AI)
PI-Based Regimens 1-2.ATVr + TDF/FTC
* (AI) 1-3.DRVr + TDF/FTC*(AI)
INSTI-Based Regimen 1-4.RAL + TDF/FTC*(AI) Alternative Regimens
Regimens that are effective and tolerable but have potential
NNRTI-Based Regimens
2-1.EFV + ABC/3TC*(BI)
RPV/TDF/FTC*(BI)
Regimen group Name Combination disadvantages when compared with
preferred regimens.
PI-Based Regimens
2-2.ATVr + ABC/3TC*(BI)
2-3.DRVr + ABC/3TC*(BII)
2-4.FPVr + ABC/3TC* or TDF/FTC*(BI)
2-5.LPVr + ABC/3TC* or TDF/FTC*(BI)
INSTI-Based Regimen EVG/COBI/TDF/FTC
*(BI)
2-6.RAL + ABC/3TC*(BIII)
Regimens that may be selected for some patients but are less satisfactory than preferred or alternative regimens
NNRTI-Based Regimen
3-1.EFV + ZDV/3TC*
3-2.NVP + (ABC/3TC* or TDF/FTCa or ZDV/3TC*)
RPV + ZDV/3TC*
PI-Based Regimens
3-3.(ATV or ATVr or DRVr or FPVr or LPVr or SQVr) + ZDV/3TC*
3-4.ATV + ABC/3TC*
3-5.SQVr + (ABC/3TC* or TDF/FTC*) INSTI-Based Regimen 3-6.RAL + ZDV/3TC*
CCR5 Antagonist-Based Regimens
3-7.MVC + (ABC/3TC or TDF/FTC or ZDV/3TC*)
ARV drugs or components NOT recommending as initial therapy
4-1.ABC/3TC/ZDV (co-formulated) as triple-NRTI combination regimen (BI)
4-2.ABC + 3TC + ZDV + TDF as quadruple-NRTI combination regimen (BI)
DRV (unboosted) 4-3.DLV (BIII)
4-4.ddI + 3TC (or FTC) (BIII)
4-5.ddI + TDF (BII)
EVG/COBI/TDF/FTC + other ARV drugs T20 (BIII)
ETR (BIII)
4-6.FPV (unboosted) (BIII)
4-7.IDV (unboosted) (BIII)
4-8.IDVr (BIII)
4-9.NFV (BI)
RTV as sole PI (BIII) 4-10.SQV (unboosted) (BI)
4-11.d4T + 3TC (BI)
4-12.TPVr (BI) * 3TC may substitute for FTC or vice versa. r stands for Ritonavir boosted.
Rating of Recommendations: A = Strong; B = Moderate; C = Optional
Rating of Evidence: I = Data from randomized controlled trials; II = Data from well-designed nonrandomized trials or observational cohort studies with long-term clinical outcomes; III = Expert opinion
Italicized letters for those combinations which were not covered in MMP.
2.2.3 MRA variables
Information regarding AIDS diagnosis, CD4 count, prescription of ART, and HIV viral load
was abstracted from the patient’s medical records data. The most recent ART prescription were
computed from multiple clinical visit forms (SPVF, covered in section V. ANTIRETROVIRAL
(ART) during this inpatient stay?”) and inpatient forms (SPIF, covered in section VIII.
ANTIRETROVIRAL THERAPY (ART), question “Is there documentation of prescription or
continuation of antiretroviral therapy (ART) during this visit?”). The mapping of SFVF and
SPIF variables to commercial available medicines is shown in Table 2.1. Patients with ART
prescription were further categorized in the same manner for self-reported ART use, as
mentioned previously. The most recent and durable viral load was also calculated from the SPVF
and SPIF (SFVF section X. LABORATORY TESTING – FREQUENTLY REPEATED TEST and
SPIV section VII. INPATIENT LABORATORY TEST RESULTS). [MRA forms available at
http://www.cdc.gov/hiv/topics/treatment/mmp/data.htm].Virologic suppression was defined as
an HIV VL documented in the MRA of undetectable or 200 copies/ml or less.
2.2Statistical Analysis
Statistical analyses were conducted using SAS (version 9.3) and SAS-Callable SUDDAN
(version 11.0.0). Hypothesis testing results with p-values of 0.05 or less were considered to be
statistically significant.
The SURVEY procedures in SAS were used to take into accounts survey study design
variables, such as strata, cluster, and weights. Frequencies and weighted percentages of selected
characteristics were calculated using PROC SURVEYFREQ. Then the modified Rao-Scott
chi-square test, a design-adjusted Pearson chi-chi-square test which involves differences between
observed and expected frequencies [51-53], was used to test differences between groups.
Prevalence ratio was used in this study to evaluate the relationship between risk factors and
outcomes. MMP is a cross-sectional study. Cross-sectional studies are observational studies
typically used to assess the prevalence of disease conditions. Prevalence is the proportion of a
Therefore, PR was used in preference to the odds ratio (OR) in this study because PR is more
conservative, consistent, and interpretable relative to the OR in cross-sectional design [54, 55].
Two-step analyses were performed to access the association between ART regimens and
health outcomes (most recent viral load, durable viral load, drug adherence, and trouble with side
effects): first, the crude bivariate associations were studied using Rao-Scott chi-square test; and
then, multivariate logistic regression model for complex survey data was constructed to compute
the unadjusted and adjusted prevalence ratios (aPRs). The multivariate modeling was done using
PROC SURVEYLOGISTIC, which fit linear logistic regression models for discrete response
survey data by the method of maximum likelihood. Demographic factors (including gender, race,
age at interview, education level, country or territory of birth, time since HIV diagnosis, type of
health insurance, and poverty level), and behavioral factors (including binge drinking, injection
and non-injection drug use), as well as clinical status (including nadir CD4 count, type of AIDS,
and type of ART regimens), are potential confounding variables which were tested for inclusion
in each of the multivariate regression models. Collinearity among the independent variables was
assessed. Variables with a p-value less than 0.1 at univariate analysiswere entered in the initial
multivariate model. Furthermore, manual backward stepwise model selection was performed,
with a p-value of 0.05 criterion for retention of variables in thefinal model. Possible interaction
terms were examined one-by-one. Models were compared through the Akaike’s information
criterion (AIC). Final model was transferred to SUDDAN PROC RLOGIST to report crude PRs
and aPRs and statistical inferences. Model adequacy was evaluated using Hosmer and
Lemeshow goodness-of-fit test [56]. Variances of the regression parameters and prevalence
ratios were computed by the Taylor linearization method, assuming a with replacement (WR)
CHAPTER 3 RESULTS
3.1 Frequencies and Descriptive Statistics
3.1.1 General Characteristics
As listed in Table 3.1, of 4,217 participants from the 2009 MMP data cycle, 71% were male,
27% were female, and 1% was transgender or intersex. The age groups with the greatest
proportion of participants were two older groups, 40-49 years (39%) and 50 years or older
(36%). Most participants were non-Hispanic black (41%) or non-Hispanic white (34%). Majority
of the patients were born in the United States (87%). There were 23%, 23% and 54% of
participants who were diagnosed with HIV infection within 5 years, 4 to 9 year, or more than 10
years, respectively. A total of 8% of participants reported to be homeless at some point during
the past 12 months. Among 3,441 (81%) of participants who reported having health insurance
coverage in the past 12 months, 2,443 (69%) used some public insurance/program and 971
(30%) had only private health insurance. (Participants could select more than one type of health
insurance.) Minor (28%) amount of participants who had insurance coverage had some loss of
insurance in the past 12 months before interview. Around half (51%) of the participants had
more than high school education. A total of 64% of participants had low yearly family income
(0-$19,999) and approximately half (54%) were under poverty level [58]. Among participants
that were diagnosed within 5 years, more than 90% of the participants were able to access to care
within 3 months after HIV diagnosis.
Only 99 (2%) participants had used injection drugs, while 1,134 (27%) participants had used
non-injection drugs in the past 12 months before the interview. There were 720 (16%) binge
drinkers and 1,780 (42%) current smokers among 4,217 participants. Majority (74%) of the
past 12 months before the interview, approximately half (45%) had unprotected anal or vaginal
intercourse, within which 543 (53%) were reported for unprotected intercourse with a partner of
negative or unknown HIV status.
Table 3.1 General characteristics of HIV-infected adults receiving medical care in the United
States—Medical Monitoring Project, 2009
Characteristic No. in sample (un-weighted n) Estimated population size (weighted n) Weighted %
95% CI of percentage
Total patients 4217 421186 100.0
Demographic
Gender
Male 3013 299808 71.2 (68.0-74.4)
Female 1139 114527 27.2 (24.0-30.4) Transgender or intersex 65 6852 1.6 (1.1-2.2) Age at interview
18-29 316 31081 7.4 (6.2-8.6)
30-39 722 72150 17.1 (15.3-18.9) 40-49 1647 165506 39.3 (37.5-41.1)
50+ 1532 152450 36.2 (34.3-38.1)
Race/Ethnicity
Non-Hispanic Black 1740 174449 41.4 (33.3-49.6) Hispanic 881 80606 19.1 (14.2-24.1) Non-Hispanic White 1395 145586 34.6 (28.0-41.1)
Other 199 20339 4.8 (3.8-5.8)
Foreign born (Country of birth other than US or Puerto Rico)
Born in US or Puerto Rico 3685 365912 86.9 (84.8-89.0) Country of birth other than US or
Puerto Rico
529 55094 13.1 (11.0-15.2)
Length of time since HIV diagnosis
0-4 years 951 97527 23.2 (21.2-25.2) 5-9 years 978 96988 23.1 (21.5-24.6) 10+ years 2283 226161 53.8 (51.2-56.3) Homeless at any time in P12M
No 3827 383292 91.0 (89.8-92.2)
Yes 390 37894 9.0 (7.8-10.2)
Insurance
Type of health insurance during P12M
Private only 971 100516 23.9 (19.9-28.0) Any public 2423 234888 55.9 (52.6-59.3) No insurance/coverage 768 79234 18.9 (15.1-22.7) Unknown/unspecified insurance 47 5359 1.3 (0.5-2.0) Continuous insurance during P12M
Continuous insurance/coverage 3020 300481 71.6 (67.2-76.0) Lapsed insurance/coverage 417 39938 9.5 (8.2-10.8) No insurance/coverage 768 79234 18.9 (15.1-22.7)
Socioeconomic status
Characteristic No. in sample (un-weighted n) Estimated population size (weighted n) Weighted %
95% CI of percentage
< High School 985 95077 22.6 (20.0-25.1) High school diploma or GED 1161 113016 26.8 (24.1-29.6) > High School 2070 212981 50.6 (45.8-55.4) Yearly income during P12M
$0-$19,999 2699 261705 64.4 (59.8-69.0) $20,000-$39,999 690 71737 17.7 (15.4-19.9) ≥ $40,000 691 72939 17.9 (14.8-21.1) Poverty Level during P12M
Above poverty level 2214 228285 54.2 (50.0-58.4) At or below poverty level 1866 178097 42.3 (38.3-46.3) Unknown 137 14805 3.5 (2.5-4.5)
Access to care
Time to enter care since 1st HIV positive test for those diagnosed <=5 years
≤ 3 mos. 846 86812 90.9 (88.8-93.0) 4-11 mos. 62 5914 6.2 (4.5-7.9) ≥ 12 mos. 28 2754 2.9 (1.8-4.0)
Behaviors
Any non-injection drug use
No 3071 306072 72.9 (71.1-74.8)
Yes 1134 113565 27.1 (25.2-28.9)
Any injection drug use
No 4108 410926 97.9 (97.1-98.8)
Yes 99 8767 2.1 (1.2-2.9)
Binge drinker
No 3464 349234 83.6 (82.2-84.9)
Yes 720 68551 16.4 (15.1-17.8)
Current smoker
No 2427 241965 57.6 (54.9-60.3)
Yes 1780 177980 42.4 (39.7-45.1)
Depression
Depression diagnosis based on an algorithm from [59]
No depression 3128 309479 74.4 (72.6-76.2) Other depression 535 54689 13.1 (12.0-14.3) Major depression 506 51750 12.4 (11.2-13.7)
Sexual behavior
Sexual activity in P12M
No, not sexually active in the P12M 1556 159959 38.2 (35.8-40.5) Sexually active in the P12M 2641 259236 61.8 (59.5-64.2) Had unprotected sex among sexually active
No 1254 122078 54.7 (50.1-59.2)
Yes 1032 101220 45.3 (40.8-49.9)
Had unprotected sex with partner of negative or unknown status among those who reported unprotected sex
No 478 47458 47.4 (42.0-52.9)
Yes 543 52635 52.6 (47.1-58.0)
Sexual transmission risk category
Any MSM (MSM only+MSMW) 1950 196519 46.7 (42.1-51.4)
MSW only 1029 99285 23.6 (21.0-26.3)
Any WSM (WSM only+WSMW) 1111 111268 26.5 (23.4-29.6)
3.1.2 Characteristics of Clinical Status
Clinical status data were abstracted from 46,829 care visits (including 46,297 outpatient
visits and 532 inpatient visits) by 4,217 patients during the one-year surveillance period (SP) of
2009. Of the 4,217 patients, 2,940 (69.6%) had 3 or more tests for VL or CD4 within the SP.
There were 2,897 (67.6%), 976 (23.9%) and 333 (8.5%) of participants in each of the 3 stages of
AIDS according to CDC’s classification guidelines [9]. Majority (89.1%) of participants were
prescribed ART in the past 12 months before interview. A total of 71.6% participants had a
suppressed most recent viral load while less, about 57.7% participants had suppressed durable
[image:37.612.78.538.360.717.2]viral load.
Table 3.2 Characteristics of clinical status of HIV-infected adults receiving medical care in the
United States—Medical Monitoring Project, 2009
Characteristic
No. in sample (un-weighted n) Estimated population size (weighted n) Weighted %
95% CI of percentage
Total patients 4217 421186 100.0
Clinical status (MRA)
Status of AIDS
AIDS (Clinical or immunologic) 2897 284022 67.6 (65.7-69.6) No AIDS (Clinical or immunologic) 1309 135980 32.4 (30.4-34.3) Types of AIDS
AIDS or nadir CD4 0-199 2897 284022 67.6 (65.7-69.6) No AIDS and nadir CD4 200-500 976 100455 23.9 (21.9-25.9) No AIDS and nadir CD4 >500 333 35525 8.5 (7.2-9.7) Prescribed antiretroviral (ART) therapy in P12M
No 462 45743 10.9 (9.2-12.6)
Yes 3737 373733 89.1 (87.4-90.8)
Geometric mean CD4 count in P12M
0-199 543 50476 12.4 (11.0-13.9)
200-349 743 74989 18.5 (17.1-19.8)
350-499 1011 100507 24.8 (23.4-26.2)
500+ 1770 179851 44.3 (42.5-46.1)
Viral suppression: Most recent viral load
Most recent viral load > 200 copies/milliliter 1201 119561 28.4 (25.1-31.6) Most recent viral load undetectable or ≤ 200
copies/milliliter
3016 301626 71.6 (68.4-74.9)
Durable viral suppression: All viral load
All viral load > 200 copies/milliliter 1780 178191 42.3 (39.4-45.2) All viral load undetectable or ≤ 200
copies/milliliter
2437 242995 57.7 (54.8-60.6)
Characteristic
No. in sample (un-weighted n)
Estimated population size (weighted n)
Weighted %
95% CI of percentage
3 or more CD4/VL tests not documented 1257 127277 30.4 (28.0-32.7) 3 or more CD4/VL tests documented 2940 292038 69.6 (67.3-72.0)
3.1.3 Characteristics of HIV/AIDS Treatments
Of 4,217 participants in 2009 MMP data collection, 3,931 (93.4%) of the participants had a
history of taking ART. Among 3,609 participants who reported ever having a CD4
T-lymphocyte test, 2,996 (83%) reported having three or more CD4 T-T-lymphocyte tests in the 12
months before the interview. Among 780 participants who were diagnosed within 5 years, 438
(56.8%) started antiretroviral medication within 3 months after diagnosis. The main reason for
not currently taking ART medications was doctor’s advises of delaying treatment. For most of
participants who were on ART, 3,040 (71.6%), the expenses of antiretroviral medicines were
partially or entirely covered by public programs, such as Medicaid and Medicare. About 12.7%
and 4.3% of the ART users paid for ART using by private insurance or out-of-pocket payments.
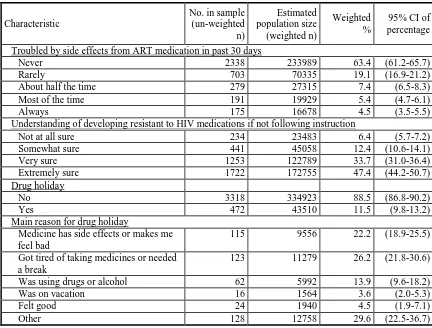
High ART adherence is essential to achieve viral suppression. In MMP, the ART adherence
was measured by dose-adherence (taking a right dose or set of pills of prescribed ARTs),
instruction-adherence (following special instructions for prescribed ART medication) and
schedule-adherence (following a specific schedule for ART medication) in the past 3 days before
interview. The majority, 85.6%, 69.0% and 71.7% of the respondents claimed completely
adherence to dose, instruction (if it was needed) and schedule in the past 3 days, respectively.
Only 472 (11.5%) of the ART users admitted taking drug holidays, while the main reasons for
taking drug holidays were side effects (22.2%) or being tired of taking medications (26.2%). A
total of 645 (17.3%) participants who were on ART reported trouble with side effects from ART
fully trust the positive effects of ART. Approximately half (48.2%) of the participants took
[image:39.612.93.523.171.713.2]complementary therapies in the past 12 months.
Table 3.3 Characteristics of ART treatments of HIV-infected adults receiving medical care in the
United States—Medical Monitoring Project, 2009
Characteristic
No. in sample (un-weighted n) Estimated population size (weighted n) Weighted %
95% CI of percentage
Total patients 4217 421186 100.0
HIV treatment (self-reported)
Ever took ART medication
No 280 27764 6.6 (5.5-7.7)
Yes 3931 392762 93.4 (92.3-94.5)
Currently taking ART medication
No 576 55525 13.3 (11.9-14.6)
Yes 3617 363195 86.7 (85.4-88.1)
Time between first time ever took ART and first positive test
Diagnosed more than 5 Years 3118 308595 79.4 (77.7-81.1) 3 months or less 438 45287 11.7 (10.5-12.8) 3 months-12 months 162 16555 4.3 (3.6-4.9) 12 months or more 180 18021 4.7 (3.9-5.4) Reasons for not currently taking antiretroviral medicines
Doctor advised to delay treatment 107 10824 50.0 (40.3-59.6) Due to side effects of medication 34 3429 15.8 (9.8-21.8)
Other 75 7408 34.2 (26.3-42.1)
Type of health insurance paid for ART in P12M
Not taking ART medication 416 41603 9.9 (8.7-11.1) Paid by private only 511 53451 12.7 (10.4-15.0) Paid by any public program 3040 300933 71.6 (68.2-75.0) Out of pocket 182 18174 4.3 (2.7-5.9) Unspecified/unknown 45 4699 1.1 (0.8-1.4) Trust in ART medication producing a positive effect on health
Not at all sure 111 11537 3.1 (2.3-3.9) Somewhat sure 347 34799 9.4 (8.0-10.9) Very sure 1251 123159 33.4 (30.6-36.3) Extremely sure 1982 198965 54.0 (50.9-57.1) Taking complementary or alternative therapies in P12M
No 2164 218152 51.8 (47.1-56.6)
Yes 2050 202592 48.2 (43.4-52.9)
Drug adherence (self-reported)
Dose adherence in past 3 days
No, person is not 100% adherent 526 52024 14.4 (12.9-15.9) Yes, person is 100% adherent 3080 310025 85.6 (84.1-87.1) Instruction adherence in past 3 days
No, person is not 100% adherent 781 76030 31.0 (28.6-33.4) Yes, person is 100% adherent 1690 169313 69.0 (66.6-71.4) Schedule adherence in past 3 days
Characteristic
No. in sample (un-weighted n)
Estimated population size (weighted n)
Weighted %
95% CI of percentage
Troubled by side effects from ART medication in past 30 days
Never 2338 233989 63.4 (61.2-65.7)
Rarely 703 70335 19.1 (16.9-21.2) About half the time 279 27315 7.4 (6.5-8.3) Most of the time 191 19929 5.4 (4.7-6.1)
Always 175 16678 4.5 (3.5-5.5)
Understanding of developing resistant to HIV medications if not following instruction
Not at all sure 234 23483 6.4 (5.7-7.2) Somewhat sure 441 45058 12.4 (10.6-14.1) Very sure 1253 122789 33.7 (31.0-36.4) Extremely sure 1722 172755 47.4 (44.2-50.7) Drug holiday
No 3318 334923 88.5 (86.8-90.2)
Yes 472 43510 11.5 (9.8-13.2)
Main reason for drug holiday
Medicine has side effects or makes me feel bad
115 9556 22.2 (18.9-25.5)
Got tired of taking medicines or needed a break
123 11279 26.2 (21.8-30.6)
Was using drugs or alcohol 62 5992 13.9 (9.6-18.2) Was on vacation 16 1564 3.6 (2.0-5.3) Felt good 24 1940 4.5 (1.9-7.1)
Other 128 12758 29.6 (22.5-36.7)
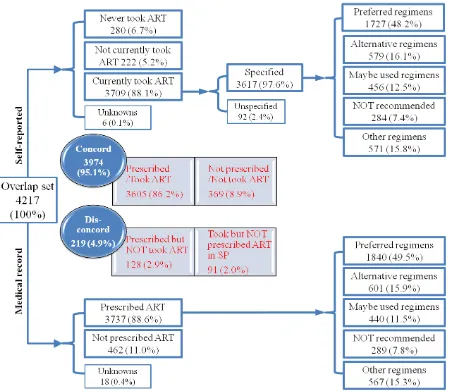
3.2 Detail Categories of ART Regimens
Detailed categories of self-reported and most recently doctor-prescribed ART regimens are
shown in Figure 3.1. There is a high crude concordance (95.1%) between self-reported ART
regimens and prescription. 3,605 (86.2%) participants were prescribed ARTs and were currently
taking ARTs, while 369 (8.9%) participants were not currently taking ARTs, neither were they
prescribed. The discordance rate is 4.9%, in which 128 (2.9%) were prescribed ART, but did not
report taking ART in the interview and 91 (2.0%) reported taking ART, but had no record of
[image:40.612.89.521.70.398.2]being prescribed ART in the MRA.
Table 3.4 presents the detailed individual regimen comparison of self-reported and prescribed
ART regimens. Of 3,605 participants who were prescribed and reported taking ART, 2,562
major discrepancies were between “preferred-regimens” and “other-regimens”. The overall
concordance at individual regimen level is (2,562 [took=prescribed] + 369 [did not take/not
prescribed]) /4,217), that is 69.5%. ART prescription records were believed to be more accurate
than the self-reports because the interview data could be biased due to recall for two reasons: (1)
major HIV antiretroviral medications, HAART, were involved in multiple drugs—a medication
“cocktail”, (2) each drug has several different commercial brand name. Therefore, further
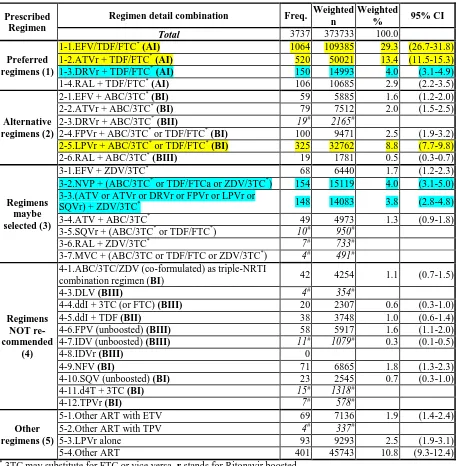
analyses were based on most recently prescribed regimens abstracted from the medical records.
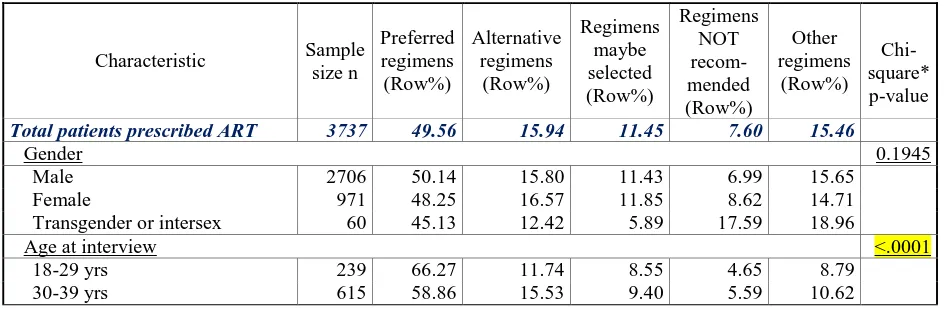
Of 3,737 participants who were prescribed ART, close to half of (1,841 (43.7%)) were
prescribed preferred-regimens. The proportions of participants who were prescribed
alternative-regimens, maybe-selected-alternative-regimens, not-recommended-regimens and other-regimens were
14.3%, 10.4%, 6.7% and 13.6%, respectively. Such frequency trend is in good agreement with
the recommendations for antiretroviral regimen by DHHS guidelines [32]. The further
compositions of individual regimens and their popularities were presented in Table 3.5. The top
three ART regimens with frequency over 300 were (1-1) EFV/TDF/FTC, a combination of
NNRTI and NRTI, prescribed to 1,065 (29.3%) of the participants; (1-2) ATVr with TDF/FTC, a
combination of NRTI and PI, prescribed to 520 (13.4%) of the participants; and (2-5) LPVr with
ABC/3TC or TDF/FTC, also a combination of NRTI and PI, prescribed to 325 (8.8%) of the
participants. The second line of ART regimens with frequency around 150 were (3-2) one
NNRTI (NVP) and two NRTIs (ABC/3TC or TDF/FTC or ZDV/3TC), prescribed to 154 (4.0%)
of the participants; (1-3) one PI (DRVr) with two NRTIs (TDF and FTC), prescribed to 150
(4.0%) of the participants; and (3-3) any one PI (ATV or ATVr or DRVr or FPVr or LPVr or
Figure 3.1 Self-reported and most recently prescribed ART regimens of HIV-infected adults receiving medical care in the United
States—Medical Monitoring Project, 2009

![Table 2.2 Initial antiretroviral regimens for antiretroviral therapy in naïve patients [32]](https://thumb-us.123doks.com/thumbv2/123dok_us/9225999.990435/30.612.79.537.616.722/table-initial-antiretroviral-regimens-antiretroviral-therapy-naive-patients.webp)