https://doi.org/10.5194/hess-22-2589-2018 © Author(s) 2018. This work is distributed under the Creative Commons Attribution 4.0 License.
A new method, with application, for analysis of the impacts
on flood risk of widely distributed enhanced hillslope storage
Peter Metcalfea,†, Keith Beven1,2, Barry Hankin3,1, and Rob Lamb4,1
1Lancaster Environment Centre, Lancaster University, Lancaster, LA14YQ, UK 2Department of Earth Sciences, Uppsala University, Uppsala 75263, Sweden 3JBA Consulting, Sankey Street, Warrington, Cheshire, WA1 1NN, UK
4JBA Trust, South Barn, Broughton Hall, Skipton, North Yorkshire, BD23 3AE, UK aformerly at: Lancaster Environment Centre, Lancaster University, Lancaster, LA14YQ, UK †deceased
Correspondence:Keith Beven ([email protected]) Received: 5 July 2017 – Discussion started: 13 July 2017
Revised: 26 December 2017 – Accepted: 12 March 2018 – Published: 27 April 2018
Abstract.Enhanced hillslope storage is utilised in “natural” flood management in order to retain overland storm run-off and to reduce connectivity between fast surface flow path-ways and the channel. Examples include excavated ponds, deepened or bunded accumulation areas, and gullies and ephemeral channels blocked with wooden barriers or debris dams.
The performance of large, distributed networks of such measures is poorly understood. Extensive schemes can po-tentially retain large quantities of run-off, but there are indi-cations that much of their effectiveness can be attributed to desynchronisation of sub-catchment flood waves. Inappro-priately sited measures may therefore increase, rather than mitigate, flood risk. Fully distributed hydrodynamic mod-els have been applied in limited studies but introduce sig-nificant computational complexity. The longer run times of such models also restrict their use for uncertainty estimation or evaluation of the many potential configurations and storm sequences that may influence the timings and magnitudes of flood waves.
Here a simplified overland flow-routing module and semi-distributed representation of enhanced hillslope storage is de-veloped. It is applied to the headwaters of a large rural catch-ment in Cumbria, UK, where the use of an extensive network of storage features is proposed as a flood mitigation strat-egy. The models were run within a Monte Carlo framework against data for a 2-month period of extreme flood events that caused significant damage in areas downstream. Acceptable
realisations and likelihood weightings were identified using the GLUE uncertainty estimation framework. Behavioural realisations were rerun against the catchment model modi-fied with the addition of the hillslope storage. Three different drainage rate parameters were applied across the network of hillslope storage.
The study demonstrates that schemes comprising widely distributed hillslope storage can be modelled effectively within such a reduced complexity framework. It shows the importance of drainage rates from storage features while op-erating through a sequence of events. We discuss limitations in the simplified representation of overland flow-routing and representation and storage, and how this could be improved using experimental evidence. We suggest ways in which fea-tures could be grouped more strategically and thus improve the performance of such schemes.
1 Introduction
struc-tures and interventions that both utilise and enhance the nat-ural processes within the catchment in order to provide flood resilience (Calder and Alywood, 2006; SEPA, 2016; Lane, 2017). It is argued that NFM is a low-cost, scalable approach that, in addition to improved flood resilience, can yield con-siderable benefits in terms of stakeholder engagement (Lane et al., 2011) and improved ecosystem services (Iacob et al., 2014).
A wide range of interventions are employed in NFM. These are reviewed by, amongst others, Quinn et al. (2013), EA (2014), SEPA (2016), Dadson et al. (2017) and Lane (2017). Many of these are intended to increase the ca-pacity of hillslopes to retain fast overland run-off and release it slowly, thus reducing its contribution to the rising limb of the storm hydrograph. Measures to achieve this encompass excavated ponds, deepened or bunded existing hollows, or wooden barriers or debris dams in ephemeral channels.
The term run-off attenuation feature (RAF) has been used to refer to any structure to retain storm run-off, whether in channel (online) or on the hillslope (offline) (e.g. Barber and Quinn, 2012; Nicholson et al., 2012; Quinn et al., 2013). Here the term “enhanced hillslope storage” (EHS) is used to disambiguate online and offline approaches and will re-late to any measure intended to increase the capacity of the hillslopes to retain storm run-off. EHS was implemented in the Belford Burn catchment as wooden structures and earth bunds placed across overland flow pathways identified from topographic analysis (Nicholson et al., 2012; Wilkinson et al., 2010a). In Vale of Pickering, North Yorkshire (Nisbet et al., 2011); Pontbren (Wheater et al., 2008; Nisbet and Page, 2016); and Holnicote, Devon (National Trust, 2015), block-ing of moorland gullies added storage to upper parts of the catchments.
Despite the increasing use of EHS, there have been rela-tively few attempts to model its effects on the storm response at a catchment scale, and to quantify the requirements of a scheme to meet a certain level of flood risk mitigation. The expectation is currently that NFM will have an impact on small- to moderate-scale events. However, to be a practical strategy, it will be required to operate effectively across ex-treme events, but there is as yet little evidence of what will be required to have an effective impact in these conditions.
Ghimire et al. (2014) applied a fully distributed hydrody-namic model (TUFLOW) to simulate a potential single hill-slope pond of capacity 27 000 m3within the 74 km2Tarland Burn catchment in Aberdeenshire. This showed that the in-tervention could reduce peak flows by 9 % for an event of the scale of the median annual flood (known as QMED). Using the fully distributed JFLOW model (Lamb et al., 2009; En-vironment Agency, 2013), Hankin et al. (2016, 2017) sim-ulated the effects of multiple hillslope ponds across three catchments in Cumbria. This showed the relative impacts on the hydrograph, in terms of downstream benefits or damages avoided. The model was driven by multiple rainfall event sets incorporating spatial joint probabilities observed in the
extremes from time series of observed rainfalls around the catchment (Lamb et al., 2010; Keef et al., 2013). Nicholson et al. (2012) and Wilkinson et al. (2010b) used a lumped repre-sentation in the Belford Burn catchment, whereby the storage requirement of the scheme was estimated from the reduction required to prevent damage in the hydrograph of the small-est storm that caused flooding. This indicated that 20 000 m3 of additional storage would have sufficed to prevent damage. However, the interactions of storage and the complex routing of flood waves may mean that the theoretical static storage of a scheme could be substantially underutilised, even dur-ing large events (Metcalfe et al., 2017).
The capacity of individual storage features is in the UK constrained by legislation that limits their size to 10 000 m3, above which significant legal responsibilities are imposed (Wilkinson et al., 2010b; Ghimire et al., 2014). Ghimire (2014) suggested that a network of ponds just under the critical capacity could be used to replace the single large pond first modelled. Analysis of the effects of just one of these 9500 m3ponds indicated that it could reduce the peak of the QMED event by 2.5 %. A pond of 5200 m3would re-duce the peak of the same storm by 1 %. The storage required for a significant mitigating effect on storm flows is much greater, however. Metcalfe et al. (2017) showed that within a 29 km2 catchment, 168 000 m3 of hydrodynamic storage provided by a single large in-channel feature in the middle reaches would just have prevented flooding in a 1-in-75-year event. A scheme of a realistic scale could therefore involve installation of extremely large numbers of features on the hillslope, although the quantity required might be reduced by applying other measures such as tree-planting and online interventions.
Drainage from structures to retain run-off can be by infil-tration, direct evaporation from the water surface, or through permeable or “leaky” walls. It will, however, be difficult in the models mentioned to account dynamically for the drainage pathways out of large numbers of hillslope stor-age features. Areas will be unable to drain down during the course of a simulation, and thus the modelling approach will have limitations when applied to multiple storm events. In these cases, recovery of storage capacity during recession pe-riods could have a significant impact on the effectiveness of a scheme through multiple events (Metcalfe et al., 2017).
Much of the effectiveness of natural and distributed flood management schemes has been attributed to their ability to desynchronise sub-catchment flood waves (Thomas and Nis-bet, 2007; Blanc et al., 2012). Pattison et al. (2014) examined the interacting effects of the Eden sub-catchment flood waves using data for a large flood event in Carlisle in 2005, and concluded that their timing and magnitude predicted the ma-jority of the variance in modelled downstream flood peaks. It will therefore be necessary to design such installations with some care. Slowing run-off that would have contributed to the hydrographbeforethe peak could have the effect of in-creasing the peak magnitude. This is called the synchronicity problem.
Peak timings vary, however, with the pattern and timing of rainfall and antecedent wetness in the catchment, and also in the way in which the hydrographs from different sub-catchments interact. Thus, it will be necessary to test the sen-sitivity of a design before implementation by using an appro-priate model of run-off generation and mitigation measures. This might, in itself, require many model runs that reflect different event characteristics and patterns, as well as storage and drainage characteristics of features. Given the immense number of combinations of potential configurations and va-rieties of storm events, a pragmatic approach to evaluating the impacts of NFM would be “experimental” modelling, whereby many possible realisations of the catchment model and event sets are generated (Hankin et al., 2016, 2017). A computationally efficient run-off model and representation of hillslope storage would allow such an approach in reasonable timescales. This will necessarily involve some simplification of the hydraulic behaviour, as a fully hydrodynamic treat-ment will introduce complexity, additional parameters and much increased run times.
There is significant uncertainty in predictions of the spatial distribution and quantities of run-off (Beven, 2006, 2012). Attempts to assess the effectiveness of NFM will compare predictions for unaltered and modified catchments and in-troduce even further uncertainty. Uncertainty estimation and sensitivity analysis can provide a more realistic assessment of the reliability of predictions of the impacts of NFM (Han-kin et al., 2017). These techniques will, however, also require the generation of thousands or even millions of model real-isations in which parameters are sampled from prior distri-butions of realistic values. With continued growth in
com-puting power it is now feasible to run the fully distributed JFLOW model over 750 km2with a 2 m resolution grid (e.g. 175 million cells) in approximately real-time (Hankin et al., 2017). This will still require a significant commitment in time and computing power to produce more than a few scores of realisations. Thus, while high-performance computing may be fast enough for assessment for a selection of features and hillslope properties, it may still be inadequate for uncer-tainty analysis across larger catchments and wide-scale NFM schemes comprising the large number of features required to meet the storage requirements to significantly attenuate real flood events.
In 2016 the Life IP Natural Course project was under-taken by Lancaster University and JBA Consulting for the UK Rivers Trust. Its aim was provide better understanding of how NFM could be applied strategically to the headwa-ters of three catchments in Cumbria, UK (Hankin et al., 2016, 2017). Measures considered included large-scale tree-planting in order to increase evaporation losses and improve soil structure, and restoration of peat and heath to increase surface roughness. Measures to provide enhanced hillslope storage were also considered. The interventions were mod-elled separately, allowing the effects of each to be discerned. Given the uncertainties in both predictions of storm run-off and the impacts of NFM, a key objective of this project was to develop an approach that could allow the modelling results to be presented to the client alongside realistic estimates of their uncertainty. This required a model that could simulate the storm run-off with sufficient computational efficiency to generate the thousands of runs required for uncertainty anal-ysis.
Previous work has shown the importance of the drainage characteristics of features that retain run-off whilst operat-ing across a series of closely spaced events (Metcalfe et al., 2017), as a degree of “leakiness” is required to allow the scheme to recover capacity between events. Another ob-jective was therefore to develop an approach that could re-flect drainage from “leaky” EHS and could be applied to the thousands of features required, but again without exces-sive computational cost. A period of three significant storms in November and December 2015, in which the catchments were badly affected, was chosen as the basis for the study. This paper documents the modelling approach that was de-veloped and describes how it was applied in the largest of these catchments, the 223 km2Upper Eden.
2 Material and methods 2.1 Run-off modelling
ver-sion (Beven and Freer, 2001a) has been applied in many stud-ies (e.g. Liu et al., 2009; Page et al., 2007). In conjunction with a spatially explicit hydraulic channel routing module, the later implementation was used to evaluate the effect on flood risk of an NFM-style scheme in an agricultural catch-ment in North Yorkshire, UK (Metcalfe et al., 2017).
The model extends TOPMODEL (Beven and Kirkby, 1979). The basic approach in both models is the aggregation of “similar” landscape areas into hydrological response units (HRUs), which are treated during the course of a simulation as having identical hydrological responses. The units may be of arbitrary size and not necessarily spatially contiguous, al-though they, along with their internal states, can be mapped back into space. This “discretisation” approach significantly reduces the complexity of the landscape model whilst retain-ing hydrological connectivity of the hillslope. The model can therefore be run extremely quickly, and this approach there-fore helped meet the objective of the LifeIP project to evalu-ate NFM impacts within an uncertainty framework.
In TOPMODEL the catchment classification is strictly ac-cording to the topographic wetness index (TWI), a measure of the tendency of a point on the hillslope to become satu-rated. An improved subsurface routing algorithm introduced in Dynamic TOPMODEL allows a more flexible approach to aggregation of catchment areas, and any characteristic or combination of characteristics may be used to identify a HRU. A routing matrix is developed from the surface topog-raphy, taken as an approximation to the hydraulic gradient, and applied to route subsurface run-off downslope through the units, with a kinematic wave relationship between spe-cific discharge and storage deficit.
Model parameters are shown in Table 1.
Once a HRU discretisation has been defined the model can be run against rainfall and potential evapotranspiration (Ep)
data for a specified time period. For that period, it produces a time series of simulated discharges at the catchment outlet and of the internal states of the HRUs. These include storage deficit, saturation excess (surface) and root zone storage. In order to reflect spatial variability, distinct rainfall and/orEp
records may be applied to the HRUs. 2.2 Overland flow-routing
Hunter et al. (2007) suggest that in some situations simpli-fied, but physically based, surface flow models can perform as well as fully hydrodynamic formulations. In TOPMODEL and the first version of Dynamic TOPMODEL (Beven and Freer, 2001a) a network width approach was taken to routing surface flow (see Beven, 2012). In the implementation de-scribed by Metcalfe et al. (2015) semi-distributed, storage-based surface flow-routing was introduced. This uses a rout-ing scheme similar to that applied to the subsurface. Satura-tion excess from upslope HRUs is routed to downslope units by a surface flow distribution matrixWof, again derived from
the surface topography:
Wof=
1 0 · · · 0
r1 p11 · · · p1n ..
. ... . .. ... rn pn1 · · · pnn
ri+ n X
j=1
pij=1. (1)
Each row in this matrix gives the proportions of the cor-responding unit’s flow that is directed to other units. For ex-ample,pij is the proportion of uniti’s flow that is directed to unitj, andpii is the proportion that remains within unit i. The vector r represents a lumped “river” unit such that rj is the proportion of downslope flux entering the chan-nel network from unit numberj. With an extended matrix a multi-reach river unit can also be defined. The matrix ap-proximates transfer of flux between the different landscape units, and thence into the channel unit(s), by averaging the inter-cell slopes of the elevation raster between cells falling into each of the HRU categories.
An assumption of a linear storage–discharge relationship is now made, whereby the downslope discharge overland through a unit contour within a unit is proportional to depth of flow, i.e. specific surface excess storages (m). This im-plies a uniform velocity profile, so that the specific discharge isqout=vofs, withvof (m h−1) the mean overland wave
ve-locity within that unit. It can be shown (Metcalfe et al., 2015) that this leads to a coupled series of ordinary differential equations for the specific surface storages s across all of the HRUs:
ds dt =A
−1WT−IAVs (2)
whereAandVare diagonal matrices whose leading elements are, respectively, the areas and the mean overland flow ve-locities. This system can be solved analytically by the so-called eigenvalue method (Dummit, 2016). During a simula-tion storage distributed downslope is calculated to the end of the time interval, and any directed to the channel is routed to the outlet using the network width approach. Surface excess storages thus redistributed are then added to the rainfall input for those units in the next time step. This approach allows for possible re-infiltration as “run on” if there is a soil moisture deficit in downslope units.
2.3 Modelling of enhanced hillslope storage
In order to assess the effects on the storm run-off of addi-tional hillslope storage, simulations with identical parame-ters and inputs, but using representations of unaltered and modified hillslope, are undertaken and the respective results compared.
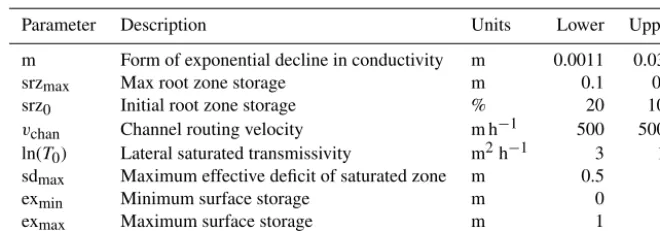
Table 1.Run-off model parameters and ranges applied in calibration and uncertainty analysis.
Parameter Description Units Lower Upper m Form of exponential decline in conductivity m 0.0011 0.033 srzmax Max root zone storage m 0.1 0.3
srz0 Initial root zone storage % 20 100
vchan Channel routing velocity m h−1 500 5000
ln(T0) Lateral saturated transmissivity m2h−1 3 12
sdmax Maximum effective deficit of saturated zone m 0.5 –
exmin Minimum surface storage m 0 – exmax Maximum surface storage m 1 1
HRUs. In model realisations reflecting unaltered catchments these units behave identically to surrounding landscape ar-eas. To then simulate the effect of applying EHS, the surface routing through these units can be altered to reflect their re-duced connectivity with the hillslope. Intervention areas may be grouped into multiple units according to their characteris-tics. These could include, for example, height and permeabil-ity, position on the hillslope, upslope area, slope, and prox-imity to the channel. Even if many such aspects are identified and result in multiple groupings, this approach will substan-tially reduce computational overheads against a fully spa-tially distributed representation.
Drainage is an important aspect of hillslope storage. Between-events areas will often remain saturated and there will be little infiltration to the subsurface. There will be evap-otranspiration losses, however, which will occur at the max-imum potential rate from the open surface. Direct drainage from a bunded area or dam could be applied via a pipe which, ignoring friction, gives a dependence of discharge on the square of the hydrostatic head. Leaky wooden structures or permeable bunds may instead drain as though through a porous medium. In this case it is more realistic to relate out-put discharge linearly with the head (Beven, 2012). A struc-ture could also be impermeable so that storage not removed by evapotranspiration is lost downslope only when the fea-tures start overflowing.
In deepened hollows and ground scrapes any overflow in excess of the storage capacity will leave the feature in a sim-ilar direction and velocity across the unmodified hillslope. In both leaky and impermeable structures, assuming they are designed to maximise interception by following the lo-cal contours, the directions are again likely to be similar. The flow rates will be more dependent on its material and construction and can, for example, be simulated by a non-contracted broad-crested weir equation (Chow, 1959; Brater and King, 1976). The semi-distributed surface routing algo-rithm outlined in Sect. 2.2 is now applied in order to model catchments where hillslope storage has been added by any of the methods described. The units representing storage are modified so that smaller proportions of their downslope sur-face flow are directed to other units than for the unaltered
landscape representation, and thus features fill when there is a net input of run-off. Subsurface routing beneath the struc-ture is unaltered.
This change in the rate of storage draining out areas due to emplacement of features with permeable walls can be em-ulated by reducing the effective overland flow velocity in the corresponding units. A leakiness factor3is defined as the proportional reduction in effective downslope flow ve-locities from an aggregated storage unit with respect to the unaltered hillslope. Each unit in effect behaves for the du-ration of a time step as a linear store with mean residence timeTres 3, vof, i=3vof1
, i, wherevof, iis the overland flow velocity for the unaltered hillslope representation.
A modified surface distribution matrix Wof can also be
used to reflect changes in the directions of downslope flow due to the presence of the storage features. For example, in a downslope pond drained by a pipe the drainage direction is likely to be towards the nearest channel. In this case, for unit idraining to reachj, the elementrij ofWof is set to unity
and all the other units set to zero.
For a roughly rectangular area, storage could be consid-ered as proportional to water depth, but other storage–depth relationships could be specified for more realistic morpholo-gies, for example in blocked gullies. A parameter exmax[L]
can be introduced to control the maximum storage; if ex> exmaxthe structure starts to overflow. An additional overflow
matrixWovercan be defined to direct excess water out of the
lumped features. This matrix is likely to be identical to the unaltered surface distribution matrix,Wsurf, but could be
al-tered, for example to emulate an overflow channel.
2.4 Uncertainty estimation framework
has been employed in many studies (e.g. Beven and Freer, 2001b; Blazkova and Beven, 2004; Liu et al., 2009).
Many realisations are produced using a Monte Carlo ap-proach, whereby a large number of model parameters are sampled randomly from one or more prior distributions and are then applied in turn to the system model. For each a simulation is performed across the desired period. Each out-put is then scored with a likelihood or weighting function calculated from performance metrics against observational data and other criteria. This is then normalised to produce a weighting factor for the corresponding realisation.
In general only those simulations achieving an acceptabil-ity threshold are retained, yielding a “behavioural” parameter set, giving a posterior distribution of likelihoods. A triangu-lar weighting function is common (Beven and Freer, 2001b; Beven, 2006; Blazkova and Beven, 2009; Liu et al., 2009). whereby the value is unity at the likeliest value of a prede-fined acceptability interval, zero at either limit, and linearly interpolated between these points. A trapezoidal form (e.g. Blazkova and Beven, 2009) could also be applied, where the value is unity between two threshold values and linearly in-terpolated outside these to the acceptability criteria. All of the predicted values of the observables must lie within accept-able ranges or the realisation is rejected, even if the overall sum of weights is non-zero.
An approach to incorporate this uncertainty framework into evaluation of NFM interventions is shown in Fig. 1. Weighted behavioural model realisations for the unaltered catchment model are obtained through the procedure de-scribed. One or more modifications due to the applications of interventions are applied to the catchment model, and each of the base realisations rerun against this altered model. For each altered realisation the weighting score is carried through from the baseline case. If there is available information on the likelihoods of the effects of the interventions, a score for the modified realisation can be calculated by combining it with the weighting of the associated behavioural model.
3 Study catchment and storm events
The Eden headwaters in Cumbria, UK (Fig. 3), have a drainage area of 223 km2 above Great Musgrave Bridge (54.5126◦N, 2.363234◦W). The catchment is 55.4 % acid, improved or rough grassland and 36.0 % bog, scrub or heath. Bedrock geology is Permian and Triassic sandstones lain on Carboniferous limestones and there is some influence of groundwater pathways (Ockenden and Chappell, 2011). Tree cover is minimal, comprising just 2.5 % of its area, although there has been significant recent tree planting that is not yet thought to have had any major effect on flood peaks. Over-all annual rainfOver-all is in the region of 1200 mm, but there is a strong synoptic and orographic influence (EA, 2008).
There are two UK Environment Agency flow gauges in the catchments (see Fig. 3). Gauge number 76 806 is located at
Great Musgrave Bridge and was installed in July 2000. It is of a velocity–area type and of the form of a shallowV weir 30 m in width. Gauge number 76 014 is located near Kirkby Stephen (54.482588◦N,−2.351097◦W) and drains an area of 69.4 km2. It dates from 1971 and is a compound broad-crested weir, also using a velocity–area method area for flow estimation.
The early autumn of 2015 was unusually dry and soil water deficits in October were more than 10 mm greater than the long-term average (Marsh et al., 2016). In Novem-ber a south-westerly “atmospheric river” became estab-lished that brought warm moisture-laden air from the subtropics. A period of exceptional rainfall events fol-lowed that included storms Abigail (15–16 November), Barney (18 November) and Desmond (5–6 December). This final extra-tropical cyclone caused significant dam-age and over 2000 homes were flooded in Carlisle near the catchment outlet. A record 1680 m3s−1 discharge was recorded at 09:00 GMT on 6 December at Sheepmount Weir (54.905332◦N, 2.952091◦W) in Carlisle. The town of Ap-pleby (54.578719◦N, 2.488839◦W), was also badly affected by this event; a peak discharge of 372 m3s−1was recorded at 18:00 GMT on the 5 December at the Great Musgrave Bridge gauge a few kilometres upstream. Matthews et al. (2018) pro-vide a fuller description of Storm Desmond and its hydrolog-ical extremes.
The study period runs from close to the end of Septem-ber 2015, when the soil moisture deficit was at its peak, to the recession period of Storm Desmond in early De-cember. Processed 15 min time series of rated discharges were obtained from the EA for gauge 76 806. Tipping-bucket recorder (TBR) rainfall data at 15 min intervals were also provided by the EA and a set of these gauges lying within 10 km of the catchment was identified. Given the extreme rainfall, some gauges went off-line during the storms and were removed from the set, leaving four gauges with com-plete records over the period. A rainfall record was interpo-lated from this and met the water balance to within 5 %. This was then applied to the entire catchment area.
Although significant events, storms Abigail and Barney did not cause damaging flooding in this or downstream ar-eas of the catchment. This suggests that a reduction of the 7.0 mm h−1 peak of Storm Desmond to that of Abigail, at 2.4 mm h−1, the larger of these storms, would be a success-ful outcome of any NFM intervention. This corresponds to a reduction of around 4.6 mm h−1 or 65 %. The potential for s=a large degree of uncertainty in the rating of these dis-charges, particularly at the extreme levels seen during Storm Desmond, should be borne in mind.
3.1 Model setup
Figure 1.Work flow diagram for Monte Carlo simulation of storm run-off, and selection and weighting of behavioural realisations and application of NFM scenarios for forward prediction of change. The weight of lines leading from acceptable simulations reflects the weighting likelihood score in the validity of that realisation.
Figure 2.Hydrodynamic accumulation areas within Eden, identi-fied by JFLOW analysis for a designed storm of return period of 30 years (Hankin et al., 2017). Maximum water depths are indi-cated, and areas that exceed the threshold depth and other criteria (minimum area, slope angle and proximity to roads and buildings) are highlighted as potential sites for EHS.
catchment outlet with JFLOW. Areas that accumulated sig-nificant water depths, such as natural depressions, flow path-ways or small channels, were tagged as suitable candidates for enhanced storage (see Fig. 2). Their areas were then
con-strained in size to between 100 and 5000 m2and those within 2 m of roads and buildings excluded. This yielded 4500 dis-tinct sites of 506 m2 average area, occupying 4.0 % of the catchment and leading to a potential static storage of just over 8 million m3.
A Dynamic TOPMODEL “discretisation” was then under-taken. The catchment was divided into eight response units according to the topographic wetness index, and hillslope areas identified as potential sites for EHS were associated with an additional single response unit within the catchment. This HRU classification overrode any underlying classifica-tion determined from the TWI. This unit was thenceforth treated as a single aggregated feature bunded or dammed by a “leaky” barrier, 1 m in height with upslope sides open to receive surface run-off.
[image:7.612.50.287.362.566.2]Figure 3.Study catchment, the Eden headwaters to Great Musgrave Bridge (223 km2), showing context within Cumbria, UK, predominant land cover and location of TBR rain gauges and gauging stations. Woodlands for Water tree planting opportunity areas are shown. These were applied in another application of the NFM modelling framework developed for the project described, which are not discussed in detail here.
3.2 Monte Carlo exercise
An ensemble of 5000 parameter sets were sampled randomly from uniform prior distributions with ranges given in Ta-ble 1. The observaTa-bles used to calculate likelihood weight-ing score wereAc, the maximum saturated contributing area,
or area proportion of the catchment that generates overland flow; the Nash–Sutcliffe statistic (NSE, Nash and Sutcliffe, 1970); andqmax, the maximum simulated discharge relative
to the observed rated value. The acceptability criteria forAc
were derived from considerations of physically feasible val-ues. These could be approximated from observations across actual events, for example, by remotely sensed imaging (EA, 2013; Luscombe et al., 2015). The criteria observables are given in Table 2, alongside their limits of acceptability. The likelihood score for the NSE was the actual value calculated from the simulated discharges versus the observed, rated val-ues. For the others, the likelihood score was triangular in the corresponding acceptability intervals, with a value of unity at
the midpoint of the range. The overall weighting score for a realisation is then calculated by taking the mean of the indi-vidual scores. The behavioural sets identified by applying the limits shown in Table 2 are then used as the basis for investi-gation of the effects of applying a number of NFM scenarios.
4 Results
Of the 5000 realisations undertaken, 384 were identified with outputs that met the acceptability criteria given in Table 2. Figure 4 shows the discharges simulated by these behavioural cases, alongside the observed rated discharges at the EA gauge at Great Musgrave bridge.
The “dotty” plots in Fig. 5 show overall GLUE weight-ings against the three metrics used to select acceptable cases. The maximum saturated area,Ac, shown in the leftmost plot,
Figure 4.Simulated discharges across the storm period alongside rated observed discharges at Great Musgrave Bridge. The three named storms are indicated. Rainfall is interpolated between the gauges shown in Fig. 3.
Table 2.Observables collected for each model realisation and acceptability criteria applied.
Metric Description Units Criteria applied NSE Nash–Sutcliffe statistic – >=0.85 Ac Maximum saturated contributing area % [10, 95]
qmax Specific discharge at largest storm peak mm h−1 [5.2, 8.2]
Within the behavioural realisations only a limited number of HRUs, along with the aggregated EHS unit, ever contribute saturated surface flow, leading to just seven distinct values forAc. Points corresponding to likelihood weightings for
re-alisations producing these distinct values of Ac are shown
in the leftmost plot, with a distinct colour applied for each. The same colours are applied to points corresponding to the same realisations in the other plots. The stratified appear-ance of the NSE plot is a by-product of its correlation with the contributing area; the correlation with the maximum pre-dicted discharge is less clear. A value ofAcof around 65 %
is associated with the best NSE fits, but is spread through-out the maximum discharges. The bias towards higher val-ues suggests that realisations producing greater quantities of fast overland flow better reflect the storm response in this pe-riod. This would be consistent with the extreme nature of the storms and observational evidence (e.g. Marsh et al., 2016).
Parameters for each of the 384 accepted cases were ap-plied to catchment models modified to reflect insertion of hillslope storage networks with each of the residence times considered, and the simulations rerun. Reduction in peak1q
for an intervention case is defined as the difference between a baseline case and intervention simulation based on this case. For each pair of simulations the value of1qwas multiplied by the base-case normalised weighting to reflect the likeli-hood of this reduction effect. The likelilikeli-hood-weighted statis-tics for each of the events and intervention levels are given in Table 3, and the impacts on the arrival time of the main peaks of each in Table 4. The Kolmogorov–Smirnov test in-cluded is a non-parametric approach to comparing empiri-cal distribution, equal to the maximum vertiempiri-cal separation of the cumulative distribution function (CDF) of the discharges. This allows an evaluation of the relative effectiveness of each intervention.
Figure 6 shows, as rainfall-equivalent-specific surface storage within the aggregated hillslope storage unit across the entire simulation period. When this is filled, and overflow discharge predicted with a Weir equation, the crest height will lead to a slight excess over the specified maximum static storage of 1 m.
[image:9.612.149.450.386.442.2]Figure 5.GLUE “dotty” plots showing overall likelihood (weighting) scores calculated for the 348 behavioural run-off simulations against the three model outputs described in the text. The discontinuous appearance of the maximum saturated contributing areaAcis due to the
relatively coarse discretisation applied such that once a HRU begins to produce any saturated overland flow, its entire area is added. Each uniqueAcvalue takes a separate colour that is carried through to corresponding points in the other plots.
Table 3.Statistics for the impacts of interventions relative to base cases on the peaks of the named storms within the simulation period. Each difference is weighted by the likelihood score for the base-case simulation. The term1qmax(mm h−1) denotes the maximum and Med
the median percentage likelihood weighted reduction in peak. K.S. is Kolmogorov–Smirnov Statistic, a non-parametric statistic equal to the maximum separation of the CDF of the simulated base-case peaks versus the peaks calculated for the intervention case. This shows that the RT10 intervention consistently has the greatest impact across the storms.
Abigail Barney Desmond Name 1qmax Med K-S 1qmax Med K.S. 1qmax Med K.S. RT1 8.4 2.6 0.013 18.7 3.5 0.016 7.9 1.7 0.033 RT10 36.7 12 0.103 34 10.4 0.141 17.3 5.8 0.129 RT100 22.2 6.6 0.05 33.5 7.7 0.063 17 1.9 0.037
utilised effectively: utilisation is highest at the peak of Storm Desmond, at 29 % of the theoretical hydrostatic capacity. This is equivalent to approximately 2.45 million m3volume
of storage retained across the catchment. The corresponding effect on the hydrograph is small, with a likelihood-weighted median reduction in the peak of Storm Desmond of 1.7 %. For RT10 the features appear underutilised in the earlier storms, peaking at about 50 % capacity, and recover almost all their capacity in the recession period after Storm Bar-ney. Retained hillslope run-off across the catchment peaks at just over 10 million m3. The impact of the additional stor-age is significant in the final storm, and reduces the peak by a likelihood-weighted median of 5.8 % and maximum
of 17.3 %, the greatest impact of any of the interventions. This intervention would not by itself have prevented flood-ing; however, combined with more conventional flood risk management (FRM) measures it could have had a significant mitigating effect even through this extreme event.
[image:10.612.132.462.465.535.2]Figure 6.Surface excess storages, expressed as specific rainfall equivalent, across one of the lumped RAF units with maximum storage 1 m through a single intervention case and for the three mean residences times considered. The slight excess at the peaks of the storm reflects the weir crest height of the overflow function applied.
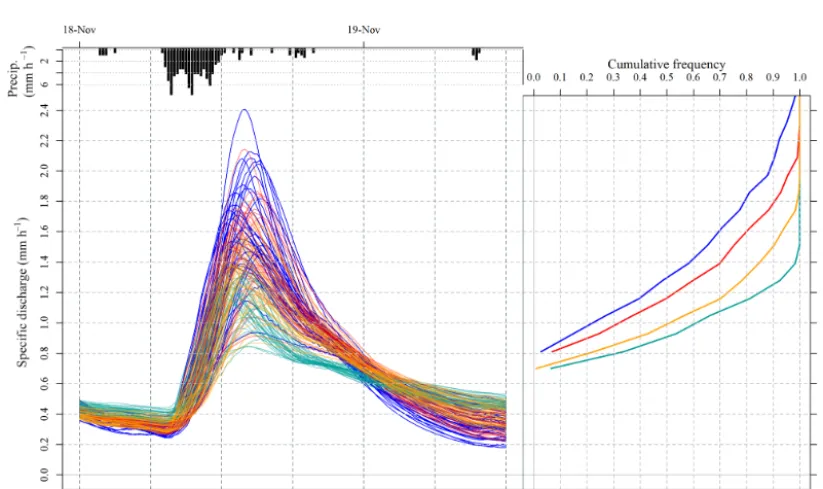
case, with a median reduction of 1.9 % in the peak, although some cases do show a reduction almost as effective as RT10. Ensemble hydrographs through each of the named storms are shown in the following figures. These present the dis-charges simulated for the unmodified catchment model using the parameters for each of the acceptable cases against those produced by applying the corresponding parameters to catch-ment models with the addition of enhanced hillslope storage. In the initial storm, Abigail, the first peak is attenuated as much by the RT100 case as the RT10 case, but in the second peak RT10 again provides much greater reduction. The RT1 case has the lowest impact on all storm peaks. The arrival of the main peak is retarded most by the RT100 case, with a median delay of 30 min. The later peak appears to be brought forward marginally by the RT100 cases, however. This may indicate that the hillslope storage unit has run out of storage and is delivering flow downslope by overflow. In all cases the recession curve is extended by the intervention, indicating that storage is draining for some time after the storm peak.
In the second event the RT100 case appears to have more impact than any of the other cases across the initial peak but then becomes less effective than RT10 through the main peak. There is less of a delay to the arrival of the main peak than for Abigail, with a median delay of only 15 min for the RT10 and RT100 cases. In the RT10 case the median brings the peak forward by 15 min. This might indicate that their effect has been to slow down fast-responding catchments so
that their flood waves contribute more to the rising limb of the overall storm hydrograph.
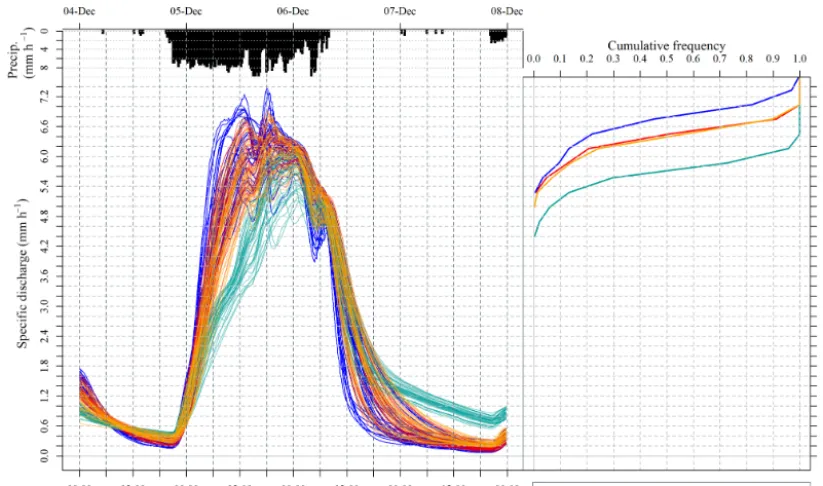
In this largest event the RT10 case significantly outper-forms the others, suggesting that it has recovered much more capacity. There is virtually no attenuation from the other cases and the peak is hardly delayed for RT1 and RT100. Figure 9 shows clearly that the RT100 units fill quickly dur-ing Abigail and remain full for the duration of Barney and Desmond. There is only a week-long period in later Novem-ber when they recover a little capacity through drainage dur-ing the recession period of Barney.
The RT10 case has the greatest impact on the flood peak for all storms, with its advantage over the other cases increas-ing through the period. In Abigail the Kolmogorov–Smirnov distance of the RT10 case is 150 % that of the RT100 case, whereas across Desmond this has increased to 350 %.
5 Discussion
Figure 7.Left: 90th percentile likelihood scored baseline and corresponding intervention cases through Storm Abigail. Right: Likelihood-weighted CDF of peak discharges for base and intervention cases. Note that, in order to share the same vertical axis, the plot axes are is transposed relative to convention.
[image:12.612.91.503.425.669.2]Figure 9.Left: 90th percentile scored baseline and corresponding intervention cases through Storm Desmond. Left: CDF of peak discharges for base and intervention cases.
and this may not add greater insight into the catchment re-sponse.
The RT10 case was significantly more effective across the largest event than the other two cases, as features had re-covered capacity during the previous recession and drained sufficiently to have an impact on the flood peak in Storm Desmond. The mitigation was less across the earlier events but, given they did not cause significant flooding, this was not a consideration.
These results provide further evidence that the theoreti-cal, static storage provided by an NFM scheme can be sig-nificantly underutilised, assuming it is configured so that it can recover capacity effectively between storms events. It has already been suggested that the effectiveness in reducing flood risk of a NFM intervention is not a simple function of the additional storage it provides, but also of its contribution to desynchronising a sub-catchment’s flood wave with those downstream (Thomas and Nisbet, 2007; Blanc et al., 2012).
A more sophisticated approach to implementing NFM is probably required. For instance, the locations on the hill-slopes of interventions are likely to be a significant factor on a scheme’s performance as they will influence flood wave timing. In this study the network width approach to routing channel flow was applied across the entire headwater catch-ment, and flood wave size and timings were not available for the individual sub-catchments. It was thus unclear from the results what proportion of attenuation of storm hydrographs were due to desynchronisation of flood waves, as opposed to simple retention of surface run-off. A regression analysis similar to that undertaken by Pattison et al. (2013),
includ-ing the hillslope storage location and quantities as predictor variables, could provide insight into the relative contributions of additional hillslope storage and flood wave desynchroni-sation on downstream flood mitigation. This can be done in a further analysis, but does raise the question of how to cali-brate meaningful flood wave velocities for the individual sub-catchments.
Metcalfe et al. (2015) showed that the run-off predictions simulated by Dynamic TOPMODEL stabilised at around 8 to 12 subdivisions of the catchment. In this study eight HRUs were used: despite being at the lower limit of the region of stability identified by Metcalfe et al. (2015), the model gave good fits to the observed hydrographs, with many realisations exceeding efficiencies of 0.9 (although the uncertainties in-troduced through rating of discharges at extreme storm lev-els should be noted). The values of the maximum saturated area,Ac, were highly discontinuous, however, as when the
response units start to produce saturated flow they contribute their entire area to the metric. A more fine-grained discreti-sation would produce a more continuous distribution which might be advantageous in terms of better identification of sat-urated contributing areas, in particular how the positioning of hillslope storage features in proposed schemes may influence run-off from these areas.
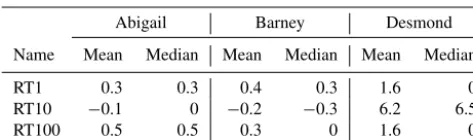
Table 4.Mean and median delays (h) to simulated peaks of each of the named storms for the intervention cases compared to the corre-sponding unmodified cases.
Abigail Barney Desmond
Name Mean Median Mean Median Mean Median
RT1 0.3 0.3 0.4 0.3 1.6 0
RT10 −0.1 0 −0.2 −0.3 6.2 6.5
RT100 0.5 0.5 0.3 0 1.6 0
storms. Complete or partial failure could lead to debris be-ing introduced to the flood waters and potential damage or blockage of downstream infrastructure which will increase risk of flood damage. Ideally, these scenarios should be in-corporated in a risk-reduction–cost matrix. There is, as yet, little information about the potential for failures that can be used to estimate residual risk, although initial findings sug-gest that failure sequences can behave non-linearly.
Enhanced hillslope storage was treated as a single unit in the catchment discretisation. In practise different types of in-terventions, e.g. hillslope ponds, bunded accumulation areas and blocked gullies, will have distinct responses under load-ing and their locations may also have a significant impact on the run-off. A more realistic approach would recognise the variety of interventions and group features and categorise them by their construction, geometries and position on the hillslopes. The number of possibilities will increase rapidly according to the number of varieties and configurations de-fined, but these are likely to be constrained by considerations of realistic design and implementation issues. In addition, the simplified representation used in this study allows for rela-tively rapid investigation of many different configurations. This approach can be incorporated into a sensitivity anal-ysis to determine which characteristics are most important to the impact of enhanced hillslope storage features on the storm response. A Monte Carlo approach selecting from mul-tiple design event sets, for example generated by the method of Keef et al. (2013), could help assess the robustness of the conclusions drawn from modelling and help to site fea-tures more strategically. It could also help identify situations where flood waves become synchronised by emplacement of features at different catchment scales.
6 Conclusions
This study has analysed the performance across a series of extreme events of a NFM scheme made up of many “leaky” features providing additional storage for hillslope run-off. The model incorporated a simplified overland routing mod-ule and achieved a high level of efficiency in simulating the observed discharges. The best baseline simulations were ap-plied to the catchment model with the NFM features incorpo-rated. Every variety of enhanced hillslope storage was
simu-lated using a single simple aggregated linear store model. It showed that the combined impact could have significantly at-tenuated the flood peak, even during the largest storm. It also showed that their effectiveness was contingent on how their drainage characteristics would allow them to recover capac-ity between events.
The study demonstrates that, given a computationally effi-cient modelling strategy, uncertainty estimation can be ap-plied to evaluation NFM. A well-established uncertainty analysis framework was used, whereby multiple realisations of a hillslope run-off model applied to the events were en-acted and scored with a likelihood function combining output criteria. Acceptable realisations were selected according to limits of acceptability of those criteria and were likelihood-weighted according to their score. This allowed results to be presented to project and catchment stakeholders alongside meaningful estimates of their uncertainty.
The representation is efficient and allows investigation of many different configurations whilst retaining the important aspects of their behaviour and impacts, namely storage addi-tion and residence times. It contains many assumpaddi-tions and simplifications, however, and a key aim of further work will be to determine whether other significant characteristics are adequately simulated in this representation, and which will require refinement. For example, in actual applications there is likely to be a more complex storage-water–depth rela-tionship than the straightforward equivalence used here. Hy-drodynamic analysis of simulated individual structures sited in realistic topographic representations may provide insights into the applicability of the simplification across a range of loading scenarios.
The storage values considered in this study were lumped into a single HRU to maximise computational efficiency. A more sophisticated approach could utilise many more clas-sifications that reflect their behaviour and impact on the run-off. This could include capacity, position on the hills-lope, distance from access tracks and the channel, sources of construction material, and type of location (e.g. within ephemeral channels, shallow hillslope accumulation areas or on the floodplain). More work will be needed to determine which of these characteristics will be most significant and how well classifications reflect actual implementations by NFM practitioners.
It may be that the most beneficial effect of additional hillslope storage is likely to be seen on a small scale in reaches immediately downstream of a feature or sets of fea-tures. It could be, even given the overall mitigation effect, that some asynchronous flood peaks in the unmodified catch-ment model became synchronised when the storage was troduced and thus reduced the overall effectiveness of the in-terventions. Much further work is required to better under-stand the synchronisation problem, particularly as catchment scale increases.
the extreme events that load features are rare, and gradual processes such as sediment deposition difficult to measure or simulate everywhere. An innovative experimental approach is needed to address these questions. Detailed hydrometric data are required, collected by instruments such as stage and flow gauges upslope, downslope and within features. How-ever only 6 % of NFM schemes in the UK currently have any type of monitoring (JBA Trust, 2015), although some moni-toring is now a condition of funding for some new schemes. The effects of the additional storage on the overall flood hy-drograph will be increasingly difficult to discern as the catch-ment size increases, including the potential for synchronic-ity effects. The methodology used in this paper, however, extended to incorporate better-supported representations of small-scale impacts due to feature emplacement, may pro-vide a productive way to advance research into natural flood management and its effectiveness.
Data availability. Simulation data presented in the text are avail-able at https://doi.org/10.13140/RG.2.2.19690.62409 (Metcalfe et al., 2018).
Competing interests. The authors declare that they have no conflict of interest.
Acknowledgements. This work was funded by the JBA Trust (project number W12-1866), the European Regional Develop-ment Fund, and the UK National EnvironDevelop-mental Research Council (NERC).
This paper is dedicated to the memory of Peter Metcalfe who recently lost his life in a climbing accident. He had just started to apply some of the methods presented here more widely. Someone of strong commitment to everything he did, he will be sorely missed by his friends and colleagues.
Edited by: Patricia Saco
Reviewed by: Simon Dadson and one anonymous referee
References
Barber, N. and Quinn, P.: Mitigating diffuse water pollution from agriculture using soft engineered runoff attenuation features, Area, 44, 454–462, 2012.
Beven, K.: A manifesto for the equifinality thesis, J. Hydrol., 320, 18–36, 2006.
Beven, K.: Rainfall-Runoff Modelling: The Primer, 2nd Edn., Wiley-Blackwell, Chichester, UK, ISBN-13: 978-0-470-71459-1, 2012.
Beven, K. and Binley, A.: The future of distributed models: model calibration and uncertainty prediction, Hydrol. Process., 6, 279– 298, 1992.
Beven, K. and Binley, A.: GLUE: 20 years on, Hydrol. Process., 28, 5897–5918, 2014.
Beven, K. and Freer, J.: A Dynamic TOPMODEL, Hydrol. Process., 15, 1993–2011, 2001a.
Beven, K. and Freer, J.: Equifinality, data assimilation, and uncer-tainty estimation in mechanistic modelling of complex environ-mental systems using the GLUE methodology, J. Hydrol., 249, 11–29, 2001b.
Beven, K. J. and Kirkby, M. J.: A physically based variable con-tributing area model of catchment hydrology, Hydrol. Sci. B., 24, 43–69, 1979.
Blanc, J., Wright, G., and Arthur, S.: Natural Flood Management knowledge system: Part 2 – The effect of NFM features on the desynchronising of flood peaks at a catchment scale, CREW re-port, 2012.
Blazkova, S. and Beven, K.: Flood frequency estimation by continu-ous simulation of subcatchment rainfalls and discharges with the aim of improving dam safety assessment in a large basin in the Czech Republic, J. Hydrol., 292, 153–172, 2004.
Blazkova, S. and Beven, K.: A limits of acceptability approach to model evaluation and uncertainty estimation in flood frequency estimation by continuous simulation: Skalka catchment, Czech Republic, Water Resour. Res., 45, 12, 2009.
Brater, E. F. and King, H. W.: Handbook of hydraulics for the solu-tion of hydraulic engineering problem, 6th Edn., McGraw-Hill, New York, 1976.
Calder, I. R. and Aylward, B.: Forest and floods: Moving to an evidence-based approach to watershed and integrated flood man-agement, Water Int., 31, 87–99, 2006.
Chow, V. T.: Open channel hydraulics, McGraw-Hill Book Com-pany, Inc., New York, 1959.
Dadson, S. J., Hall, J. W., Murgatroyd, A., Acreman, M., Bates, P., Beven, K., Heathwaite, L., Holden, J., Holman, I. P., Lane, S. N., O’Connell, E., Penning-Rowsell, E., Reynard, N., Sear, D., Thorne, C., and Wilby, R.: A restatement of the natural sci-ence evidsci-ence concerning catchment-based “natural” flood man-agement in the United Kingdom, UK Proc. R. Soc. A, 473, 20160706, https://doi.org/10.1098/rspa.2016.0706, 2017. Dummit, E.: Differential Equations (part 3): Systems
of First-Order Differential Equations, available at: https://math.la.asu.edu/~dummit/docs/lindiff_6_systems_of_ linear_differential_equations.pdf (last access: 24 April 2018), 2016.
EA – Environment Agency: River Eden, Cumbria, Catchment Flood Management Plan, Environment Agency, Bristol, UK, 2008. EA – Environment Agency: Benchmarking the latest generation of
2D hydraulic modelling packages, Report SC120002, Environ-ment Agency, Bristol, UK, ISBN: 978-1-84911-306-9, 2013. EA – Environment Agency: Working with natural processes to
re-duce flood risk, R and D framework, Report SC130004/R2, En-vironment Agency, Bristol, UK, 2014.
Ghimire, S., Wilkinson, M., and Donaldson-Selby, G.: Application Of 1D And 2D Numerical Models For Assessing And Visual-izing Effectiveness Of Natural Flood Management (NFM) Mea-sures, 2014.
Hankin, B., Metcalfe, P., Johnson, D., Chappell, N., Page, T., Craigen, I., Lamb, R., and Beven, K.: Strategies for Testing the Impact of Natural Flood Risk Management Measures, in: Flood Risk Management, edited by: Hromadka, T. and Rao, P., InTech, Czech Republic, ISBN: 978-953-51-5526-3, 2017.
Hunter, N. M., Bates, P. D., Horritt, M. S., and Wilson, M. D.: Sim-ple spatially-distributed models for predicting flood inundation: a review, Geomorphology, 90, 208–225, 2007.
Iacob, O., Rowan, J. S., Brown, I., and Ellis, C.: Evaluating wider benefits of natural flood management strategies: an ecosystem-based adaptation perspective, Hydrol. Res., 45, 774–787, 2014. JBA Trust: Nature-based approaches for catchment flood
man-agement: an online catalogue, Report W15-0603, available at: http://www.jbatrust.org/wp-content/uploads/2016/02/W15-0603 (last access: 24 April 2018), 2015.
Keef, C., Tawn, J. A., and Lamb, R.: Estimating the proba-bility of widespread flood events, Environmetrics, 24, 13–21, https://doi.org/10.1002/env.2190, 2013.
Lamb, R., Crossley, A., and Waller, S.: A fast 2D flood-plain inundation model, P. I. Civil Eng.-Wat. M., 162, https://doi.org/10.1680/wama.2009.162.6.363, 2009.
Lamb, R., Keef, C., Tawn, J., Laeger, S., Meadowcroft, I., Suren-dran, S., Dunning, P., and Batstone, C.: A new method to assess the risk of local and widespread flooding on rivers and coasts, J. Flood Risk Manag., 3, 323–336, https://doi.org/10.1111/j.1753-318X.2010.01081.x, 2010.
Lane, S. N.: Natural flood management, Wiley Interdisciplinary Reviews: Water, 4, available at: http://www.jstor.org/stable/ 23020839, 2017.
Lane, S. N., Odoni, N., Landström, C., Whatmore, S. J., Ward, N., and Bradley, S.: Doing flood risk science differently: an experi-ment in radical scientific method, T. I. Brit. Geogr., 36, 15–36, 2011.
Liu, Y., Freer, J., Beven, K., and Matgen, P.: Towards a limits of acceptability approach to the calibration of hydrological models: Extending observation error, J. Hydrol., 367, 93–103, 2009. Luscombe, D. J., Anderson, K., Gatis, N., Grand-Clement, E., and
Brazier, R. E.: Using airborne thermal imaging data to measure near-surface hydrology in upland ecosystems, Hydrol. Process., 29, 1656–1668, 2015.
Marsh, T. J., Kirby, C., Muchan, K., Barker, L., Henderson, E., and Hannaford, J.: The winter floods of 2015/2016 in the UK – a re-view, Centre for Ecology & Hydrology, Wallingford, UK, 2016. Matthews, T., Murphy, C., McCarthy, G., Broderick, C., and Wilby, R. L.: Super Storm Desmond: a process-based assessment, En-viron. Res. Lett., 13, 014024, https://doi.org/10.1088/1748-9326/aa98c8, 2018.
Metcalfe, P., Beven, K., and Freer, J.: Dynamic TOPMODEL: A new implementation in R and its sensitivity to time and space steps, Environ. Modell. Softw., 72, 155–172, 2015.
Metcalfe, P., Beven, K., Hankin, B., and Lamb, R.: A mod-elling framework for evaluation of the hydrological impacts of nature-based approaches to flood risk management, with appli-cation to in-channel interventions across a 29-km2scale catch-ment in the United Kingdom, Hydrol. Process., 31, 1734–1748, https://doi.org/10.1002/hyp.11140, 2017.
Metcalfe, P., Beven, K., Hankin, B., and Lamb, R.: Dynamic TOP-MODEL simulation runs supporting Metcalfe et al. (2018), avail-able at: https://doi.org/10.13140/RG.2.2.19690.62409, 2018.
Mosonyi, E.: Wassrekraftwerke, Band I, Niederdruckanlagen, Düs-seldorf, VDI Verlag, 1966.
Nash, J. E. and Sutcliffe, J. V.: River flow forecasting through con-ceptual models part I – A discussion of principles, J. Hydrol., 10, 282–290, 1970.
National Trust: From source to sea: natural flood management – the Holnicote experience, Final Report to Defra, National Trust, Swindon, UK, 2015.
Nicholson, A., Wilkinson, M., O’Donnell, G. M., and Quinn, P.: Runoff attenuation features: a sustainable flood mitigation strat-egy in the Belford catchment, UK, Area, 44, 463–469, 2012. Nisbet, T. and Page, T.: Case study 16. Pontbren catchment land use
change study, in: How to model and map catchment processes when flood risk management planning, edited by: Hankin, B., Burgess-Gamble, L., Bentley, S., and Rose, S., Science report SC120015/R1, Environment Agency, Bristol, UK, available at: http://evidence.environment-agency.gov.uk/FCERM/Libraries/ FCERM_Project_Documents/SC120015_case_study_16.sflb. ashx (last access: 23 December 2017), 2016.
Nisbet, T. R., Marrington, S., Thomas, H., Broadmeadow, S., and Valatin, G.: Slowing the flow at Pickering, Final Report to Defra, Project RMP5455, 2011.
Ockenden, M. C. and Chappell, N. A.: Identification of the dom-inant runoff pathways from data-based mechanistic modelling of nested catchments in temperate UK, J. Hydrol., 402, 71–79, 2011.
Page, T., Beven, K. J., Freer, J., and Neal, C.: Modelling the chlo-ride signal at Plynlimon, Wales, using a modified dynamic TOP-MODEL incorporating conservative chemical mixing (with un-certainty), Hydrol. Process., 21, 292–307, 2007.
Pattison, I., Lane, S. N., Hardy, R. J., and Reaney, M.: The role of tributary relative timing and sequencing in controlling large floods, Water Resour. Res., 50, 5444–5458, 2014.
Quinn, P., O’Donnell, G., Nicholson, A., Wilkinson, M., Owen, G., Jonczyk, J., Barber, N., Hardwick, M., and Davies, G.: Poten-tial use of Runoff Attenuation Features in small rural catchments for flood mitigation, Newcastle University, Environment Agency, Royal Haskoning DHV, England, 2013.
Scottish Environment Protection Agency (SEPA): The Natural Flood Management Handbook, avail-able at: http://www.sepa.org.uk/media/163560/ sepa-natural-flood-management-handbook1.pdf (last access: 23 December 2017), 2016.
Thomas, H. and Nisbet, T.: An assessment of the impact of flood-plain woodland on flood flows, Water Environ. J., 21, 114–126, 2007.
Werritty, A.: Sustainable flood management: oxymoron or new paradigm?, Area, 38, 16–23, 2006.
Wilkinson, M., Quinn, P., Benson, I., and Welton. P.: Runoff man-agement: mitigation measures for disconnecting flow pathways in the Belford Burn catchment to reduce flood risk, in: British Hydrological Society International Symposium, British Hydro-logical Society, Newcastle upon Tyne, 2010a.