https://doi.org/10.5194/hess-23-1611-2019 © Author(s) 2019. This work is distributed under the Creative Commons Attribution 4.0 License.
Projected decrease in wintertime bearing capacity on different
forest and soil types in Finland under a warming climate
Ilari Lehtonen1, Ari Venäläinen1, Matti Kämäräinen1, Antti Asikainen2, Juha Laitila2, Perttu Anttila2, and Heli Peltola3
1Finnish Meteorological Institute, 00101 Helsinki, Finland 2Natural Resources Institute Finland, 80100 Joensuu, Finland
3School of Forest Sciences, University of Eastern Finland, 80101 Joensuu, Finland
Correspondence:Ilari Lehtonen ([email protected])
Received: 12 December 2017 – Discussion started: 19 January 2018
Revised: 19 December 2018 – Accepted: 3 March 2019 – Published: 19 March 2019
Abstract. Trafficability in forest terrain is controlled by ground-bearing capacity, which is crucial from the timber harvesting point of view. In winter, soil frost affects the most the bearing capacity, especially on peatland soils which have in general low bearing capacity. Ground frost similarly af-fects the bearing capacity of forest truck roads. A 20 cm thick layer of frozen soil or 40 cm thick layer of snow on the ground may already be sufficient for heavy forest harvesters. In this work, we studied the impacts of climate change on soil frost conditions and, consequently, on ground-bearing capac-ity from the timber harvesting point of view. The number of days with good wintertime bearing capacity was modelled by using a soil temperature model with a snow accumulation model and wide set of downscaled climate model data un-til the end of the 21st century. The model was calibrated for different forest and soil types. The results show that by the mid-21st century, the conditions with good bearing capacity will decrease in wintertime in Finland, most likely by about 1 month. The decrease in soil frost and wintertime bearing capacity will be more pronounced during the latter half of the century, when drained peatlands may virtually lack soil frost in most of winters in southern and western Finland. The projected decrease in the bearing capacity, accompanied with increasing demand for wood harvesting from drained peatlands, induces a clear need for the development of sus-tainable and resource-efficient logging practices for drained peatlands. This is also needed to avoid unnecessary harvest-ing damages, like rut formation on soils and damage to tree roots and stems.
1 Introduction
Forests are the most important natural resource in Finland (Finnish Forest Research Institute, 2011). In 2016 the annual harvested volume of round wood in the country reached a new national record of 70 million m3(Natural Resources In-stitute Finland, 2017a, b). Pressure exists to increase this vol-ume up to 80 million m3within the next couple of decades to meet the increasing wood demand in the growing bioecon-omy sector (Ministry of Employment and the Econbioecon-omy et al., 2014; Asikainen et al., 2016). Preferably, the wood harvest-ing should be increased throughout the year to ensure con-tinuous supply of raw material for wood using industry. This may be challenging due to differences in bearing capacity of forest soils with varying soil types and weather conditions.
consump-tion in the harvesting (Sirén et al., 2013; Pohjankukka et al., 2016). Furthermore, the condition of the road network af-fects to the fuel consumption in timber transportation (Sven-son and Fjeld, 2016).
More than half of the original peat bog area in Finland was drained for forestry mainly during the 1960s and 1970s (Simola et al., 2012). Consequently, peatlands consist nowa-days of one-third of the Finnish forestry area and one-fourth of the growing stock volume (Ala-Ilomäki et al., 2011). In increasing the wood harvesting, more intensive utilization of drained peatland forests has the largest potential (Ala-Ilomäki et al., 2011) because of a pronounced reduction in suitable logging sites on upland (mineral) soils (Uusitalo and Ala-Ilomäki, 2013). However, more intensive utilization of peatlands is a controversial issue. Peatlands representing sen-sitive forest sites are generally characterized by the most dif-ficult forest harvesting conditions (Nugent et al., 2003; Uusi-talo and Ala-Ilomäki, 2013; UusiUusi-talo et al., 2015a). More-over, in addition to the increasing demand in wood harvest-ing from drained peatlands, pressure exists to restore drained peatlands to their natural state in order to maintain biodi-versity and prevent carbon loss and nitrous oxide emissions from peatlands (Komulainen et al., 1999; Carroll et al., 2011; Pitkänen et al., 2013; Pärn et al., 2018).
The difficult harvesting conditions in drained peatlands are because of their inherently low ground-bearing capac-ity. Thus, logging there is generally conducted during win-ter, when the soil is frozen (Ala-Ilomäki et al., 2011). Nev-ertheless, soil frost periods are shorter in drained peatlands than in upland forest sites because of the insulating effect of peat compared to upland (mineral) soils. In addition, ditch networks form obstacles for vehicles in peatlands. They are neither typically located next to the forest truck roads, and trees are characterized by small size, uneven distribution and superficial roots (Laitila et al., 2013). Hence, wood harvest-ing in drained peatlands is in general less cost efficient than in upland forest sites (Ala-Ilomäki et al., 2011). Determined efforts are thus required to prolong the wood harvesting sea-son from drained peatlands. This would provide an oppor-tunity to increase the annual harvesting volume and confine seasonal variations in harvesting.
During the forthcoming decades, climate has been pro-jected to become warmer due to the anthropogenic climate change (Collins et al., 2013; Knutti and Sedláˇcek, 2013). The climate warming is expected to be pronounced in high latitudes like in Finland (Räisänen and Ylhäisi, 2015; Ru-osteenoja et al., 2016). Previous studies have indicated that the climate warming leads, unsurprisingly, to reduced soil frost depth and shorter soil frost periods (e.g. Venäläinen et al., 2001a, b; Kellomäki et al., 2010; Gregow et al., 2011; Jungqvist et al., 2014). This may shorten the winter harvest-ing season with good ground-bearharvest-ing capacity, particularly on drained peatlands, having thus mainly negative impacts on the forestry sector. Thus, comprehensive understanding of expected changes in soil frost conditions is utmost
impor-tant as these changes affect wood harvesting conditions and transport availability. This is also needed to develop logging practices that are at the same time both sustainable and cost-efficient and meet the required increase in wood supply for the bioeconomy and climate change mitigation goals.
There are several models designed for calculation of soil temperatures (e.g. Yin and Arp, 1993; Rankinen et al., 2004; Jansson, 2012; Barrere et al., 2017; Park et al., 2017). In principle, the models approximate the solutions of differen-tial equations describing water and heat flow. In conjunction with climate model data, these models can be utilized in eval-uating the climate change impacts on soil temperature and frost conditions (e.g. Sinha and Cherkauer, 2010; Houle et al., 2012; Jungqvist et al., 2014; Oni et al., 2017). In addi-tion to air temperature, the soil frost formaaddi-tion is affected by soil properties like heat capacity and thermal conductivity. In addition, snow, as an efficient insulator of heat flow, has large influence on soil frost. Snow depth in a spatially vary-ing terrain varies even within short distances dependvary-ing on vegetation and topography leading to variations in soil frost depth.
the bearing capacity in different forest stands over different periods has been made publicly available.
2 Material and methods
2.1 Description of soil temperature model and its parametrization and validity
2.1.1 Description of soil temperature model
Soil temperatures were calculated by using an extended version of soil temperature model originally introduced by Rankinen et al. (2004). The model is derived from the law of conservation of energy and mass, assuming constant wa-ter content in the soil. This assumption simplified the model considerably, with the expense of its validity under extremely wet and dry conditions. According to the model, soil temper-ature at depthZScan be calculated as follows:
TZt+1=TZt + 1t·KT CA·(2·ZS)2
·TAIRt −TZt, (1) whereTZt (◦C) is the soil temperature on a previous day,TAIR
(◦C) is the air temperature,1tis the length of a time step (s), KT(W m−1◦C−1) is the thermal conductivity of the soil and CA(J m−3◦C−1) is the heat capacity of the soil.CA can be
approximated as follows:
CA≈CS+CICE, (2)
whereCS (J m−3◦C−1) is the specific heat capacity of the
soil andCICE(J m−3◦C−1) is the specific heat capacity due
to freezing and thawing. WhenTZt>0◦C, the latter variable equals 0.
As Eq. (1) did not take the insulating effect of snow cover into account, the equation was extended by an empirical re-lationship (Rankinen et al., 2004):
TZt+1=TZt+
1t·KT
(CS+CICE)·(2·ZS)2
·TAIRt −TZt
· [e−fS·DS], (3) wherefS (m−1) is an empirical damping parameter andDS
(m) is snow depth. This model assumed that there is no heat flow below the soil layer of consideration. To extend the model, Jungqvist et al. (2014) added parameters controlling the lower soil thermal conductivityKT,LOW (W m−1◦C−1),
lower soil specific heat capacity CS,LOW (J m−3◦C−1), and
lower soil temperatureTLOW(◦C): TZt+1=TZt+ 1t·KT
(CS+CICE)·(2·ZS)2
·TAIRt −TZt ·
h
e−fS·DSi
+ 1t·KT,LOW
CS,LOW+CICE
·2·(Zl−ZS)2
· [TLOW−TZt], (4) whereZl(m) is the depth whereTLOWprevails.
We assumedTLOWto be equal to the mean 2 m air
temper-ature of previous 365 days, and the values of parametersKT,
CS,CICE,fS,KT,LOW,CS,LOWandZlwere calibrated based
on soil temperature observations (see the detailed description in the Sect. 2.1.2). According to forest harvesting special-ists, a 20 cm thick layer of frozen soil or 40 cm thick snow cover makes the terrain passable for heavy harvesters, even in soil types characterized by low bearing capacity (Eeron-heimo, 1991). Keeping this in mind, the emphasis on cali-brating the parameters was given near the surface. Moreover, the parameters controlling heat flow below the soil layer un-der consiun-deration had only a negligible effect on modelled soil temperatures near the surface.
2.1.2 Parametrization of soil temperature model In the calibration of the parameters, we used soil tempera-ture observations from the stations listed in Table 1. The idea was to search for typical values for the parameters in differ-ent soil types. The model was allowed to spin up for 1 year to reach thermal equilibrium in all of our calculations. Soil tem-peratures were measured every fifth day; except at Lettosuo (Korkiakoski et al., 2017), Apukka, Lompolojänkkä (Aurela et al., 2015) and Kaamanen (Aurela et al., 2001), the mea-surements were available on a daily basis. However, there were some time periods with missing data at these sites. The stations represented different soil types. The soil types were extracted from Soveri and Varjo (1977) and Heikinheimo and Fougstedt (1992), except for at the Lettosuo, Apukka, Lom-polojänkkä and Kaamanen stations. According to the soil type map provided by the Geological Survey of Finland, the soil type at Apukka station is till. The Lettosuo station is sit-uated in a drained peat bog, and the stations Lompolojänkkä and Kaamanen are located on open fen (minerotrophic peat-lands). Snow depth measurements needed in the calculations were not available from Lettosuo, Lompolojänkkä and Kaa-manen stations, and at these sites, snow depths measured at nearby stations were thus used in the model calibration. The replacement stations were Jokioinen for Lettosuo, Kent-tärova for Lompolojänkkä and Inari for Kaamanen. Daily mean temperatures used in the model calibration were ex-tracted from a gridded data set covering Finland (Aalto et al., 2016).
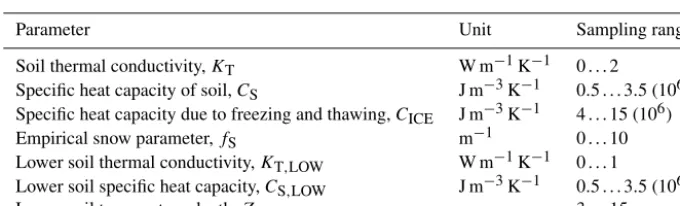
First, the parameter values were calibrated for each station and at different measurement depths using a Monte Carlo approach. The sampling ranges for the parameters (Table 2) were adopted from Jungqvist et al. (2014) but forKTthe
up-per limit was extended from 1 to 2 W m−1K−1to better rep-resent the range of soil types and measurement depths con-sidered in our study.
Ta-Table 1.Soil temperature measurement data used in the calibration of soil temperature model.
Station name Latitude Longitude Soil type Soil temperature measurement depths Observation period
Lettosuo 60◦3803100N 23◦5703500E Peat 5, 15, 30 and 40 cm 2009–2014
Anjala 60◦4104700N 26◦4804000E Clay–silt 10, 20, 30, 50, 70, 100, 150 and 200 cm 2007–2014
Jyväskylä 62◦2305100N 25◦4001500E Silt 10, 20, 30, 70, 100, 150 and 200 cm 2007–2014
Ylistaro 62◦5601700N 22◦2902000E Silt–clay 20, 50, 100, 200 and 300 cm 2007–2014
Maaninka 63◦803600N 27◦1804700E Fine sand–silt 10, 20, 30, 50, 70, 100, 150 and 200 cm 2007–2014
Apukka 66◦3404600N 26◦004000E Till 10, 20, 30, 50, 70, 100, 150 and 200 cm 2007–2014
Sodankylä 67◦2106000N 26◦3704400E Sand–gravel 10, 20, 30, 50, 70, 100, 150 and 200 cm 2007–2014
Lompolojänkkä 67◦5905000N 24◦1203300E Peat 5, 15 and 30 cm 2007–2009
Kaamanen 69◦802600N 27◦1601100E Peat 5, 15 and 30 cm 2004–2012
[image:4.612.60.534.85.219.2]Kevo 69◦4502300N 27◦002400E Sand 10, 20, 50, 100 and 200 cm 2007–2014
Table 2.Parameter ranges for the model calibration simulations.
Parameter Unit Sampling range
Soil thermal conductivity,KT W m−1K−1 0. . .2
Specific heat capacity of soil,CS J m−3K−1 0.5. . .3.5 (106)
Specific heat capacity due to freezing and thawing,CICE J m−3K−1 4. . .15 (106)
Empirical snow parameter,fS m−1 0. . .10
Lower soil thermal conductivity,KT,LOW W m−1K−1 0. . .1
Lower soil specific heat capacity,CS,LOW J m−3K−1 0.5. . .3.5 (106)
Lower soil temperature depth,Zl m 3. . .15
ble S1 shows the calibrated values with their standard devi-ations after the first calibration round, as averaged over all the validation stations at 10 and 20 cm depths. At this point, Zl andfS, without a clear physical connection to local soil
properties, were set to their final values. CalibratedZlvalues
varied rather randomly within the sampling range, implying that it was only marginally important parameter. The average for calibratedZlvalues over all the stations and measurement
depths was 6.8 m, andZlwas set to that value. The calibrated
values offSvaried between 9 and 10, with soil depths below
50 cm except at two stations. With increasing soil depth, cal-ibrated fS values tended to generally decrease. Keeping in
mind that we were most interested in the depths up to 20 cm, we setfSto 9.0.
During the second calibration round, the soil temperature model was run an additional 100 000 times with the fixed Zl andfS values while the other parameters were sampled
again. After this second calibration round, all other param-eters exceptKT were also set to their final values.KT,LOW
and CS,LOW were given the same values at all depths and
locations, as there was no clear relationship between their calibrated values and measurement depth or soil type, most likely because the heat flow from Zl was only marginally
important compared to the heat flow from the surface, partic-ularly near the surface.CICE was set to 11.0 J m−3K−1,
ex-cept at Sodankylä and Kevo with sandy soil, which were set to 8.0 J m−3K−1. CalibratedCSvalues were mainly close to
the lower limit of sampling range with depths below 100 cm,
while near the surface, calibrated values were clearly higher. Thus,CS was set to depend on the soil depth following an
asymmetrical sigmoid function by using the calibrated val-ues averaged across all the stations and measurement depths. Then, the soil temperature model was run 10 000 times again to sample only theKTvalues. In the final phase of the
calibration, we sampled only theKTvalues, asKTis clearly
the most sensitive parameter in the soil temperature model (Jungqvist et al., 2014). The calibratedKTvalues tended to
increase with soil depth at each location (Fig. 1). Anjala, Sodankylä and Lettosuo stations were selected to represent clay–silt, sand and peat soil types, respectively. At these sta-tions, there were not much variability in soil type with differ-ent depths, and calibratedKTvalues steadily increased with
increasing soil depth. Moreover, there were no missing ob-servation depths at these stations. For the three soil types, KT was then estimated by fitting a logistic regression curve
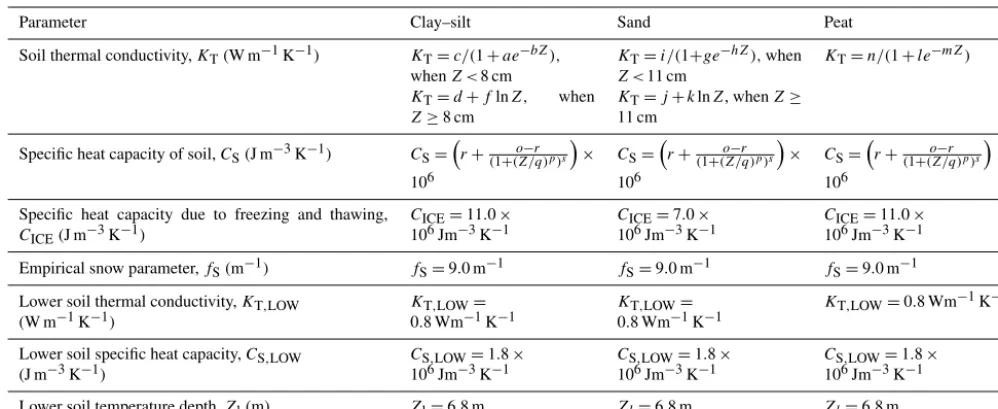
on the calibrated values on these three representative stations (Fig. 1). The final calibrated parameters used in the soil tem-perature calculations describing clay–silt, sand and peat soils are listed in Table 3.
[image:4.612.129.469.256.359.2]Table 3.Calibrated parameters of soil temperature model for different soil types. The values of parameters are as follows:a=25.788, b=0.18029,c=0.71240,d= −0.58616,e=2.7183,f =0.33272,g=18.231,h=0.17401,i=1.0885,j= −1.0703,k=0.57526,l= 19.217,m=0.18222,n=0.20835,o=1.8970,p=124.76,q=24.398,r=0.46356,s=0.010773 andZ=soil depth (cm).
Parameter Clay–silt Sand Peat
Soil thermal conductivity,KT(W m−1K−1) KT=c/(1+ae−bZ), whenZ <8 cm
KT=d+flnZ, when
Z≥8 cm
KT=i/(1+ge−hZ),when
Z <11 cm
KT=j+klnZ, whenZ≥ 11 cm
KT=n/(1+le−mZ)
Specific heat capacity of soil,CS(J m−3K−1) CS=
r+ o−r (1+(Z/q)p)s
×
106
CS=
r+ o−r (1+(Z/q)p)s
×
106
CS=
r+ o−r (1+(Z/q)p)s
×
106
Specific heat capacity due to freezing and thawing,
CICE(J m−3K−1)
CICE=11.0× 10⁶Jm−3K−1
CICE=7.0× 10⁶Jm−3K−1
CICE=11.0× 10⁶Jm−3K−1
Empirical snow parameter,fS(m−1) fS=9.0 m−1 fS=9.0 m−1 fS=9.0 m−1
Lower soil thermal conductivity,KT,LOW (W m−1K−1)
KT,LOW= 0.8 Wm−1K−1
KT,LOW= 0.8 Wm−1K−1
KT,LOW=0.8 Wm−1K−1
Lower soil specific heat capacity,CS,LOW (J m−3K−1)
CS,LOW=1.8× 10⁶Jm−3K−1
CS,LOW=1.8× 10⁶Jm−3K−1
CS,LOW=1.8× 10⁶Jm−3K−1
[image:5.612.49.286.299.465.2]Lower soil temperature depth,Zl(m) Zl=6.8 m Zl=6.8 m Zl=6.8 m
Figure 1.CalibratedKTvalues at each soil temperature
measure-ment site and depth. Logistic regression curves fitted to the data from Anjala, Sodankylä and Lettosuo stations and representing clay–silt, sand and peat soil types, respectively, are shown as well.
2.1.3 Validity of the modelled soil temperatures Apart from the three stations (Lettosuo, Anjala and So-dankylä) used in calibration ofKTin the final phase of model
calibration, the modelled soil temperatures for clay–silt and sand soil types typically explained 90 %–99 % of the ob-served variability in soil temperatures between the depths of 20 and 100 cm (Table S2). Near the surface as well as be-low 1 m the modelled temperatures correlated slightly worse with the observed ones. In spite of the generally high corre-lations, the modelled number of days with soil temperatures below 0◦C were still greatly overestimated, even by more than twofold at many stations (not shown). Thus, we also tested setting the model parameters by calibrating the mod-elled number of days with soil temperatures below 0◦C, but
the correlations between observed and modelled soil tem-peratures became clearly worse,R2 values dropping below 0.9 even at best (not shown). In order to estimate the num-ber of days more realistically with frozen soil, we thus as-sumed in our model calculations that the soil does not freeze completely until the soil temperature drops below−0.1◦C in sand or below−0.5◦C in other soil types as some super-cooling in the soil is needed to initiate the process of freezing (Kozlowski, 2009). For instance, in kaolinite clay, ice lenses start to form in temperatures between −0.2 and −0.3◦C based on experiments and theoretical calculations (Style et al., 2011). At the depth of 20 cm, this reduced the number of soil frost days only by a few days in sand but roughly by 1 month in clay–silt and approximately 1–3 months in peat. The choice of freezing points was based on a study by Soveri and Varjo (1977), who stated that the freezing point in sat-urated sandy soil lies between 0 and−0.15◦C and around −0.5◦C in thin clay. Based on their study, in thick clay the freezing point can be as low as−20◦C because the finer the soil texture is, the stronger adsorption water and capillary water bound around the soil particles by reducing the freez-ing point. The meltfreez-ing point of soil was still set to 0◦C in all of our calculations.
2.2 Description of snow model and its parametrization and validity
2.2.1 Description of snow model
In order to estimate the snow depthDS needed in the soil
depth calculations are the daily mean air temperature and daily total precipitation sum. First, the precipitation is di-vided into liquid and solid forms of precipitation as follows (Hankimo, 1976; Vehviläinen, 1992):
Psolid=Ptot, whenTmean≤ −2.0◦C, Psolid=
− Tmean 8 + 3 4
·Ptot,when −2.0◦C< Tmean≤0.0◦C,
Psolid=
−
25Tmean
90 +
3 4
·Ptot, when 0.0◦C< Tmean≤0.9◦C,
Psolid=
−
5Tmean
8 +
17 16
·Ptot, when 0.9◦C< Tmean≤1.3◦C,
Psolid=
− Tmean 8 + 33 80
·Ptot,when 1.3◦C< Tmean≤3.3◦C,
Psolid=0,whenTmean>3.3◦C,
Pliquid=Ptot−Psolid, (5)
wherePsolid(mm) is the amount of solid precipitation,Pliquid
(mm) is the amount of liquid precipitation,Ptot(mm) is the
total amount of precipitation andTmean(◦C) is the 2 m daily
mean air temperature.
The used snow model calculates the snow water equivalent (SWE) and density of snowpack. The SWE (mm) is divided into two components as follows:
SWE=SWEnew+SWEold, (6)
where SWEnew (mm) is the amount of the SWE
accumu-lated on the day considered and SWEold(mm) describes the
amount of snowpack left from the previous day. SWEnewis
calculated as follows:
SWEnew=cps·Psolid+SWEinc,liq, (7)
where cps is a correction factor for solid precipitation and SWEinc,liq(mm) is the increase of water storage in snowpack
due to liquid precipitation. SWEinc,liqis limited by the water
retention capacity of snowpack (WH), which is proportional to the total amount of snowpack and is thus determined as follows:
WH=a·SWEold, (8)
whereais an empirical coefficient. SWEinc,liqis furthermore
defined as follows:
SWEinc,liq=Pliquid, whenPliquid≤WH,
SWEinc,liq=WH,whenPliquid>WH. (9)
A decrease in the SWE is caused both by evaporation from snowpack and by melting. Snowmelt is caused by thaw and liquid precipitation. Rainfall affects snowmelt directly by heating snowpack but, more importantly, also by creating drains in the snowpack and accelerating the ripening process
of snow cover. SWEoldis then calculated as follows:
SWEtold+1=SWEtold+SWEnewt − [kmt· Tmeant −tm−pm ·Pliquidt · Tmeant −tm−
ev] ·1t, (10)
where km (mm◦C−1d−1) is a degree-day factor, tm (◦C) is the threshold air temperature for snowmelt, pm (◦C−1d−1) is a melt factor related to liquid precipitation and ev (mm d−1) is evaporation from snowpack. The degree-day factor km is calculated as follows (Anderson, 1973):
km=kmax+kmin
2 +sin
2N·5
366
·(kmax−kmin), (11) where kmax (mm◦C−1d−1) is the degree-day factor on
21 June, kmin (mm◦C−1d−1) is the degree-day factor on
21 December and N is the day number beginning on 21 March.
Density of snow is calculated separately for new and old snow. Density of freshly fallen snow (ρs,new) is calculated as
follows:
ρs,new=b·Tmean+c,whenρs,new≥ρs,newmin, (12)
whereb(kg m−3◦C−1) andc(kg m−3) are empirical coeffi-cients andρs,newmin (kg m
−3) is the minimum possible
den-sity of freshly fallen snow.
Density of old snow (ρs,old) is increased due to aging,
thawing and liquid precipitation and is thus calculated as fol-lows:
ρst,old=ρst−1+(ρs,inc+ρs,inc,rain·Pliquid)·1t,
whenρst,old≤ρsmax, (13)
where ρst−1 (kg m−3) is the density of snowpack on a previous day, ρs,inc (kg m−3d−1) is the density
incre-ment due to aging and thawing of snowpack, ρs,inc,rain
(kg m−3mm−1d−1) is the density increment due to liquid precipitation, and ρsmax (kg m
−3) is the maximum possible
density of snowpack.ρs,inc (kg m−3d−1) is defined as
fol-lows:
ρs,inc=ρs,inc,age, whenTmean≤0◦C,
ρs,inc=ρs,inc,age+ρs,inc,thaw·Tmean,whenTmean>0◦C, (14)
where ρs,inc,age (kg m−3d−1) is a coefficient defining the
density increment of snowpack due to aging andρs,inc,thaw
(kg m−3◦C−1d−1) is a coefficient related to the density in-crement of snowpack due to thawing.
Finally,DS(m) is calculated as follows:
DS=
SWEnew ρS,new
+SWEold ρS,old
. (15)
2.2.2 Parametrization of snow model
pm, ev, kmax, kmin,ρs,newmin,ρsmax,ρs,inc,rain,ρs,inc,ageand
ρs,inc,thawfrom the parameter ranges shown in Table 4. Then,
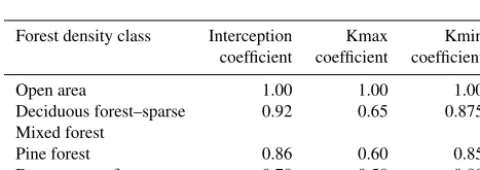
the model was run with each of these 10 000 set of parame-ters for the seven stations with soil temperature observations covering the period 2007–2014 (Table 1). The snow model was run over the period 1961–2014 by using the Finnish grid-ded climate data (Aalto et al., 2016), and the period 2006– 2014 was used as the calibration period for the snow model. We minimized the root-mean-square error (RMSE) between modelled and observed snow depths on the stations during the calibration period by selecting the set of parameters in-dicating the smallest RMSE on each station. Then, the cali-brated parameters were averaged among all the seven stations to give the final parameters for the snow model (Table 4). Ex-ceptions were kmax and kmin, which seemed to show a lati-tudinal dependence as expected. These parameters were thus approximated by latitudinally dependent exponent functions. During the calibration period 2006–2014, the snow model with calibrated parameters shown in Table 4 explained 94 %– 96 % of the observed variability in snow depth, except at Apukka, where theR2value was only 0.84 (Table S3). When using the parameters calibrated for each station before av-eraging, the R2values were on average approximately 0.01 higher (not shown). We also tested the model with fixed kmax and kmin values averaged similarly to the other pa-rameters; then the R2 values were on average 0.003 lower than those showed in Table S3. Except at Apukka, the model performance was in this case slightly worse at every station. As the snow depth measurement sites are located in open environments, the calibrated parameters shown in Ta-ble 5 were used to model snow depth in open habitats. In forested areas, snow cover is reduced due to interception by the canopy, evaporation of the intercepted snow and en-hanced wintertime snowmelt below the canopy (Hedstrom and Pomeroy, 1998; Varhola et al., 2010). Interception typ-ically increases with increasing forest density and the leaf area index (Lundberg and Koivusalo, 2003; Rasmus et al., 2013). Interception can be as high as nearly 50 % of precip-itation (Stähli and Gustafsson, 2006). In order to model the soil frost in different kind of forest stands, we added an inter-ception coefficient to the snow model. In addition to open habitats, the calculations were performed for forests with three different density classes, corresponding roughly to de-ciduous forest or sparse mixed forest, pine forest and dense spruce forest. The interception coefficients for these forest stands were extracted from Lundberg and Koivusalo (2003). To reduce the modelled snow cover in forests, SWEnewwas
multiplied with the interception coefficient in every time step.
Forest canopy also shelters snow cover from direct sun-light which reduces the degree-day factor. In general, the denser the forest, the slower the melting proceeds. Vehviläi-nen (1992) presented experimental degree-day factors for open and forested areas for different river catchments and also based on earlier studies for both open areas and for dif-ferent kind of forests (Gurevich, 1950; Hiitiö, 1982). Based on Vehviläinen (1992), the degree-day factor is typically 30 %–60 % smaller in forests compared to open areas, de-pending on river catchment and the time of the melting sea-son, but the estimates were quite variable. Hiitiö (1982) con-cluded that the degree-day factor in spruce forests is re-duced by 28 % from its value in open areas, whereas Gure-vich (1950) suggested a reduction of over 60 % in dense spruce forests. In general, the reduction is smaller in the be-ginning of the melting season, as solar radiation increases to-wards summer. We used rough estimates for the degree-day factor in different forest types based on the literature review presented by Vehviläinen (1992).The coefficients used in re-ducing kmax and kmin as well as the interception coefficients used in this study for different forest types are shown in Ta-ble 5.
2.2.3 Validity of the modelled snow depths
Table 4.Parameter ranges for snow model calibration and the calibrated parameter values.
Parameter Unit Sampling range Calibrated value∗
a 1 0.0. . .0.3 0.160975225
b kg m−3◦C−1 0. . .20 7.41216035
c kg m−3 100. . .250 218.46983092
cps 1 1.0. . .1.5 1.3065380539
tm ◦C −1.0. . .2.0 −0.4674846189
pm ◦C−1d−1 0.0. . .1.0 0.4355929409
ev mm d−1 0.0. . .0.2 0.0787463821
kmax mm◦C−1d−1 2.5. . .15.0 0.26291311×e0.03958291×λ
kmin mm◦C−1d−1 0.1. . .2.5 1044.72422×e−0.1025652×λ
ρs,newmin kg m−3 30. . .100 60.42091336
ρsmax kg m−3 200. . .400 291.42990453
ρs,inc,rain kg m−3mm−1d−1 0. . .10 5.40364768
ρs,inc,age kg m−3d−1 0. . .20 2.67193647
ρs,inc,thaw kg m−3◦C−1d−1 0. . .20 6.22849401
∗e=2.718281828459.λis latitude in degrees north.
Table 5.Interception coefficients, kmax coefficients and kmin co-efficients used in this study for different forest types.
Forest density class Interception Kmax Kmin
coefficient coefficient coefficient
Open area 1.00 1.00 1.00
Deciduous forest–sparse 0.92 0.65 0.875
Mixed forest
Pine forest 0.86 0.60 0.85
Dense spruce forest 0.70 0.50 0.80
undercatch of snowfall before 1981 (Taskinen and Söder-holm, 2016).
2.3 Simulation of soil frost and snow depth for different forest and soil types under changing climatic conditions
The soil frost and snow depth calculations were performed for each possible combination of three soil types and four forest types to evaluate the changes in soil bearing capacity. In addition, the calculations were performed for forest truck roads without snow cover, leading to a total of 13 different combinations of soil and forest types. Calculations for each of these soil and forest types were performed on every grid cell. The simulation results were analysed for the near-future period 2021–2050 and for the far-future period 2070–2099 as compared to the baseline period 1981–2010. In addition, over the baseline period the soil temperature and snow depth mod-els were also run by using the observational Finnish gridded climate data (Aalto et al., 2016). We modelled the number of days with good bearing capacity in the forest harvesting point of view. Good bearing capacity was assumed to prevail when the soil frost penetrated continuously from the surface to at
least the depth of 20 cm or when the snow depth exceeded 40 cm.
The calculations for the period 1980–2099 under chang-ing climate were completed uschang-ing daily data from six GCMs (listed in Table S4) participating in the CMIP5 (Taylor et al., 2012; Flato et al., 2013). In addition, we used daily data from 11 bias-adjusted RCM simulations (listed in Table S5) con-structed within the EURO-CORDEX project (Jacob et al., 2014). The variables used in this study were daily mean 2 m air temperature and daily precipitation sum.
The GCMs were chosen on the basis of their skill to sim-ulate present-day average monthly temperature and precip-itation climatology in northern Europe. However, the GCM outputs are always more or less biased and presented on a rel-atively coarse grid. Hence, before soil temperature calcula-tions, for the GCM data, we performed a combined bias cor-rection and statistical downscaling from a lower to a higher resolution (Maraun and Widmann, 2018). In this procedure, the distributions of downscaled weather variables were mod-ified to correspond the observed distributions within the cal-ibration period (1981–2010 in our case) in the resolution of the observational data set. Then, the same corrections were applied to the whole simulation period. As our observational data set, we used the Finnish gridded climate data on a reg-ular 0.1◦×0.2◦grid (Aalto et al., 2016). The combined sta-tistical downscaling and bias correction was performed by applying a quantile mapping technique using smoothing. A detailed evaluation of this procedure for correcting simu-lated temperature time series was presented by Räisänen and Räty (2013) and, for correcting simulated precipitation time series, by Räty et al. (2014).
[image:8.612.46.286.340.425.2]simulations were constructed in the Institut Pierre Simon Laplace (IPSL) using a cumulative distribution function (CDF) method (Vrac et al., 2016). They were downscaled onto the EUR-11 CORDEX domain with a horizontal res-olution of ∼0.11◦×0.11◦ by using the Water and Global Change Forcing Data ERA-Interim (WFDEI) meteorologi-cal forcing data set (Weedon et al., 2014) over the meteorologi-calibration period 1979–2014. Before soil temperature calculations, we linearly interpolated the RCM data onto the same 0.1◦×0.2◦ grid with the GCM data.
Both GCM and RCM model ensembles were based on the RCP4.5 and RCP8.5 scenarios (van Vuuren et al., 2011), which are widely used in climate change impact studies. The RCP4.5 scenario represents a world characterized by rel-atively well-succeeded mitigation of greenhouse gas emis-sions, and in that scenario, the radiative forcing stabilizes at 4.5 W m−2in 2100. The RCP8.5 scenario, on the other hand, represents a world without any efficient mitigation activities applied and leads to radiative forcing and climate warming almost twice as large on the global scale by 2100. In Finland, the projected increases in mean annual temperature and pre-cipitation are up to 6◦C and 18 % under the RCP8.5 scenario, respectively, when the atmospheric CO2 concentration
ap-proaches 1000 ppm by 2100 (Ruosteenoja et al., 2016). The increases in temperature and precipitation are both predicted to be clearly higher in winter months than in summer.
3 Results
3.1 Wintertime bearing capacity during the baseline period 1981–2010
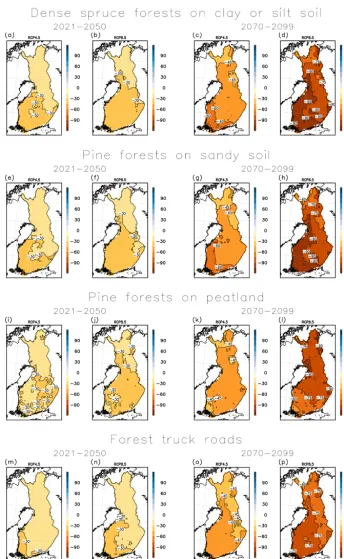
[image:9.612.307.550.90.587.2]The modelled annual average number of days with good win-tertime bearing capacity during 1981–2010 based on obser-vational weather data in three different forest types common in Finland, i.e. dense Norway spruce (Picea abies) forests on clay or silt soil, Scots pine (Pinus sylvestris) forests on sandy soil, and Scots pine forests on peatlands, is shown in the left column of Fig. 2. The number of days with good wintertime bearing capacity on forest truck roads is shown as well. Up-land forests on sandy soil generally have most, and forests on drained peatlands the least, days with good bearing capacity, as the soil frost penetrates fastest in sand and slowest in peat. The winter period with good bearing capacity lasts on aver-age approximately 5–7 months in northern Finland, depend-ing on forest and soil type. In the central parts of the coun-try, the wintertime bearing season lasts about 3–4 months on drained peatlands and roughly about 5 months on other soil types. In the coastal areas of southern and southwestern Finland, the length of the bearing season varies typically be-tween 2 and 4 months per winter depending on the soil type. On forest truck roads, the bearing season is modelled to last about 3–4 months per winter in southern Finland and about half a year in northernmost Finland.
The used models generally reproduce the spatial pattern of wintertime bearing season length during the baseline pe-riod as expected, as the model data has been bias corrected. In the GCM ensemble, the difference in the number of days with good bearing capacity between the multi-model ensem-ble and model calculations using observational weather data tend to be, almost everywhere, even less than 5 days, ex-cept in pine-dominated drained peatland forests, where the bearing season length is locally overestimated by 20 days (Fig. 2h). In the RCM ensemble, the agreement between the calculations using model data and observational weather data is generally poorer, but the difference in the number of days with good bearing capacity is still less than 10 days over most of Finland.
3.2 Wintertime bearing capacity during the future periods 2021–2050 and 2070–2099
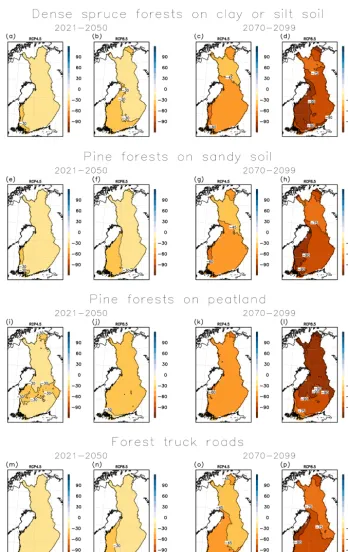
The projected change in the average wintertime bearing sea-son length for the above-mentioned forest types and for for-est truck roads is displayed in Fig. 3 for the GCM ensemble and in Fig. 4 for the RCM ensemble. The wintertime bear-ing season is projected to shorten by roughly 1 month for the near-future period 2021–2050. The change is only a lit-tle smaller under the RCP4.5 than the RCP8.5 scenario. The GCM and RCM ensembles indicate rather similar changes. The projected change is moreover rather similar among the different soil types.
For the far-future period 2070–2099 the projected short-ening of the wintertime bearing season is clearly more pro-nounced. In addition, the difference in the magnitude of change between the two forcing scenarios becomes larger. If the high-emission RCP8.5 scenario is realized, the bearing season may shorten by more than 3 months over large parts of the country. On drained peatlands, the change remains smaller in southern Finland, as the bearing season there al-ready lasts less than 3 months per winter during the baseline period. On the other hand, in upland forests on sandy and clay or silt soil types the projected shortening of bearing sea-son is largest in southern and western Finland. In these ar-eas, the bearing season is also projected to shorten by about 2 months under the RCP4.5 scenarios.
The projected change in the wintertime bearing season length on forest truck roads accompanies the projected change on different forest types, especially on sandy and clay or silt soil types. By mid-century, the wintertime bearing sea-son on forest truck roads may shorten by more than 1 month in western Finland. At the end of the 21st century, the bear-ing season on forest truck roads that may last even on average only about 1 month per winter in the southwestern parts of the country of the RCP8.5 scenario will be realized.
3.3 Interannual variability in the wintertime bearing season length
Interannual variability in the wintertime bearing season length is illustrated in Fig. 5. Here we show only the results derived from the GCM ensemble and only for pine forests on drained peatlands, as they are the most difficult sites for for-est harvfor-esting. During the baseline period, the bearing sea-son length exceeds 1 month in more than 80 % of the win-ters, except in the coastal areas in southern and southwest-ern Finland (Fig. 5d). In Lapland, the bearing season lasts 2–3 months even in the mildest winters, but at the southwest-ern coast, the mildest winters do not express good bearing capacity on any day (Fig. 5c). During the near-future pe-riod 2021–2050, the share of winters with less than 1 month of good bearing capacity is projected to somewhat increase, particularly in southern and western Finland (Fig. 5h and l). However, over most of Finland a large majority of win-ters still have a sufficient amount of days with good bearing capacity, although the conditions during the mildest winters are projected to become more difficult. For the far-future pe-riod, 2070–2099, the situation is projected to change more considerably, particularly if the RPC8.5 scenario is realized (Fig. 5q–t). Based on the multi-GCM mean, only a few win-ters express longer than 1 month bearing season in southern and western Finland (Fig. 5t). Even in eastern Finland and southwestern Lapland, the bearing season length is projected to exceed 1 month only approximately in every other win-ter. During the mildest winters, soil frost may penetrate to 20 cm or snow depth exceed 40 cm only in localized areas in northern Finland.
3.4 Intermodel variability in the projected wintertime bearing season length
Figure 4.As in Fig. 3 but for multi-RCM mean change.
meaning that even during the coldest winters, soil frost would not penetrate to 20 cm. The coldest model projections, on the other hand, indicate that the wintertime bearing season length would shorten only by about 1 month by the end of the 21st century. Also Fig. 7 confirms that the projected changes are
Figure 5.Modelled multi-GCM annual mean number of days with good bearing capacity in drained pine-dominated peatland forests during 1981–2010, 2021–2050 and 2070–2099 under the RCP4.5 and RCP8.5 scenarios (left column). The second and third column from the left show the modelled annual number of days with good bearing capacity during the winter with the most (the second column) and least (the third column) of such days within the 30-year periods based on the same multi-GCM mean. The last column shows the share of winters (%) with less than 30 modelled days of good bearing capacity based on the multi-GCM mean.
3.5 Relative importance of soil frost and snow cover in providing good wintertime bearing capacity
As the bearing season length is affected both by soil frost and snow cover, it is worth inspecting projected changes in these two variables separately. During a typical winter, snow depth
Figure 6.Range of modelled annual mean number of days with good bearing capacity in drained pine-dominated peatland forests during the periods 2021–2050 and 2070–2099 under the RCP4.5 and RCP8.5 scenarios among the GCMs and RCMs used in this study. The figures labelled with “Max” and “Min” show the highest and lowest modelled mean number of days with good bearing capacity among the used models for the GCMs and RCMs.
thick snow cover. In northern Finland, despite the thick snow cover, soil frost penetrates also in most areas typically deep enough to assure good bearing capacity. The spatial picture is projected to remain similar during the present century, but the cases with deep snow cover with less than 20 cm of soil frost seem to become slightly less abundant and almost non-existent in western Finland.
4 Discussion and conclusions 4.1 Evaluation of methodology
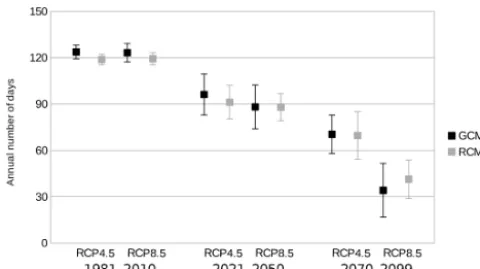
Figure 7. Annual mean number of days with good wintertime bearing capacity in drained pine-dominated peatland forests with multi-model standard deviations as averaged over the whole of Fin-land separately for the GCM and RCM ensembles during the peri-ods 1981–2010, 2021–2050 and 2070–2099 under the RCP4.5 and RCP8.5 scenarios.
model parameters were calibrated separately for three differ-ent soil types based on soil temperature observations. Typ-ically the model explained 90 %–99 % of the observed soil temperature variability. However, in most of the locations the model tended to overestimate the frost formation and soil temperature variations near the surface. Thus, the relative im-portance of snow cover in providing good wintertime bearing capacity is assumedly larger than that shown in Fig. 8.
Several assumptions were made in this study in order to simplify the calculations. Firstly, 20 cm depth of soil frost or 40 cm depth of snow cover may not be sufficient for good bearing capacity in all soil conditions. This is because the required soil frost depth is dependent on soil wetness, for ex-ample. In this study, we assumed constant water content in the soil. In dry soil conditions more than 50 cm of soil frost may be required to carry 10 t trucks (Shoop, 1995). However, in the present study the main focus was on carrying capacity of drained peatlands, which are the wettest forest environ-ments in Finland and are thus the most difficult for harvesting wood in summer. Besides the experiment-based estimate of Eeronheimo (1991), about 20 cm depth of soil frost has been found sufficient in ensuring the bearing capacity of soil for forest harvesters in Finnish conditions in model-based stud-ies, too (Suvinen et al., 2006; Kokkila, 2013).
The effect of forest density on soil frost formation was taken into account in our study in the modelling of snow depth. The snow model was first calibrated for open areas similarly as the soil temperature model. The effect of forest density on the snow depth was then evaluated based on litera-ture. As we did not have any snow depth measurements from forested sites, the modelled snow depths for forested areas were susceptible to biases. In general, snow depth decreases with increasing forest density. In our calculations this led to somewhat enhanced soil frost formation in denser forests. However, the differences between different forest types were
small. In reality, forest vegetation also acts as an insulator. Thus, open areas often have deeper soil frost than forests de-spite of having also deeper snowpack, but the results from different sites are contradictory (Soveri and Varjo, 1977). Ac-cording to Yli-Vakkuri (1960) soil frost penetrates particu-larly deep in dense spruce forests due to their large canopy cover, leading to shallow snow depths.
The climate change impact on wintertime bearing capac-ity of forest soils was taken into account by using climate model simulations. The climate models usually poorly sim-ulate soil frost penetration (e.g. Sinha and Cherkauer, 2010). Moreover, in northern Europe most of the GCMs and RCMs have a cold bias in winter (Cattiaux et al., 2013; Kotlarski et al., 2014). Thus we did not apply soil temperature or snow depth outputs directly from the models but first bias corrected and downscaled the climate model data onto a 0.1◦×0.2◦ (approximately 10 km×10 km) grid. Then, we used a rela-tively simple land surface model that could be calibrated for different soil types and implemented it with the available data to calculate the soil temperatures. By combining the soil and vegetation information with the soil frost calculations, the ex-pected changes in timber harvesting conditions can be eval-uated on a relatively small scale. However, in reality there is considerable variability in the soil frost conditions also within relatively similar soil and vegetation types. For ex-ample, the level of groundwater has a substantial impact on the soil frost depth (Soveri and Varjo, 1977). These kind of small-scale variations could not be taken into account in our approach, although the results are presented in a relatively high-resolution grid.
In all, there are several sources of uncertainty in the results of this study. The calibrated parameters describing different soil types are not exact, and in reality they are never exactly equal in different locations. Moreover, a model with almost equally good fit could be constructed with a very different set of parameters if the parameter values are adjusted con-veniently. This is because there is no single best model pa-rameter set, but many model state descriptions can generate equally good calibration outputs (Beven, 2006; Jungqvist et al., 2014). However, in many locations the model performed reasonably well even with the wrong soil type (Table S2), and as the stations used in calibrating the model are located in different parts of Finland, we assume that possible future changes in soil characteristics, including thermal conductiv-ity, do not crucially change the results.
pine-dominated peatland forests (Fig. 2g), it can be seen that the difference is mainly less than 15 days.
Considering the future projections, the two used climate model ensembles we used yielded rather similar results (Figs. 3 and 4), including increasing scatter among the model projections towards the end of the century (Fig. 6). The RCM ensemble using WFDEI forcing data set (Weedon et al., 2014) in bias correction had some differences in spa-tial small-scale features of the bearing season length pat-tern compared to the GCM ensemble that used the gridded Finnish climate data set in bias correction (Aalto et al., 2016). Most notably, the RCMs produced longer soil frost periods along the coast of Bothnian Bay. Nevertheless, both model ensembles reproduced the general large-scale pattern of bear-ing season length satisfactorily after the bias correction when compared to the results calculated from observation-based gridded climate data (Fig. 2).
4.2 Evaluations of main results and their implications on forestry
In accordance with previous studies (Venäläinen et al., 2001a, b; Kellomäki et al., 2010), our results suggest that climate warming will lead to shorter soil frost periods, re-ducing wintertime ground-bearing capacity. Also a reduc-tion in snow cover contributes to decreasing bearing capacity (Räisänen and Eklund, 2012). The projected decrease in the wintertime bearing season length was similar in the two cli-mate model ensembles studied. Most likely the bearing sea-son length in winter will decrease by about 1 month until the mid-21st century and by about 1.5–3 months until 2100. Nevertheless, there is considerable variation in the rate of the projected change among the individual climate model simu-lations.
In relative terms, the decrease in the wintertime bearing season length is most prominent in southern and western Finland. That is because in Lapland the season is typically 3 months longer than at the southern coast, and thus even the most extreme projections do not lead to a complete loss of the ground frost there. Similarly, abilities for wintertime log-ging on drained peatlands are expected to worsen more than on upland soil types. Based on our results it is evident that in the latter half of the century, on drained peatlands, logging cannot be expected to be conducted during frozen soil condi-tions in most parts of Finland. On the other hand, shortening the soil frost season leads to an earlier transition to summer conditions. This leads to a reduced soil moisture content in spring, and in summer, the soil moisture content is also pro-jected as being most likely to decrease (Ruosteenoja et al., 2018). Consequently, possibilities for summertime logging may improve.
Our results considering the climate change impact on the conditions of forest harvesting and logistics provide urgently needed support for the planning of wood harvesting and transportation in different time spans and regions. During the
last couple of decades, there has also been a trend towards heavier machinery in forest harvesting (Ala-Ilomäki et al., 2011), and the allowed maximum weight of timber trucks has increased (e.g. Malinen et al., 2014). The forest truck roads in Finland have been mainly constructed between 1960 and 1990, and many of them need major renovation before timber haulage can take place (Kaakkurivaara et al., 2005). Hence, maintaining sufficient bearing capacity in the forest truck road network is also important. Fortunately, there are several possibilities for improving mobility of forest machin-ery on poorly bearing conditions. For example, the carrying surface can be extending by using auxiliary wheels, width of individual wheels can be widened, tyre pressure can be re-duced or wider tracks can be used (Airavaara et al., 2008). One possibility is also using two-stage wood harvesting. In this method, the cutting is conducted when the soil is still unfrozen, but wood stacks are extracted later in winter when the soil is frozen (Heikkilä, 2007). Logging residues can be placed on the forwarding trails to improve the soil bearing capacity as is done in northern Scotland in peatland harvest-ing (Röser et al. 2011). This, however, reduces the volume of harvestable logging residues for energy use. Nevertheless, as there is a pressure to increase wood harvesting in drained peatlands in the future with simultaneous decrease in the ground-bearing capacity, there is a clear need to develop new cost-effective solutions for peatland harvesting, taking into account this anticipated decrease in ground-bearing capacity. 4.3 Conclusions
The results of this study indicate clearly that the soil frost period in Finland will become shorter as climate becomes warmer. Hence, it is evident that a larger share of logging needs to be carried out under unfrozen soil conditions. Partic-ularly this holds for drained peatlands, as the soil frost period there is shortest due to the insulating effect of peat. In south-ern and westsouth-ern Finland, drained peatlands might remain vir-tually frost-free in most of winters during the latter half of the current century. By 2050, the winters with only short frost periods will already become more common. The projected decrease in the bearing capacity, particularly in drained peat-lands, with simultaneously increasing demand for the wood utilization from peatlands, induces a clear need for the devel-opment of new sustainable and efficient logging practices. To foster the use of our results, the data showing the aver-age bearing season length in different combinations of soil and forest types during different study periods will be made publicly available.
should be analysed. These soil frost calculations can be also applied in studying climate change impacts on wind damage risks to forests, as soil frost makes trees more resistant for uprooting by anchoring them effectively to the ground (Pel-tola et al., 1999; Saad et al., 2017). With regard to harvesting logistics, it would be interesting to also study whether clear-cutting facilitates the transformation of some peatland stands marked for cutting in winter into stands marked for cutting in summer (Ala-Ilomäki et al. 2011; Sirén et al. 2013; Laitila et al., 2016). This is because, compared to thinning, clear-cutting allows greater freedom in the location of forwarding routes on-site as well as in organizing route schedules (Uusi-talo et al., 2015b).
Data availability. The climate model data used in this study can be downloaded from the CMIP5 and CORDEX archives, e.g. at https://esgf-node.ipsl.upmc.fr/projects/esgf-ipsl/ (last ac-cess: 14 March 2019). The observational gridded Finnish cli-mate data from 1961 onwards can be downloaded from the Pait-uli spatial data download service at http://avaa.tdata.fi/web/paitPait-uli/ metadata (last access: 14 March 2019). The soil temperature ob-servations from the stations listed in Table 1 are available on re-quest from the corresponding author. The spatial data describing the multi-GCM mean wintertime bearing season length in differ-ent combinations of soil and forest types over the studied peri-ods can be downloaded from the Paituli spatial data download service at https://avaa.tdata.fi/web/paituli/latauspalvelu?data_id=il_ soil_conditions_1981_txt_wgs (last access: 14 March 2019).
Supplement. The supplement related to this article is available online at: https://doi.org/10.5194/hess-23-1611-2019-supplement.
Author contributions. AV, AA and HG designed the study. MK made the downscaling and bias correction for the GCM data. IL made the calculations and wrote the paper together with AV, AA, JL, PA and HP.
Competing interests. The authors declare that they have no conflict of interest.
Acknowledgements. This research has been supported by the Strategic Research Council at the Academy of Finland through the FORBIO (Sustainable, climate-neutral, and resource-efficient forest-based bioeconomy) research project (grant numbers 293380 and 314224). We acknowledge the World Climate Research Pro-gramme’s Working Group on Regional Climate and Working Group on Coupled Modelling, the former being the coordinating body of the CORDEX project and the latter being responsible for CMIP. We are moreover grateful to all the modelling groups (listed in Ta-bles S3 and S4 in the Supplement of this paper) for producing and making their model outputs available. The model data used in this work were obtained from the Earth System Grid Federation
por-tal. For CMIP the US Department of Energy’s Program for Cli-mate Model Diagnosis and Intercomparison provided coordinating support and led development of software infrastructure in partner-ship with the Global Organization for Earth System Science Portals. Kimmo Ruosteenoja is acknowledged for downloading and prepro-cessing the GCM data. Olle Räty and Jouni Räisänen from Depart-ment of Physics, University of Helsinki, are acknowledged for de-veloping the bias correction software applied to the GCM data. An-nalea Lohila is acknowledged for providing soil temperature obser-vations for Lettosuo, Kaamanen and Lompolojänkkä stations.
Review statement. This paper was edited by Patricia Saco and re-viewed by Jørn Kristiansen and two anonymous referees.
References
Aalto, J., Pirinen, P., and Jylhä, K.: New gridded daily climatology of Finland: Permutation-based uncertainty estimates and tempo-ral trends in climate, J. Geophys. Res.-Atmos., 121, 3807–3823, https://doi.org/10.1002/2015JD024651, 2016.
Airavaara, H., Ala-Ilomäki, J., Högnäs, T., and Sirén, M.: Nykykalustolla turvemaiden puunkorjuuseen [Equipping con-ventional wheeled forwarders for peatland operations], Working Papers of the Finnish Forest Research Institute 80, 46 pp., 2008. Ala-Ilomäki, J., Högnäs, T., Lamminen, S., and Siren, M.: Equip-ping a conventional wheeled forwarder for peatland operations, International Journal of Forest Engineering, 22, 7–13, 2011. Anderson, E. A.: National Weather Service Forecast System-Snow
Accumulation and Ablation model, NOAA Technical Memoran-dum NWS HYDRO-17, U.S. Dept. of Commerce, Silver Spring, MD, 217 pp., 1973.
Asikainen, A., Mutanen, A., Kangas, A., Vehmasto, E., Verkasalo, E., Ylitalo, E., Hynynen, J., Viitanen, J., Backman, J., Laitila, J., Korhonen, K.T., Finér, L., Neuvonen, M., Kurttila, M., Pel-toniemi, M., Salminen, O., Peltonen-Sainio, P., Peltola, R., Korpinen, R., Kurppa, S., Räty, T., Saksa, T., Sievänen, T., Packalen, T., Saarinen, V.-M., Kankaanhuhta, V., and Kolttola, L.: Vihreä biotalous: 100-vuotiaan Suomen hyvinvoinnin ja kil-pailukyvyn perusta, edited by: Jaakkonen, A.-K. and Ylitalo, E., Luonnonvara- ja biotalouden tutkimus 59/2016, 25 pp., 2016. Aurela, M., Laurila, T., and Tuovinen, J.-P.: Seasonal CO2
bal-ances of a subarctic mire, J. Geophys. Res., 106, 1623–1637, https://doi.org/10.1029/2000JD900481, 2001.
Aurela, M., Lohila, A., Tuovinen, J.-P., Hatakka, J., Penttilä, T., and Laurila, T.: Carbon dioxide and energy flux measurements in four northern-boreal ecosystems at Pallas, Boreal Environ. Res., 20, 455–473, 2015.
Barrere, M., Domine, F., Decharme, B., Morin, S., Vionnet, V., and Lafaysse, M.: Evaluating the performance of coupled snow-soil models in SURFEXv8 to simulate the permafrost thermal regime at a high Arctic site, Geosci. Model Dev., 10, 3461–3479, https://doi.org/10.5194/gmd-10-3461-2017, 2017.
Beven, K.: A manifesto for the equifinality thesis, J. Hydrol., 320, 18–36, https://doi.org/10.1016/j.jhydrol.2005.07.007, 2006. Carroll, M. J., Dennis, P., Pearce-Higgins, J. W., and Thomas,
blocking in craneflies, Glob. Change Biol., 17, 2991–3001, https://doi.org/10.1111/j.1365-2486.2011.02416.x, 2011. Cattiaux, J., Douville, H., and Peings, Y.: European temperatures
in CMIP5: origins of present-day biases and future uncertainties, Clim. Dynam., 41, 2889–2907, https://doi.org/10.1007/s00382-013-1731-y, 2013.
Collins, M., Knutti, R., Arblaster, J., Dufresne, J.-L., Fichefet, T., Friedlingstein, P., Gao, X., Gutowski, W. J., Johns, T., Krin-ner, G., Shongwe, M., Tebaldi, C., Weaver, A. J., and WehKrin-ner, M.: Long-term climate change: projections, commitments and irreversibility, in: The Physical Science Basis, Contribution of Working Group I to the Fifth Assessment Report of the Inter-governmental Panel on Climate Change, edited by: Stocker, T. F., Qin, D., Plattner, G.-K., Tignot, M., Allen, S. K., Boschung, J., Nauels, A., Xia, Y., Bex, V., and Midgley, P. M., Cambridge University Press, Cambridge and New York, 1029–1136, 2013. Eeronheimo, O.: Suometsien puunkorjuu – Forest harvesting on
peatlands, Folia Forestalia 779, The Finnish Forest Research Institute, 29 pp., available at: https://core.ac.uk/download/pdf/ 52273561.pdf (last access: 12 December 2017), 1991.
Finnish Forest Research Institute: State of Finland’s Forests 2011, Based on the Criteria and Indicators of Sustainable Forest Man-agement, Ministry of Agriculture and Forestry and Finnish Forest Research Institute 5a/2011, Suomen Graafiset Palvelut Oy, Kuo-pio, 96 pp., 2011.
Finnish Forest Research Institute: Finnish Statistical Yearbook of Forestry, Tammerprint, Tampere, 428 pp., 2014.
Flato, G., Marotzke, J., Abiodun, B., Braconnot, P., Chou, S. C., Collins, W., Cox, P., Driouech, F., Emori, S., Eyring, V., Forest, C., Gleckler, P., Guilyardi, E., Jakob, C., Kattsov, V., Reason, C., and Rummukainen, M.: Evaluation of Climate Models, in: Cli-mate Change 2013: The Physical Science Basis. Contribution of Working Group I to the Fifth Assessment Report of the Inter-governmental Panel on Climate Change, edited by: Stocker, T. F., Qin, D., Plattner, G.-K., Tignor, M., Allen, S. K., Boschung, J., Nauels A., Xia, Y., Bex, V., and Midgley, P. M., Cambridge University Press, Cambridge and New York, 741–866, 2013. Gregow, H., Peltola, H., Laapas, M., Saku, S., and Venäläinen, A.:
Combined occurrence of wind, snow loading and soil frost with implications for risks to forestry in Finland under the current and changing climatic conditions, Silva Fenn., 45, 35–54, 2011. Gurevich, M. I.: Dependence of the snow melting rate on air
temperature, Meteorology and Hydrology (Meteorologiya i gidrologiya), No. 3, 44–48, 1950.
Hankimo, J.: Sateen olomuodon prediktoreista, Finnish Meteoro-logical Institute, tutkimusseloste 57, 1976.
Hedstrom, N. R. and Pomeroy, J. W.: Measurements and mod-elling of snow interception in the boreal forest, Hydrol. Process., 12, 1611–1625, https://doi.org/10.1002/(SICI)1099-1085(199808/09)12:10/11<1611::AID-HYP684>3.0.CO;2-4, 1998.
Heikinheimo, M. and Fougstedt, B.: Statistics of soil temperature in Finland 1971–1990, Meteorological Publications, Finnish Mete-orological Institute, Painatuskeskus Oy, Helsinki, 75 pp., 1992. Heikkilä, J.: Turvemaiden puun kasvatus ja korjuu – nykytila ja
ke-hittämistarpeet [Silviculture and harvesting of peatland forests – the current state and future development needs], Working Papers of the Finnish Forest Research Institute 43, 29 pp., 2007.
Hiitiö, M.: Lumen sulannasta ja sen aiheuttaman valunnan arvioin-nista, M.Sc. thesis, Department of Civil Engineering, Helsinki University of Technology, Finland, 96 pp., 1982.
Houle, D., Bouffard, A., Duchesne, L., Logan, T., and Harvey, R.: Projections of future soil temperature and water content for three southern Quebec forested sites, J. Climate, 25, 7690–7701, https://doi.org/10.1175/JCLI-D-11-00440.1, 2012.
Jacob, D., Petersen, J., Eggert, B., Alias, A., Christensen, O. B., Bouwer, L. M., Braun, A., Colette, A., Déqué M., Georgievski, G., Georgopoulou, E., Gobiet, A., Menut, L, Nikulin, G., Haensler, A, Hempelmann, N., Jones, C., Keuler, K., Ko-vats, S., Kröner, N., Kotlarski, S., Kriegsmann, A., Martin, E., van Meijgaard, E., Moseley, C., Pfeifer, S., Preuschmann, S., Radermacher, C., Radtke, K., Rechid, D., Rounsevell, M., Samuelsson, P., Somot, S., Soussana, J.-F., Teichmann, C., Valentini, R., Vautard, R., Weber, B., and Yiou, P.: EURO-CORDEX: new high-resolution climate change projections for European impact research, Reg. Environ. Change, 14, 563–578, https://doi.org/10.1007/s10113-013-0499-2, 2014.
Jansson, P.-E.: CoupModel: model use, calibration, and validation, T. ASABE, 55, 1335–1344, 2012.
Jungqvist, G., Oni, S. K., Teutschbein, C., and
Fut-ter, M. N.: Effect of climate change on soil tempera-ture in Swedish boreal forests, PLoS ONE, 9, e93957, https://doi.org/10.1371/journal.pone.0093957, 2014.
Kaakkurivaara, T., Vuorimies, N., Kolisoja, P., and Uusi-talo, J.: Applicability of portable tools in assessing the bearing capacity of forest roads, Silva Fenn., 49, 1239, https://doi.org/10.14214/sf.1239, 2015.
Kellomäki, S., Maajärvi, M., Strandman, H., Kilpeläinen, A., and Peltola, H.: Model computations on the climate change effects on snow cover, soil moisture and soil frost in the boreal conditions over Finland, Silva Fenn., 44, 213–233, https://doi.org/10.14214/sf.455, 2010.
Kokkila, M.: Ilmastonmuutoksen vaikutus puunkorjuun talvikau-den korjuuoloihin hienojakoisella kivennäismaalla, Metsätieteen aikakauskirja, 1/2013, 5–18, https://doi.org/10.14214/ma.6028, 2013.
Komulainen, V.-M., Tuittila, E.-S., Vasander, H., and Laine, J.: Restoration of drained peatlands in southern Finland: initial ef-fects on vegetation change and CO2 balance, J. Appl. Ecol.,
36, 634–648, https://doi.org/10.1046/j.1365-2664.1999.00430.x, 1999.
Korkiakoski, M., Tuovinen, J.-P., Aurela, M., Koskinen, M., Minkkinen, K., Ojanen, P., Penttilä, T., Rainne, J., Laurila, T., and Lohila, A.: Methane exchange at the peatland forest floor – automatic chamber system exposes the dynamics of small fluxes, Biogeosciences, 14, 1947–1967, https://doi.org/10.5194/bg-14-1947-2017, 2017.
Kotlarski, S., Keuler, K., Christensen, O. B., Colette, A., Déqué, M., Gobiet, A., Goergen, K., Jacob, D., Lüthi, D., van Meij-gaard, E., Nikulin, G., Schär, C., Teichmann, C., Vautard, R., Warrach-Sagi, K., and Wulfmeyer, V.: Regional climate model-ing on European scales: a joint standard evaluation of the EURO-CORDEX RCM ensemble, Geosci. Model Dev., 7, 1297–1333, https://doi.org/10.5194/gmd-7-1297-2014, 2014.
Kozlowski, T.: Some factors affecting
water systems, Cold Reg. Sci. Technol., 59, 25–33, https://doi.org/10.1016/j.coldregions.2009.05.009, 2009. Knutti, R. and Sedláˇcek, J.: Robustness and uncertainties in the new
CMIP5 climate model projections, Nat. Clim. Change, 3, 369– 373, https://doi.org/10.1038/nclimate1716, 2013.
Laitila, J., Väätäinen, K., and Asikainen, A.: Comparison of two harvesting methods for complete tree removal on tree stands on drained peatlands, Suo, 64, 77–95, 2013.
Laitila, J., Niemistö, P., and Väätäinen, K.: Productivity of multi-tree cutting in thinnings and clear cuttings of young downy birch (Betula pubescens) dominated stands in the integrated harvesting of pulpwood and energy wood, Balt. For., 22, 116–131, 2016. Lundberg, A. and Koivusalo, H.: Estimating winter evaporation in
boreal forests with operational snow course data, Hydrol. Pro-cess., 17, 1479–1493, https://doi.org/10.1002/hyp.1179, 2003. Malinen, J., Nousiainen, V., Palojärvi, K., and Palander, T.:
Prospects and challenges of timber trucking in a changing oper-ational environment in Finland, Croat. J. For. Eng., 35, 91–100, 2014.
Maraun, D. and Widmann, M.: Statistical downscaling and bias cor-rection for climate research, Cambridge University Press, Cam-bridge, 347 pp., 2018.
Ministry of Employment and the Economy, Ministry of Agri-culture and Forestry, and Ministry of the Environment: Sustainable growth from bioeconomy – The Finnish bioe-conomy strategy, Edita Prime Ltd, 17 pp., available at: http://biotalous.fi/wp-content/uploads/2014/08/The_Finnish_ Bioeconomy_Strategy_110620141.pdf (last access: 12 Decem-ber 2017), 2014.
Natural Resources Institute Finland: Forest industries’ wood consumption 2016, available at: http://stat.luke.fi/en/ forest-industries-wood-consumption-2016_en, last access: 12 December 2017a.
Natural Resources Institute Finland: Finnish roundwood har-vests to a record level in 2016, available at: https://www.luke. fi/en/news/finnish-roundwood-harvests-record-level-2016/, last access: 12 December 2017b.
Nugent, C., Kanali, C., Owende, P. M. O., Nieuwenhuis, M., and Ward, S.: Characteristic site disturbance due to har-vesting and extraction machinery traffic on sensitive for-est sites with peat soils, Forfor-est Ecol. Manag., 180, 85–98, https://doi.org/10.1016/S0378-1127(02)00628-X, 2003. Oni, S. K., Mieres, F., Futter, M. N., and Laudon, H.: Soil
temper-ature responses to climate change along a gradient of upland-riparian transect in boreal forest, Climatic Change, 143, 27–41, https://doi.org/10.1007/s10584-017-1977-1, 2017.
Park, S. K., Sungmin, O., and Cassardo, C.: Soil temper-ature response in Korea to a changing climate using a land surface model, Asia-Pac. J. Atmos. Sci., 53, 457–470, https://doi.org/10.1007/s13143-017-0048-x, 2017.
Pärn, J., Verhoeven, J. T. A., Butterbach-Bahl, K., Dise, N. B., Ullah, S., Aasa, A., Egorov, S., Espenberg, M., Järvenoja, J., Jauhiainen, J., Kasak, K., Klemedtsson, L., Kull, A., Laggoun-Défarge, F., Lapshina, E. D., Lohila, A., Lõhmus, K., Mad-dison, M., Mitsch, W. J., Müller, C., Niinemets, Ü, Osborne, B., Pae, T., Salm, J.-O., Sgouridis, F., Sohar, K., Soosaar, K., Storey, K., Teemusk, A., Tenywa, M. M., Tournebize, J., Truu, J., Veber, G., Villa, J. A., Zaw, S. S., and Mander, Ü.: Nitrogen-rich organic soils under warm well-drained conditions
are global nitrous oxide emission hotspots, Nat. Commun., 9, 1135, https://doi.org/10.1038/s41467-018-03540-1, 2018. Peltola, H., Kellomäki, S., and Väisänen, H.: Model
com-putations of the impact of climatic change on the
windthrow risk of trees, Climatic Change, 41, 17–36, https://doi.org/10.1023/A:1005399822319, 1999.
Pitkänen, A., Turunen, J., Tahvanainen, T., and Simola, H.: Carbon storage change in a partially forestry-drained boreal mire deter-mined through peat column inventories, Boreal Environ. Res., 18, 223–234, 2013.
Pohjankukka, J., Riihimäki, H., Nevalainen, P., Pahikkala, T., Ala-Ilomäki, J., Hyvönen, E., Varjo, J., and Heikko-nen, J.: Predictability of boreal forest soil bearing ca-pacity by machine learning, J. Terramechanics, 68, 1–8, https://doi.org/10.1016/j.jterra.2016.09.001, 2016.
Räisänen, J. and Eklund, J.: 21st century changes in snow cli-mate in Northern Europé: a high-resolution view from ENSEM-BLES regional climate models, Climate Dynamics, 38, 2575– 2591, https://doi.org/10.1007/s00382-011-1076-3, 2012. Räisänen, J. and Räty, O.: Projections of daily mean temperature
variability in the future: cross-validation tests with ENSEM-BLES regional climate models, Clim. Dynam., 41, 1553–1568, https://doi.org/10.1007/s00382-012-1515-9, 2013.
Räisänen, J. and Ylhäisi, J. S.: CO2-induced climate change in
northern Europe: CMIP2 versus CMIP3 versus CMIP5, Clim. Dynam., 45, 1877–1897, https://doi.org/10.1007/s00382-014-2440-x, 2015.
Rankinen, K., Karvonen, T., and Butterfield, D.: A simple model for predicting soil temperature in snow-covered and seasonally frozen soil: model description and testing, Hydrol. Earth Syst. Sci., 8, 706–716, https://doi.org/10.5194/hess-8-706-2004, 2004. Rasmus, S., Gustafsson, D., Koivusalo, H., Laurén, A., Grelle, A., Kauppinen, O.-K., Lagnvall, O., Lindroth, A., Rasmus, K., Svensson, M., and Weslien, P.: Estimation of winter leaf area in-dex and sky view fraction for snow modelling in boreal conifer-ous forests: consequences on snow mass and energy balance, Hy-drol. Process., 27, 2876–2891, https://doi.org/10.1002/hyp.9432, 2013.
Räty, O., Räisänen, J., and Ylhäisi J. S.: Evaluation of delta change and bias correction methods for future daily precipitation: intermodel cross-validation using ENSEMBLES simulations, Clim. Dynam., 42, 2287–2303, https://doi.org/10.1007/s00382-014-2130-8, 2014.
Röser, D., Sikanen, L., Asikainen, A., Parikka, H., and Väätäinen, K.: Productivity and cost of mechanized energy wood harvest-ing in Northern Scotland, Biomass Bioenerg., 35, 4570–4580, https://doi.org/10.1016/j.biombioe.2011.06.028, 2011.
Ruosteenoja, K., Jylhä, K., and Kämäräinen, M.: Climate projec-tions for Finland under the RCP forcing scenarios, Geophysica, 51, 17–50, 2016.
Ruosteenoja, K., Markkanen, T., Venäläinen, A., Räisänen, P., and Peltola, H.: Seasonal soil moisture and drought occurrence in Europe in CMIP5 projections for the 21st century, Clim. Dy-nam., 50, 1177–1192, https://doi.org/10.1007/s00382-017-3671-4, 2018.