© 2017, IRJET | Impact Factor value: 5.181 | ISO 9001:2008 Certified Journal
| Page 1330
Dynamic Stand-Alone Gas Detection System
R. G. Dhokte
1, Dr. M. H. Nerkar
21
R. G. Dhokte, Electronics and Telecommunication Engineering (Digital System), Government College of
Engineering, Jalgaon, Maharashtra, India
2Professor
, Electronics and Telecommunication Engineering (Digital System), Government College of Engineering,
Jalgaon, Maharashtra, India
---***---Abstract -
Growing industries are need of 21st century,but these growing industries are also responsible for growing pollution. Not only the industries but also need of transportation is also increasing which leads to increase in concentration of carbon dioxide, carbon monoxide, etc. gases. So, detection and concentration monitoring (mapping) of these gases is very important issue. Currently various static systems are located at key locations. But these systems are not flexible for operating at different applications. Therefore this dynamic system is designed. This system is designed by using microcontroller as well as GUI for flexible operation of hardware. This system uses chemo resistive (MOS) sensors for detection of carbon monoxide, LPG and methane gas. For controlling of system AVR ATmega 16 is used. Also GSM module is used for communication purpose. This system is cost effective; also the results of sensors are approximately equal to the standard system. Preheat time required for the result is 16-22 minutes.
Key Words: CO, LPG, parts per million (ppm), MOS,
Graphics User Interface (GUI), Pollution under Control (PUC), Methane, Permissible Exposure Limit (PEL).
1. INTRODUCTION
In the past few years, earth’s atmosphere is becoming more and more unstable due to growing pollution. Major cause of pollution is industries and increase in number of transportation vehicles. Result of this is depletion of ozone layer and adverse effects on human health. Thus monitoring of these gases is very necessary.
Earth’s atmosphere contains various gases in specific concentration which keeps earth’s atmosphere as per required by human body. Major components of earth’s atmosphere in homosphere (80-100 km from surface) are nitrogen, oxygen and water vapors. Amongst these gases some are permanent gases while some are variable. Table-1 gives percentage concentration of permanent gases and table-2 gives percentage concentration of variable gases. It is also given in ppm i.e. parts per million.
Table -1: Percentage Compositions of Permanent Gases Gas Symbol % Concentration
Nitrogen N2 78.084
Oxygen O2 20.946
Argon Ar 0.9340
Neon Ne 0.001818
Helium He 0.000524
Hydrogen H2 0.000055
Xenon Xe 0.000009
Table -2: Concentration of Gases in % and ppm
Gas Symb
ol entration % Conc- Concentration in ppm Water Vapor H2O 0 to 4 - Carbon Dioxide CO2 0.038 380
Methane CH4 0.00017 1.7
Nitrous Oxide N2O 0.00003 0.3
Ozone O3 0.000004 0.04
Particles (dust
etc.) - 0.000001 0.01-0.15
Chlorofluorocarb
on CFCs 0.00000002 0.0002
Carbon
Monoxide CO - 35
Sulfur Dioxide SO2 - 5
The causes of pollution may be different such as man-made and natural. Man-made causes includes industrial pollution, pollution from vehicles, pollution from plastic wests, etc., while natural pollution occurs due to forest fire, volcano etc. Measurement of gases is important aspect according to pollution control as well as toxic gas detection and their source localization. In industries or at gas station there is possibility of toxic or flammable gas leakage. Most of the gases are colorless and odorless which makes them difficult to detect by human sensory organs. Thesegases can cause fatal accidents such as fire, suffocation, etc. Therefore detection and GSL of these gases is very important.
© 2017, IRJET | Impact Factor value: 5.181 | ISO 9001:2008 Certified Journal
| Page 1331
Health (NIOSH) give the maximum permissible exposurelimit for different toxic and combustible gases. PEL for toxic gases is given by ppm whereas for combustible gases it is given by Lower Explosive Limit (LEL) and Upper Explosive Limit (UEL). According to OSHA and NIOSH, in the industrial area with 8 hours of work shift maximum PEL for CO2 is 5000 ppm, for CO it is 35 ppm, for CH4 there is no specific PEL, for LPG it is 1000ppm. The combustible gases such as LPG and Methane are also represented in terms of LEL and UEL. For LPG, LEL is 1.8% and UEL is 8.4% whereas for methane, LEL is 5% and UEL is 15%. Concentration of these gases beyond given PEL for more than 8 hour work shift can cause adverse effects to human health.
1.1 Objectives of the System
Degradation of ozone layer is biggest issue of 21st century. Pollution is increasing continuously resulting in different types of diseases. Some toxic and combustible gases are hard to identify by humans as they are colorless or odorless. The leakage of these gases can cause a catastrophe. To avoid such catastrophe this system is designed.Gas detection is the recommended system and it is required by the law for people’s safety. It is needed for pollution control by concentration measurement as well as for detection of combustible and toxic gases which are difficult to detect by human. The system is required for safety of life and property which must provide early warning of hazardous condition with safety measure such as notification, ventilation, water sprinkler, etc. by GSL and gas detection mapping.
Main purpose behind designing this system is to detect different toxic and combustible gases and monitoring their concentrations. The standard gas concentrations are given by health organizations NIOSH and OSHA. If the gas concentration reaches to the threshold (which is designed keeping standard gas concentrations in mind) proper measures should be taken. Here comes second objective of the system that is disaster management. This system should take readings at various locations near the site where the gas was detected. Among these readings the reading with higher gas concentration will be the gas leak source. After determining leak source we can communicate to monitoring person about gas leak.
2. LITERATURE SURVEY
Gas detection is very important issue and various methods are available from manual inspection using trained dogs to advanced satellite using multiple spectral imaging. Gas detection methods are divided into two categories as optical and non-optical methods of gas detection. Optical gas detection methods are again classified as active and passive optical techniques. Active gas detection technique consists of laser or any optical
source whereas in passive optical gas detection no source is used. This will reduce the cost required for the source but the detectors used must require higher sensitivity for proper detection of gases which also increases the cost of the system.
The two major types of passive optical systems used for monitoring leaks from natural gas pipelines are thermal imaging [12][3] and multi-wavelength imaging [1][12]. Thermal imaging detects natural gas leaks from pipelines due to the differences in temperature between the natural gas and the immediate surroundings. This method can be used from moving vehicles, helicopters or portable systems and is able to cover several miles or hundreds of miles of pipeline per day. Usually, expensive thermal imagers are required to pick up the small temperature differential between the leaking natural gas and the surroundings. In addition, thermal imaging will not be effective if the temperature of the natural gas is not different from that of the surroundings.
Multi-wavelength or hyper spectral imaging can be accomplished either in absorption mode or in emission mode. For obtaining gas concentrations utilizing multi-wavelength emission, the gas temperatures have to be much higher than the surrounding air. Multiwavelength emission measurements have been typically used in the past to obtain single point concentrations in hot combustion products [12]. Multi-wavelength absorption imaging utilizes the absorption of background radiation at multiple wavelengths to directly image the gas concentration, even in the absence of temperature gradients between the gas and the surrounding air. This technique has been used to monitor natural gas leaks in industrial settings very successfully. However, multi-wavelength or hyper spectral imaging typically utilizes very sensitive and expensive imagers. The biggest advantage of passive techniques is that they can be used from ground, vehicle, aircraft, and even satellite platforms. Therefore, long sections of pipelines can be monitored for natural gas leaks relatively easily. In addition, multi-wavelength passive systems are relatively immune to false alarms, and can be utilized for remote monitoring without being constantly watched over. The similar hyper spectral imaging system was designed where cost effective multispectral scanner was designed for natural gas detection. The system reliably detected small leaks at 30- 50 feet height but source localization was little challenging which required moving vehicle mounted scanner.
© 2017, IRJET | Impact Factor value: 5.181 | ISO 9001:2008 Certified Journal
| Page 1332
length is monitored using a detector. According to theLidar gas detection system pulse of laser radiation of wavelength λ0 is transmitted by Lidar trans-receiver, laser waves are scattered according to Raman scattering principle. Due to special properties of the gases the wavelength of transmitted signal gets shifted to λi and according to the deviation of wavelength gas is detected.
Diode laser absorption uses the same technology with the crucial difference being that diode lasers are used instead of the more expensive pulsed lasers. If only a single wavelength is used, the system can be prone to false alarms since the laser can be absorbed equally well by dust particles.
Broad band absorption systems utilize low cost lamps as the source, significantly reducing the cost of the active system. In addition, monitoring is achieved at multiple wavelengths so that the system is less prone to false alarms. For evanescent sensing, an optical fiber is buried along with the pipe. When natural gas escapes, the local changes in pressure or concentration causes a change in the transmission character of the optical fiber. This change in the transmission characteristics is monitored using lasers and optical detectors.
Millimeter wave radar systems obtain a radar signature above the natural gas pipelines. Since methane is much lighter than air, the density difference provides a signature that can be used as an indicator of a potential leak. Backscatter imaging utilizes a carbon-dioxide laser to illuminate the area above the pipeline. The natural gas scatters the laser light very strongly. This scattered signature is imaged using an infrared imager or an infrared detector in conjunction with a scanner.
All the active systems described above use a source and obtain either transmitted or scattered images to determine the presence of methane. These systems are can be mounted on moving vehicles, aircraft or on location. The advantages of these systems include capability to monitor over an extended range and ability to monitor leaks even in the absence of temperature differences between the gas and the surroundings. In addition, these techniques have high spatial resolution and sensitivity under specific conditions. The two disadvantages of the method are the high cost of implementation and the high incidences of false alarms. Typically, these systems also require a skilled operator, and cannot be used for unsupervised monitoring due to the safety issues involved with the operation of powerful lasers.
The primary non-optical methods include acoustic monitoring [12]; gas sampling [9], soil monitoring [12], flow monitoring [11][10][12], and software based dynamic modeling [9][12]. Acoustic monitoring
techniques typically utilize acoustic emission sensors to detect leaks based on changes in the background noise pattern. The advantages of the system include detection of the location of the leaks as well as non-interference with the operation of the pipelines. In addition, they are easily ported to various sizes of pipes. However, a large number of acoustic sensors are required to monitor an extended range of pipelines. The technology is also unable to detect small leaks that do not produce acoustic emissions at levels substantially higher than the background noise. Attempts to detect small leaks can result in many false alarms.
Gas sampling methods typically use a flame ionization detector housed in a hand held or vehicle mounted probe to detect methane or ethane. The primary advantage of gas sampling methods is that they are very sensitive to very small concentrations of gases. Therefore, even very tiny leaks can be detected using gas sampling methods. The technique is also immune to false alarms. The disadvantages of the technology are that detection is very slow and limited to the local area from which the gas is drawn into the probe for analysis. Therefore the cost of monitoring long pipelines using gas sampling methods is very high.
In soil monitoring methods, the pipeline is first inoculated with a small amount of tracer chemical. This tracer chemical will seep out of the pipe in the event of a leak. This is detected by dragging an instrument along the surface above the pipeline. The advantages of the method include very low false alarms, and high sensitivity. However, the method is very expensive for monitoring since trace chemicals have to be continuously added to the natural gas. In addition, it cannot be used for detecting leaks from pipelines that are exposed.
Flow monitoring devices measure the rate of change of pressure or the mass flow at different sections of the pipeline. If the rate of change of pressure or the mass flow at two locations in the pipe differs significantly, it could indicate a potential leak. The major advantages of the system include the low cost of the system as well as non-interference with the operation of the pipeline. The two disadvantages of the system include the inability to pinpoint the leak location, and the high rate of false alarms.
© 2017, IRJET | Impact Factor value: 5.181 | ISO 9001:2008 Certified Journal
| Page 1333
Chemical sensor based method (chemo resistive,electrochemical sensors) are most suited method as it can be implemented on drones very easily as payload weight is relatively less and sensitivity is good which gives proper gas detection with source localization. Mcgonigle provided an early demonstration using a small remotely piloted helicopter flying into gas plumes from an active volcano to measure the chemical concentrations of CO2 and SO2 as a part of geophysical research [6]. Neumann demonstrated the first rotary wing micro-UAV-based GDM and GSL. The experiments were conducted in small outdoor environment. The challenges in the system were reported to be gas distribution changes due to drone rotors [5]. Malaver illustrated the efforts in greenhouse gas monitoring through the use of a fixed wing, solar-powered UAV system with an integrated MOX sensor to measure CO2 and CH4 [5]. Johnson presented chemical vapor detection sensor with two types of micro-UAV i.e. fixed wing and rotary wing. The tests were performed in an enclosed environment but the work did not progress to the real time system [12][2].
3. SYSTEM DESIGN
The proposed system mainly uses MOS sensors which will detect different gases such as CO, methane, and LPG. These sensors detect the concentration of the gases, if the gas concentration is above PEL, the predefined user will be notified with the help of GSM system with the location of gas leakage. Here LCD display is also attached which will display the real time gas concentration reading. Sensing is mainly done by the microcontroller. Here GUI is also designed using Matlab which will help in monitoring the gas concentrations continuously with the locations. Also GUI provides greater flexibility to the system such as by using different conversion formulas single sensor can be used to measure concentrations of different gases. Also by using GUI we can contact to the different disaster management services such as fire brigade, ambulance, etc. where we can inform them about the gas leakage, its concentration with location of gas leak source.
3.1 Block Diagram
[image:4.595.308.553.102.304.2]Hardware of this system consists of AVR ATMega16 Microcontroller, MQ2 sensor, MQ7 sensor, MQ4 sensor, GSM module, Display unit, Power supply and RS232 to USB converter IC. Figure 1 shows block diagram of system.
Fig -1: Block Diagram of Proposed System
Block diagram consists of 3 MOS sensors, a microcontroller, a LCD display, power supply unit and RS323 to USB converter for easy interface between hardware and GUI which is designed using matlab tool in PC. Similarly GSM module is also connected to PC through RS232 to USB converter. GSM module requires supply of 12V which can be supplied from system power supply as we are using 12V, 1A adapter for supply voltage with IC7805. Working principle of sensors is explained in preceding sections with configuration of GUI and hardware units.
Interfacing of GSM module with PC is shown in figure 2 which is shown below. Here RS232 to USB converter IC is used as an interface between GSM module and PC i.e. GUI. TXD, RXD and GND are pins used for the interface between GSM module and RS232.
Fig -2: Interfacing of GSM Module with PC
3.2 Mathematical Model
Development of system mainly incudes mathematical aspects and they must be taken into consideration. Such aspects include power requirements for each unit, ADC conversion and digital to ppm conversion of readings.
Power Supply To PC
(RS232-USB)
LCD MQ2
Sensor
MQ7 Sensor
MQ4 Sensor
AVR ATMega16 Controller
PC with
GUI GSM
Module
GND TXD
RXD
TXD
[image:4.595.312.565.564.627.2]© 2017, IRJET | Impact Factor value: 5.181 | ISO 9001:2008 Certified Journal
| Page 1334
Power CalculationThis system comprises of AVR ATMega16 microcontroller, three MOS sensors namely MQ2, MQ4 and MQ7 with LCD display. All these units require battery powered supply and hence constant DC power supply is used to provide required power.
a) AVR ATMega16 microcontroller requires supply of 5V DC with current requirement of 1.1mA. Thus Power consumption for microcontroller is 5.5mW.
b) MQ2 sensor requires 900mW of power with supply voltage of 5V DC.
c) MQ7 sensor requires 350mW of power with supply voltage of 5V DC.
d) MQ4 sensor requires 950mW of power with supply voltage of 5V DC.
e) LCD works on 3-5V DC with current requirement of 1.2-1.5mA.
By considering above requirements of each unit DC power supply of 5V, 1A is designed using 12V, 1A adapter and IC7805.
ADC Conversion
Sensor module gives the output in the form of voltage. This analog voltage is converted to digital using 10-bit ADC which is on chip ADC in AVR ATMega16 microcontroller. As ADC is 10 bit the values are as follows
Total digital values =210 = 1024
The values therefore changes from 0 to 1023. The maximum output voltage from sensor is 5V. So the conversion of voltage change to digital value is shown below
5V/1024= 0.004883V=4.883mV
For each 4.883mV of change in sensor voltage will result in change of digital value by 1.
Digital to ppm Conversion
Conversion of digital reading to ppm is very important task, because by using different sensitivity curve, different gas can be measured for same digital reading. According to datasheet of MQ2 sensor, sensitivity curve for LPG is different from sensitivity curve of smoke or CO. By using first point of curve, last point of curve and slope of curve digital readings are converted to ppm. The formula for this conversion is as shown below
Ppm reading =
3.3 Development of System
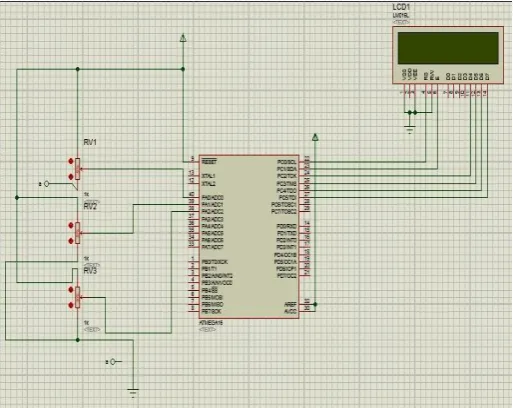
[image:5.595.309.566.298.502.2]Development of system mainly includes the hardware development and software development of the system. Hardware development gives the circuit diagram of the hardware which is designed for gas detection of CO, LPG and methane. Circuit diagram is simulated in proteus software. Figure 3 shows circuit diagram of hardware showing interfacing with sensors and LCD. As shown in circuit diagram three sensors are connected to pin number 38, 39 and 40. MQ7 sensor is connected to pin number 39 which ADC1 pin. MQ2 sensor is connected to pin number 40 i.e. ADC0 pin and MQ4 sensor is connected to pin number 38. LCD is connected to port C from PC0 to PC5 i.e. pin number 22-27. Here supply voltage of 5V DC is applied to circuit.
Fig -3: Circuit Simulation of the System
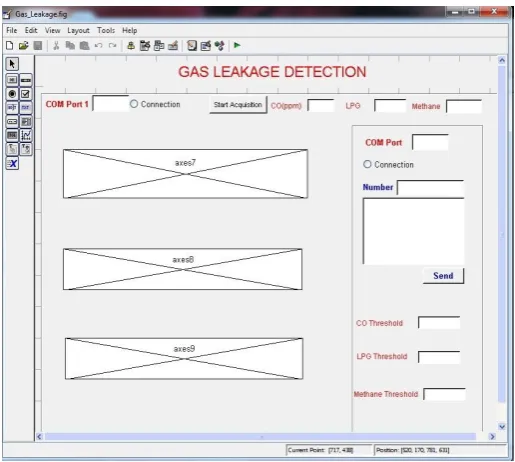
Software development of system mainly includes the design of GUI. Here GUI is designed using matlab. Figure 4 shows the designed GUI for dynamic stand-alone gas detection system. GUI components used in this gas detection system is push button, radio button, static box, edit text and axes. In figure ‘Start Acquisition’ and ‘Send’ are two push buttons used. Start acquisition is used to enable acquisition of sensor data which is converted into ppm and displayed in edit text box. These edit text box will display numeric values of gas concentration in ppm. Thus the name of corresponding gas whose value is to be displayed in edit text box is given in static box. These static boxes are named as ‘CO (ppm)’, ‘LPG’, and ‘Methane’. The values acquired from sensor are also represented in graphical form by using axes.
© 2017, IRJET | Impact Factor value: 5.181 | ISO 9001:2008 Certified Journal
| Page 1335
hardware and GSM module. The other COM port [image:6.595.35.293.237.468.2]connection is used for GSM module interface. If the connection is successful ‘open’ message will be displayed in static box. Static text with name ‘Number’ is used to represent edit text box which is used to represent phone number of the person to whom we want to send a message. Message string to be sent is a standard string “CO level at location 1 is x” where x represents the real time value of CO gas concentration. String will be different for different gases. If we want to change the message string the provision is given by edit text box.
Fig -4: Development of GUI in Matlab
Lastly the three edit text boxes named as ‘CO Threshold’, ‘LPG Threshold’ and ‘Methane Threshold’ are programmed to take threshold values of gas concentration from user. If the real time gas concentration is greater than threshold defined the message will be send to the person whose phone number is entered in GUI.
3.4 Algorithm for System
This section gives algorithm of system which explains step by step working of system. Sensor used here is MOS type sensor which converts gas concentration into equivalent resistance through chemical reaction. The equivalent resistance is converted to voltage using sensor module. These sensor readings are acquired by microcontroller. As the voltage is analog quantity it has to be converted to digital for further processing. ATMega16 microcontroller has inbuilt 10-bit ADC which converts analog voltage readings to digital 10-bit data. Display those readings on LCD. The LCD used here is 16x2 line LCD which displays the digital readings with sensor name.
Graphical user interface which is abbreviated as GUI is popular these days for flexible system design. The GUI designed here converts the digital data from hardware i.e. digital readings from sensor to ppm (parts per million). It also displays real time readings of sensor (in ppm) in numeric form as well as graphical form. It also interfaces with GSM module which can be used for communication. GUI compares calculated ppm readings with the thresholds standardized by NIOSH and OSHA. If the sensor readings are greater than respective threshold then message will be sent to the monitoring unit. The phone number of the monitoring unit can be easily changed to another person or to the hospital in case of catastrophe. The message will display gas name and its concentration.
GUI is designed using matlab as a tool. The microcontroller interfaced with sensor and LCD is a hardware which needs to be interfaced with PC (i.e. configuration with GUI). Same goes for GSM module which needs to be interfaced with PC in order to be configured with GUI. This interface is achieved using RS232 to USH converter IC.
4. PERFORMANCE ANALYSIS
This section gives practical performance characteristics of sensors and shows results of system at various parameter changes such as time, distance from source, and readings at different concentration of gases etc. MQ7 readings were calibrated with PUC checking device at RTO office, Jalgaon. Experimentation of methane gas concentration measurement has been done only in clean air. Whereas for LPG gas experimentation was done using household gas stove. The results of system interface with GSM through GUI are also shown in this section.
4.1 Output of System
© 2017, IRJET | Impact Factor value: 5.181 | ISO 9001:2008 Certified Journal
| Page 1336
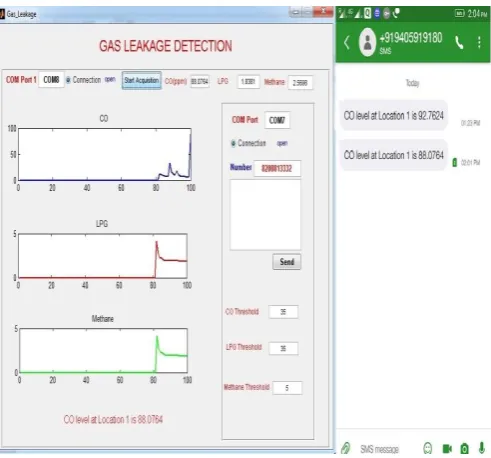
Fig -5: System Hardware Showing Digital Readings on LCDGUI was designed by using Matlab as a tool. Configuration of hardware and GSM module with GUI is important task. USB port is used for communication between hardware and PC. So the appropriate COM port is selected for interfacing system hardware and GSM module. As soon the connection is open between hardware and PC or GSM module and PC we can start to acquire the sensor readings. Here the digital readings are converted to the ppm value and displayed on GUI. Figure 6 shows the ppm readings acquired from hardware.
Fig -6: Data Acquisition from Sensors using GUI Figure 6 shows GUI acquiring readings of the sensor. Here threshold can be given by user for different applications. Also text message sent to the number is shown beside. We can change the phone number as shown in figure. String showing CO level at the bottom of the axis
is shown only when the concentration of gas is greater than threshold.
4.2 Performance of System
[image:7.595.309.561.317.610.2]Dynamic stand-alone gas detection system uses three sensors which are MQ2, MQ7 and MQ4. Performance of these sensors is analyzed in this section. As we know that heating time is the important parameter for analyzing sensor performance. As heating time increases the readings of the sensors gets more and more stable. Table 3 shows the readings of MQ7 sensor at different heating time in clean air and air with CO gas leak. Chart 1 shows the line graph showing performance characteristics of MQ7sensor with respect to heating time. These readings were taken on smoke generated from matchstick.
Table -3: MQ7 Sensor Readings at Different Heating Time Heating Time
(minutes)
Sensor Readings (in ppm) In Clean Air Air with CO
0 1102 9695
4 116.19 1593
8 53.38 664.13
12 28.92 338.63
16 19.98 4023
Chart -1: Performance Characteristics of MQ7 Sensor w.r.t. Heating Time
Please note that in above graph, variation in readings in air with CO leak is due to gas concentration changes. Here equation of line (line showing readings of MQ7 sensor in clean air at different heating time) is calculated by using linear and exponential trade line. These equations are given below
Equation of line using exponential trade line:
[image:7.595.38.284.433.662.2]© 2017, IRJET | Impact Factor value: 5.181 | ISO 9001:2008 Certified Journal
| Page 1337
Equation of line using linear trade line:y = -56.283x + 714.36
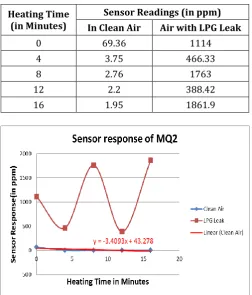
[image:8.595.308.557.120.407.2]Table 4 shows the readings of MQ2 sensor at different heating time in clean air and air with LPG gas leak. Chart 2 shows the line graph showing performance characteristics of MQ2 sensor with respect to heating time. This experimentation was done on household LPG gas stove.
Table -4: MQ2 Sensor Readings at Different Heating Time Heating Time
(in Minutes)
Sensor Readings (in ppm) In Clean Air Air with LPG Leak
0 69.36 1114
4 3.75 466.33
8 2.76 1763
12 2.2 388.42
16 1.95 1861.9
Chart -2: Performance Characteristics of MQ2 Sensor w.r.t. Heating Time
Please note that in above graph, variation in readings in air with LPG leak is due to gas concentration changes. Here equation of line (line showing readings of MQ2 sensor in clean air at different heating time) is calculated by using linear trade line only as it covers almost all points in straight line.
The equation for linear trade line:
y = -3.4093x + 43.278
Table 5 shows the readings of MQ4 sensor at different heating time in clean air. Chart 3 shows the line graph showing performance characteristics of MQ4 sensor with respect to heating time.
Table -5: MQ4 Sensor Readings at Different Heating Time Heating Time (in
Minutes) Sensor Readings in Clean Air
0 4.49
4 1.6
8 1.71
12 2.01
16 2.28
Chart -3: MQ4 Sensor Readings at Different Heating Time We can see in all three graphs that sensor readings are getting more and more stable as heating time of heater coil is increasing. Variation in readings which is unacceptable is because of change in gas concentration. Here equation of line (line showing readings of MQ7 sensor in clean air at different heating time) is calculated by using linear and polynomial trade line. These equations are given below
Equation of line using polynomial trade line:
y = 0.0291x2 - 0.5653x + 4.15
Equation of line using linear trade line:
y = -0.1003x + 3.22
[image:8.595.36.289.236.532.2]© 2017, IRJET | Impact Factor value: 5.181 | ISO 9001:2008 Certified Journal
| Page 1338
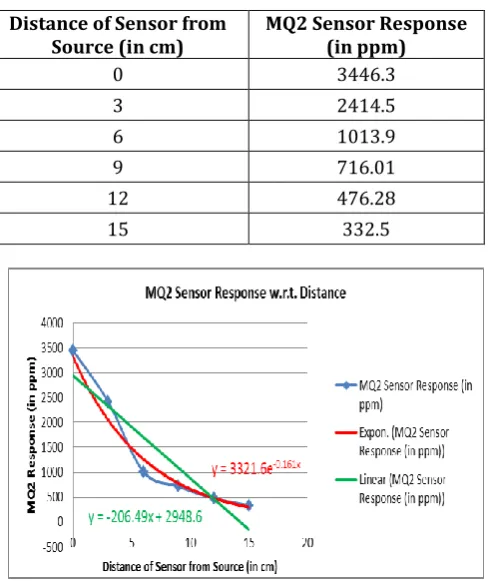
characteristics of MQ2 sensor with respect to distance of [image:9.595.32.278.169.460.2]sensor from gas leak source.
Table -6: MQ2 Sensor Readings at Different Distance from Leak Source
Chart -4: Performance Characteristics of MQ2 Sensor w.r.t. Distance of Sensor from Gas Leak Source
We can see in the figure above that slope of the power line is high near origin, i.e. we can easily localize a gas source as the gas concentration near a gas source varies drastically as we go away from source. But at far distances from source the variations in gas concentration is low. Thus by using this experimentation we can easily localize a gas leak source. Equation of power line showing MQ2 gas sensor response is calculated using exponential and linear trade line. These equations are shown below
Equation of line using exponential trade line:
y = 3321.6e-0.161x
Equation of line using linear trade line:
y = -206.49x + 2948.6
Gas concentration is another parameter for analyzing sensor performance. Some experimentation was done on MQ7 sensor using different vehicles as gas leak source. As we can tell each vehicle has different concentration of CO leak, thus this parameter was also analyzed to check performance of gas sensor. Table 7 gives
readings of MQ7 sensors with different gas leak source. Chart 5 shows bar graph showing performance characteristics of MQ7 sensor w.r.t different gas leak sources.
Table -7: MQ7 Sensor Readings with Different Gas Leak Sources
Type of Vehicle MQ7 SENSOR Readings (in ppm)
Pleasure Bike 24841
Wego Bike 17787
Auto 79484
Hero Honda Bike 34285
Chart -5: Performance Characteristics of MQ7 Sensor w.r.t. Different Gas Leak Sources
4.3 Calibration of Sensor
MQ7 sensor was calibrated with the PUC checking machine at RTO, Jalgaon. Readings on PUC machine are shown in table 8 and are compared with the readings taken by MQ7 sensor. Source of gas leak used here was a “Pleasure Scooter”.
Table -8: Comparison of Readings of the System with Standard Readings
Readings Taken by PUC
Machine Readings Taken by MQ7 Sensor 2.096% (nearly after 2
min of heating time) 2.484% (After 16 min of heating time) 1.690% (nearly after 2.30
min of heating time) 1.778% (After 22 min of heating time) Distance of Sensor from
Source (in cm) MQ2 Sensor Response (in ppm)
0 3446.3
3 2414.5
6 1013.9
9 716.01
12 476.28
[image:9.595.307.559.187.496.2]© 2017, IRJET | Impact Factor value: 5.181 | ISO 9001:2008 Certified Journal
| Page 1339
By observing these readings we can say that afterheating a sensor for some time we can get the readings which are approximately equal to standard readings. The cost of PUC machine is 3.5 lakh rupees approx. whereas the cost of this system is 1800-2000 rupees approx. Thus this gas detection system is advantageous as it gives nearly accurate readings in low cost, the only short come is heating time is greater for the system.
5. CONCLUSIONS
Objectives of the system explained in first chapter says the system should detect toxic gases and if the gas concentration is greater than defined threshold then monitoring system will be alerted with the message showing gas concentration and location of gas leak. According to the results shown in fourth chapter we can say that the objective is achieved except for automatic gas localization. Localizing the source of gas leak automatically without any manual processing and sending information regarding exact location of gas leak is important task and which is partially achieved.
Dynamic stand-alone gas detection system is a system which very low in cost with approximately equal results compared to standard CO gas detection system used at PUC centers except for the short come of heating time, which is greater for the system than standard system. According to results shown in table 3, 4, 5 and 6 we can conclude that as heating time increases readings becomes more and more stable. Also, the heating time of 30 minutes is more than sufficient for approximately accurate readings. Preheat time of 48 hours which is a short come of this system can be compromised if we compromise a bit in accuracy. Results shown in table 6 concludes that gas localization is very likely possible if we reduce a distance between source and sensing device.
This system likely have some short comes but the system is cost effective as well as gives approximately equal results as compared to standard system. Thus, this system can be used instead of PUC machines, for household LPG gas leak or methane gas leak, for measuring CO concentrations in industries where workers works in 8 hours shift, etc. applications.
Gas localization using GPS system is totally ineffective process as range of GPS localization is very poor. Thus a system with camera mounted on it can be effective for exact location identification of gas leak source. The major scope of work is achieving higher accuracy with minimum preheat time. If we succeed to achieve higher accuracy in less preheat time then that would be a revolution for low cost gas detection systems.
REFERENCES
[1] Bennett, C. L., Carter M. R., and Fields, D. J., “Hyperspectral imaging in the infrared using LIFTIRS,”
Optical Remote Sensing for Environmental and Process
Monitoring, Volume 55, pp. 267-275. 1995.
[2] Brandy J. Johnson, Anthony P. Malanoski, Jeffrey S. Erickson, Ray Liu, Allison R. Remenapp, David A. Stenger, and Martin H. Moore, “Reflectance-based detection for long term environmental monitoring”,
Heliyon, Volume 3, Issue 6, June 2017.
[3] Cosofret B. R., Marinelli W. J., Ustun T., Gittins C. M., Boies M. T., Hinds M. F., Rossi D. C., Coxe R., Chang S., “Passive infrared imaging sensor for standoff
detection of methane leaks”, SPIE Optics East Chemical and Biological Standoff Detection II, October 2004.
[4] Iseki T., Tai H., and Kimura K., “A portable remote methane sensor using a tunable diode laser,” Meas. Sci. Technol., Volume 11, pp. 594-602, 2000.
[5] Maurizio Rossi, David Brunelli, “Autonomous Gas Detection and Mapping with UAVs”, IEEE Transactions
on Instrumentation And Measurement, Volume 65,
Issue 4, April 2016.
[6] McGonigle A.J.S., Aiuppa A., Giudice G., Tamburello G., Hodson A.J., Gurrieri S. “Unmanned aerial vehicle measurements of volcanic carbon dioxide fluxes”.
Geophys. Res. Lett., 2008.
[7] Minato, A., Joarder, M. A., Ozawa, S., Kadoya, M., and Sugimoto, N., “Development of a Lidar System for Measuring Methane Using a Gas Correlation Method,”
Jpn. J. Appl. Phys., Volume 38, pp. 6130-6132, 1999.
[8] Oyedeko K. F. K.. Balogun H.A, “Modeling and Simulation of a Leak Detection for Oil and Gas Pipelines via Transient Model: A Case Study of the Niger Delta”, Journal of Energy Technologies and Policy, Volume 5, Issue 1, 2015.
[9] Sperl J. L., “System pinpoints leaks on Point Arguello offshore line”, Oil and Gas Journal, September 1991.
[10] Turner N. C., “Hardware and software techniques for pipeline integrity and leak detection monitoring”,
Proceedings of Offshore Europe 91, 1991.
[11] Cristina Gomez, David R. Green, “Small scale airborne platforms for oil and gas pipeline monitoring and mapping”, University of Aberdeen.
© 2017, IRJET | Impact Factor value: 5.181 | ISO 9001:2008 Certified Journal
| Page 1340
[13] Figaro Engineering INC, Google,www.figaro.co.jp/en/technicalinfo/principle/mos-type.html
[14] Henwei Electronics Co., LTD, Pololu, www.pololu.com/file/0J309/MQ2.pdf
[15] Henwei Electronics Co., LTD, Pololu, www.pololu.com/file/0J313/MQ7.pdf
[16] Henwei Electronics Co., LTD, Sparkfun Electronics, www.sparkfun.com/datasheets/sensors/Biometric/M Q-7.pdf.
[17] Neru5.Ru,neru5.ru/index.php?route=product/produ ctandproduct_id=650
[18] Wikipedia,
en.wikipedia.org/wiki/Atmosphere_of_Earth
[19] Zhengzhou Winsen Electronics Technology Co., LTD, Sparkfun Electronics,