© 2018, IRJET | Impact Factor value: 6.171 | ISO 9001:2008 Certified Journal | Page 1385
Analysis of Electric Power Consumption using Smart Meter Data
Sachin George
1, Vanessa Almond
2, Elizabeth James
3, Shivom Vishwakarma
4, M. Kiruthika
51,2,3,4 BE Student, Dept. of Computer Engineering, Fr. C. R. I. T, Vashi, Maharashtra, India 5Associate Professor, Dept. of Computer Engineering, Fr. C. R. I. T, Vashi, Maharashtra, India
---***---Abstract - This paper proposes an analytical model that describes power consumption using energy profiles, which gives power consumption of a consumer over a period of time, to perform quantitative analysis using smart meters that automatically acquire context information. Smart meters are devices capable of measuring customer’s energy consumption which further can provide economic, social and environmental benefits to multiple stakeholders. The model proposed consists of two types of analysis performed on smart meter data. The first module is the consumer oriented meter data analytical model which provides feedback to end users on reducing electricity consumption and saving money. Consumers with similar type and number of appliances are grouped together because power consumption patterns highly depend on the type of appliance. Analysis is performed in each of the groups to identify and target customer segments for specific energy efficiency recommendations. The second module is the predictive model which uses historical consumption data of the consumer in order to understand the behavioral patterns of the consumption of electricity. These trends can be used to predict energy consumption as well as identify irregularities and outliers.
Key Words: power consumption, smart meter data analysis, electricity consumption trend, analytical model and predictive model
1. INTRODUCTION
One of the things that many people do throughout the world without taking care about is consuming electricity. Due to fast economic development affected by industrialization and globalization, energy consumption has been steadily increasing over the last years. As a result, the consumption of electrical energy sometimes becomes a problem because the generating capacity cannot match the demand. Therefore, energy consumption management is a very significant problem to tackle the losses resulting from increasing consumption patterns. This paper proposes an analytical model that describes power consumption using the activity information from quantitative analysis using smart meters that automatically acquire context information.
Smart meter is an electronic device that records consumption of electric energy in intervals of an hour or less and communicates that information back to the utility for monitoring and billing. Smart meters enable a two way communication between the meter and the central system.
The benefits of smart meters include:
More accurate bills
Better understanding of usage Innovative energy tariffs
Meter data analytics refers to the analysis of data emitted by electric smart meters that record the consumption of electric energy. This data is analyzed for:
Making efficient energy buying decisions based on the usage patterns,
Presenting efficient energy consumption by comparing users.
Prediction of energy usage based on past consumption trends.
Energy theft detection
Comparing and correcting meter service provider performance, and detect and reduce unbilled energy Making more efficient maintenance decisions that
help avoid catastrophic grid failures
This paper proposes a consumer oriented meter data analytical model which aids in reducing electricity consumption and saving money by providing suitable feedback to consumers. The model consists of two broad areas of research in smart meter data analytics: (1) Finding similar consumers based on the extracted features and providing efficient usage trends. (2) Analyzing user’s historical consumption trends to predict energy usage.
Power consumption patterns of different types of consumers vary based on the type of appliances they possess. However, the power consumption pattern of even the same type of consumers might be different. The similar consumers are clustered. Power consumption profiling, which gives the power consumption of a consumer over a period of time, is performed on each cluster. The consumption profiles of the users within the same cluster are used to perform further analysis and suggest efficient energy usage.
© 2018, IRJET | Impact Factor value: 6.171 | ISO 9001:2008 Certified Journal | Page 1386 The rest of this paper is organized as follows: Section 2
provides a background and surveys some of related studies of power consumption profiling. Section 3 introduces the proposed clustering and predictive model and provides a complexity analysis of the proposed model. Section 4 explains the design. Section 5 describes the implementation and the results are presented in Section 6. Section 7 concludes and discusses future work.
2. BACKGROUND
2.1 Current research trends in smart meter data analytics
Alexander Lavin [1] et al. analyses time-series energy data from smart meters to identify patterns and trends in energy usage profiles of commercial and industrial customers and group similar profiles. The paper states that the energy usage profile which is a time‐series data can reveal a lot about energy efficiency. Clustering was used to measure the similarity between these energy profiles, and group them based on the energy usage. The goal in clustering time‐series data is to organize the data into homogeneous groups, maximizing the similarity and dissimilarity within and between groups, respectively. Individual participants in energy efficiency programs can be made aware of positives and negatives of their energy use in comparison to those most similar to themselves in energy use.
[2] Damminda Alahakoon et al. presented a comprehensive survey of smart electricity meters and their utilization focusing on key aspects of metering process, the different stakeholder interests and technologies used to satisfy stakeholder interests. Furthermore it highlighted the challenges as well as opportunities arising due to the advent of big data and the increasing popularity of the cloud environments. The key components of Smart meter intelligence included 1) Data capture and storage 2) Technology and Algorithms 3) Stakeholder applications.
In [3], Aylin Jarrah Nezhad et al. presented SmartD, a dashboard for smart meter data visualization and analysis. SmartD has been built to be:
(i) seamlessly integrated with existing data collection infrastructures,
(ii) intuitive to use, and (iii)Easy to extend.
To visualize and analyze smart meter data, SmartD supported context selection (e.g., summer, winter, weekend, or weekdays), different temporal aggregations (e.g., hourly, daily, or weekly), and consumer selection (either individual or clusters of consumers). Although this functionality was commonly found in other energy dashboard or time series visualization, SmartD’s additional and novel contributions were:
(i) estimating the typical hourly load profiles based on demographic information, and
(ii) Determining the attributes of the demographic profile that are relevant to consumer’s energy consumption behavior for a given context.
This functionality was used to predict the typical load profile of new consumers or to understand the energy consumption behavior of different consumers.
[4] Ning Lu et.al presents a thorough analysis of 15-minute residential meter data sets to identify possible value propositions of smart meter measurements. Meter measurements of 50 houses were used to derive a few key data signatures for several target applications such as identifying demand response potentials, detecting abnormal load behaviors, and fault diagnosis. Results showed that for different applications, the communication needs from meters to control centers, data storage capabilities, and the complexity of data processing intelligence varies significantly. Therefore, it is important to build a dynamic data signature database and optimize the distribution of data processing capability between local devices and control centers to avoid communication congestion and to identify problems early. This paper also demonstrates that high resolution smart meter data can make distribution power grids more economical, reliable, and resilient.
2.2 Existing Approaches
The data mining work of Košmelj and Batagelj et al. [5] was commercial energy consumption over time. Their clustering problem deals with multivariate data and equal length intervals. The data they analyzed was annual consumptions of energy sources, not short intervals of energy usage. They employed a relocation clustering procedure, modified to incorporate the time dimension with time‐dependent linear weights. The distance measure was Euclidean. To identify good clusters they used the generalized Ward evaluation criterion function.
J.J. van Wijk and E.R. van Selowetal et al. [6] used the root mean square distance function in an agglomerative hierarchical approach in clustering time‐series data for two cases also at daily intervals: power demand and employee attendance. They also clustered energy use in daily intervals. The results were delivered with calendar‐based visualization, which supported plans to cluster by calendar day. They considered combining time scales, i.e. weekdays of February, but rejected the idea anticipating difficulty in extracting information from so many scenarios. The main intent of their study was to find dates in a year with similar patterns for a single individual account.
© 2018, IRJET | Impact Factor value: 6.171 | ISO 9001:2008 Certified Journal | Page 1387 energy use, for weekdays, and for summer months June and
July. The data was further filtered to exclude households of “high entropy,” or chaotic distribution of energy profiles from day-to‐day. Average load shapes were clustered via k‐means with a Euclidean distance measure, partitioning into six distinct energy profiles by their main peaks: afternoon, evening, dual, daytime, night, and morning.
3. PROPOSED SYSTEM
The proposed system groups similar users and analyses electricity consumption of various consumers within their respective groups and generate consumption profiles to determine their usage patterns. Based on the pattern generated, conclusions regarding the consumer’s consumption, any irregularities, outliers can be suggested to the consumer. This also can help in decision making regarding policies. The two models proposed in the system is the consumer oriented meter data analytical model and the predictive model based on historical data. The techniques proposed for the analytical model includes clustering. Among the existing clustering approaches, it is proposed to follow partitional clustering approach such as k-means to cluster consumers based on the type of appliances. Consumers with similar type and number of appliances are grouped together and analysis is performed in their respective group in order to suggest recommendations for efficient consumption. The system also uses historical consumption data of the consumer in order to understand the behavioral patterns in the consumption of electricity. These trends can be used to predict consumption as well as identify irregularities and outliers.
4. DESIGN
One of the tasks in data mining that can be used to determine the electricity usage profile is clustering. The data of electricity usage is processed by grouping (clustering) consumers on the basis of type and number of appliances they possess using the K-Means algorithm. The purpose of clustering consumers is to perform analysis on individual clusters. The intention of this grouping is to analyze the patterns of similarity in electricity consumption among consumers possessing similar appliances. This information helps in generating reliable and veracious results. For example, consider two consumers A and B. Consumer A has higher number of appliances that consume more electricity whereas consumer B has fewer appliances that consume less electricity. From the above information we can infer that the overall consumption of A is greater than B. Consumption pattern of A is completely different from that of B and comparing the two will give results depicting B as efficient and recommending A to reduce his/her consumption to the standards set by B thereby suggesting irrelevant recommendations. Hence, they cannot be compared with each other. Therefore, the consumers need to be grouped based on the type and number of appliances they possess.
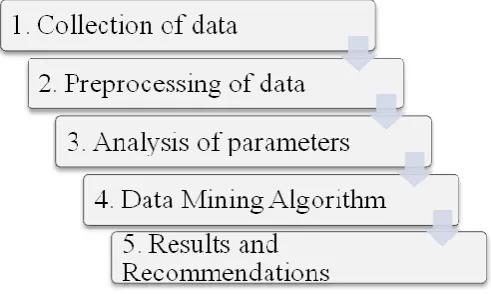
Further analysis should be performed among the consumers in the cluster to set appropriate standards for comparison. The proposed system can be divided into 5 stages which are depicted in Fig -1. The initial 2 stages include the collection and preprocessing of data in order to make it suitable for analyzing. The third stage is to study and understand the parameters of the data. The processing which involves clustering of consumers and analyzing their consumption patterns is done in the fourth stage. The final stage involves the displaying of output, suggesting recommendations and notifying the consumer of high consumption.
Fig -1: Flowgraph of consumer oriented meter data analytical model
4.1 Collection of Data
Smart meters use a secure national communication network (called the DCC) to automatically and wirelessly send the actual energy usage to the supplier. This means households reading will no longer be an estimated or false value. The meter sends the readings to supplier end in intervals of 15 minutes to 1 hour. These readings are then collected by the system to perform further processing. Units consumed are the number of kW (kilo watts) consumed in 15 minutes duration.
4.2 Preprocessing of data
Data preprocessing is a data mining technique that involves transforming raw data into an understandable format. Power consumption data maybe incomplete, inconsistent, and/or lacking in certain behaviors or trends, and is likely to contain many errors. Data preprocessing is a proven method of resolving such issues. Data preprocessing prepares raw data for further processing. The missing values are filled in with the average of that column or NULL.
4.3 Analysis of Parameters
[image:3.595.312.558.223.370.2]© 2018, IRJET | Impact Factor value: 6.171 | ISO 9001:2008 Certified Journal | Page 1388 consumption has to be understood to set the parameters for
clustering.
4.4 Data Mining Algorithm
K-Means Clustering
K-Means algorithm is one of the methods of partitional clustering that can group the data into several clusters based on the similarity of the data. This mechanism enables consumers which have similar characteristics i.e. type and number of appliances to be grouped into one cluster and consumers that have different characteristics are grouped in other clusters. To determine the cluster label of any consumer, the distance between the consumer data and each cluster centre is calculated. There are several ways that can be used to perform distance calculations, such as Euclidean distance, Manhattan distance, and Chebichey distance. The K-Means method aims to minimize the sum of squared distances between all points and the cluster centre. This procedure consists of the following steps.
Step 1: Select k out of the given n consumer appliance patterns as the initial cluster centers. Assign each of the remaining n−k patterns to one of the k clusters; a pattern is assigned to its closest centre/cluster.
Step 2: Compute the cluster centers based on the current assignment of patterns.
Step 3: Assign each of the n patterns to its closest centre/cluster.
Step 4: If there is no change in the assignment of patterns to clusters during two successive iterations, then stop; else, go to Step 2.
K-Means algorithm is chosen because it is simple, easy to implement, widely used in many fields, and the most important is that it has the ability to cluster big dataset. In addition, K-Means algorithm is not affected to the order of objects. The advantage of using the K-Means algorithm in the proposed system is that the consumer appliance data set is numerical and the size of dataset is quite big.
KNN Classification
In KNN classification an object is classified by a majority vote of its neighbors, with the object being assigned to the class most common among its k nearest neighbors. A new consumer is classified into one of the above defined clusters in the following way.
Step 1: Calculate the distance between the new consumer (nc) and each of the classified consumer appliance patterns.
Step 3: Select k nearest patterns to nc.
Step 4: Classify nc in the class to which maximum number of the k nearest patterns belong.
In this way a new consumer can be accommodated into one of the already existing class
4.5 Results and Recommendations
Within each cluster the following are computed on a monthly basis.
1) Most efficient consumption value. 2) Average consumption.
The above computations are used to compare individual user consumptions to suggest recommendations and are depicted graphically for a better understanding.
The outputs are displayed on a web and mobile based application which will also notify the consumer if his/her consumption is above the average consumption of the group he/she belongs to.
5. IMPLEMENTATION
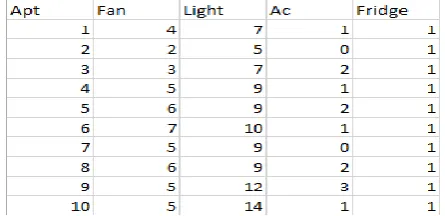
The dataset contains consumer appliance data of 200 consumers as shown in Fig -2
Fig -2: Consumer Appliance Dataset
The number of rows is 200 for the 200 apartments and the number of columns is 4 for the apartment ID, number of fans, light, AC and fridge. Some appliances are omitted because the scope of the experiment cannot cover all living activities in modern society that are related to electric appliances. The average 1 hour consumption as shown in TABLE -1 of each of the appliance was multiplied to the number of appliances and then summed up to get 1 hour consumption of all the appliances (1HCA) in kW/h. We performed K-means clustering on 1HCA to obtain clusters as shown in Fig -3.
Table -1: Average Consumption (kW/h) of Appliances
Appliances
Fan Light AC Fridge
[image:4.595.322.545.414.522.2]© 2018, IRJET | Impact Factor value: 6.171 | ISO 9001:2008 Certified Journal | Page 1389 Fig -3: Clustering of 1HCA
[image:5.595.312.555.131.357.2]The apartments were also clustered on each appliances’ kW/h consumption. Fig-4 shows the clustering based on each of the appliance (CBEA).
Fig -4: Clustering based on each appliance
1HCA and CBEA were compared and it was identified that the overall change in the consumption values majorly depended on the consumption of AC. Hence, clustering of consumers was performed based on the number of AC each consumer possessed.
6. RESULTS
The clusters computed were used for performing further analysis. Within each cluster the most efficient consumption and the average consumption on a monthly basis was computed. The dataset containing the monthly electricity consumption of each apartment for one year as shown in Fig-5 was used for the computation.
Fig -5: Monthly Consumption Dataset
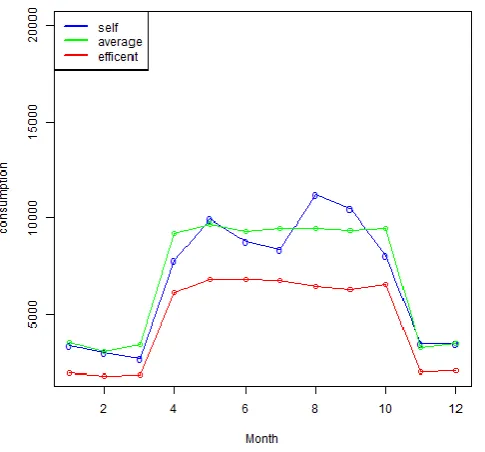
Chart -1, Chart -2 and Chart -3 shows the results of these computations of 3 apartments. The graphs obtained can be used to give recommendations to the consumers.
.
Chart -1: Analysis of Apartment No. 1
Chart -1 portrays the consumption profile of Apartment No. 1. It clearly shows that in the month of August (8) the consumer’s consumption was above the average consumption of the cluster and hence he/she would be recommended to reduce his/her energy usage. However, in the month of March (3), the consumer was very close to the efficient consumption. The consumer’s energy usage for most of the year was close to the average consumption.
[image:5.595.43.285.276.413.2] [image:5.595.316.552.501.722.2]© 2018, IRJET | Impact Factor value: 6.171 | ISO 9001:2008 Certified Journal | Page 1390 Chart -2 demonstrates the consumption profile of Apartment
No. 2. Throughout the year, the consumer’s consumption is between the average and most efficient electricity usage. In the month of January (1), the consumption was the most efficient consumption among the rest of the apartments in the cluster.
Chart -3: Analysis of Apartment No. 3
Chart -3 depict the consumption profile of Apartment No. 3. It can be clearly observed that the consumption is above average for most of the year. The consumer is recommended to reduce his/her consumption.
7. CONCLUSION
Smart meters produce considerable volumes of data, presenting the opportunity for utilities to enhance end-customer service, lower the cost and improve energy efficiency; and for consumers to reduce the bills and save energy. Smart meter data analytics is a process that involves data ingestion, pre-processing, analysis and visualization. The system aims to analyze the data, understand the energy profiles and the appliances that affect the consumption profiles to group similar consumers together. Consumers with similar type and number of appliances are grouped together and analysis is performed in their respective group in order to suggest recommendations for efficient consumption. The analysis aids in setting standards for efficient energy consumption and identifies the outliers and irregularities in the consumption patterns. The system also uses historical consumption data of the consumer to understand the behavioral patterns in the consumption of electricity to predict user consumption. The work towards the second module is under progress.
REFERENCES
[1] Alexander Lavin, Diego Klabjan “Clustering Time-Series
Energy Data from Smart Meters” Energy Efficiency, July 2015, Volume 8, Issue 4, pp 681-689
[2] Damminda Alahakoon and Xinghuo YuSmart “Electricity
Meter Data Intelligence for Future Energy Systems: A Survey”. IEEE Transactions on Industrial Informatics ( Volume: 12, Issue: 1, Feb. 2016 )
[3] Aylin Jarrah Nezhad, Tri Kurniawan Wijaya, Matteo
Vasirani, and Karl Aberer “SmartD: Smart Meter Data Analytics Dashboard”.
[4] Ning Lu, Pengwei Du, Xinxin Guo, and Frank L. Greitzer
“Smart Meter Data Analysis”. Transmission and Distribution Conference and Exposition (T&D), 2012 IEEE PES
[5] K. Košmelj, V. Batagelj, “Cross‐ sectional approach for
clustering time varying data.” J. Classification 7 (1990): pp. 99–109.
[6] J.J. van Wijk, E.R. van Selow, “Cluster and calendar based
visualization of time‐ series data.” Proceedings of IEEE Symposium on Information Visualization, San Francisco, CA, October 25–26, 1999
[7] Smith, Brian A., Arthur Wong, and Ram Rajagopal. "A