PERFORMANCE OF CITRUS AURANTIUM PEEL ADSORBENT IN
TEXTILE WASTEWATER TREATMENT
Lakshmi Narayanan S
1, Dr.K.M.Gopalakrishnan
21PG Scholar, Erode Sengunthar Engineering College, Perundurai, Tamilnadu, India
2Head of the Department, Department of Civil Engineering, Erode Sengunthar Engineering College, Perundurai, Tamilnadu, India
---***---Abstract -
Huge quantity of dyes and pigments produced annually throughout the world are used by textile industries. Effluents from these industries are colour dye wastewater and the disposal of these wastes into freshwater bodies causes damage to environment. Among the treatment technologies, the adsorption is an attractive and viable treatment. The use of low cost, recycled waste and eco-friendly absorbent has been investigated as an alternative process for replacement of currently expensive process for removing dyes from wastewater. In this study, Citrus Aurantium was used to remove dyes from textile wastewater in a adsorption techniques. Citrus Aurantium is an excellent at low cost adsorbent and may have significant potential as a colour removal from textile wastewater.Batch adsorption experiments were carried out to optimize the influencing parameters such as contact time, adsorbent dosage, pH. The removal efficiency for dye was found to be 82.1% with a dosage of 2g/l at a pH 3 for a contact time of 120min for Citrus Aurantium. Similarly the removal efficiency for dye was found to be 74.4% with a dosage of 2g/l at a pH 7 for a contact time of 120min for Citrus Aurantium and removal efficiency for dye was found to be 71.7% with a dosage of 2g/l at a pH 12 for a contact time of 120min for Citrus Aurantium respectively. In phase 2, the banana peel and pomegranate peel adsorbent will used. Compare the most effective adsorbent to remove dye from textile wastewater.
Key Words: Citrus Aurantium, textile wastewater, pH, contact time, efficiency
1.INTRODUCTION
GENERAL
About 15% of the total world production of dyes is lost during the dyeing process and is released as liquid effluents. Colour removal from such wastes is one of the most difficult requirements, faced by the textile finishing, dye manufacturing, pulp and paper industries. Among the various types of dye, various vat dyes, including green olive b, are used in dye and wool dyeing. Vat dyes are also used in cotton, wool, silk, nylon and other fibre making industries and it is a organic pollutants. The effluent containing dyes are highly coloured, resulting in major environmental problems. Biological methods such as biodegradation have been proposed. However, due to the low biodegradability of dyes, conventional biological waste water treatment processes are not very efficient for the treatment of dyeing wastes.
However, adsorption is one of the promising methods to remove the dye pollutants from aqueous system completely. It was, therefore, thought worthwhile to develop highly efficient and effective adsorbents for the removal of dye from the textile effluents.
Wastewater generation
The textile industry is one of the most polluting of industries, not only in terms of the volume of effluent generated, but also in terms of its characteristics as well. A chain of operations involving receiving and storing of raw materials, processing of raw materials into finished products, packed and storing of finished products, and a group of other operations will produce wastewater.
In the textile industry, some amount of wastewater gets produced during starting, equilibrating, dyeing and rinsing of the processing units. However, a majority of wastewater gets produced during cleaning operations, especially between products changes when different types of products are produced in a specific production unit and clean-up operations. Dyeing processing effluents are generated in an intermittent way and the flow rates of these effluents change significantly. The quantity of the product content in the dyeing wastewater at a given time changes with the application of another technological cycle in the processing line.
Applications of adsorption
Good performance result Low land area required Design is simple
Minimum value sludge produced Efficiency is high
Inexpensive adsorbent materials
Abundant level of adsorbent materials availability
Low economical method
2.OBJECTIVE OF THE STUDY
wastewater
To synthesis the adsorbent
To characterize the collected effluent To determine efficiency of adsorption
3.MATERIALS AND METHODS
WASTEWATER COLLECTION
Dyeing wastewater collected from Common Effluent Treatment Plant (CETP), SIPCOT-Perundurai. After collection, the wastewater was transferred immediately to the laboratory and stored at 5degree Celsius and the wastewater was not corrected for trace elements deficiency.
ADSORBENT COLLECTION & POWDERING
The raw materials (Citrus Aurantium peel) for adsorbents were collected fresh juice shop, Erode district.
Citrus Aurantium
The Citrus Aurantium peelwas collected dried and pulverized. The pulverized sample is activated at 400 degrees Celsius for a period of 20 minutes. Then, the samples are powdered and sieved by a series sieves, the powder used for the experiments having a granulation 600 micron.
PHYSICAL CHEMICAL CHARACTERISTIC OF
WASTEWATER
[image:2.595.326.541.283.419.2]The Physical-Chemical characteristics of the dyeing wastewater from Common Effluent Treatment Plant, SIPCOT are found and tabulated below.
Table: 3.1 Characteristics of wastewater
UV VISIBLE SPECTROMETER
Ultraviolet–visible spectroscopy or ultraviolet-visible spectrophotometry (UV-Vis or UV/Vis) refers to absorption spectroscopy or reflectance spectroscopy in the ultraviolet-visible spectral region. This means it uses light in the ultraviolet-visible and adjacent (near-UV and near-infrared [NIR]) ranges. The absorption or reflectance in the visible range directly affects the perceived colour of the chemicals involved. In this region of the electromagnetic spectrum, molecules undergo electronic transitions.
The intensities of these light beams are then measured by electronic detectors and compared. The intensity of the reference beam, which should have suffered little or no light absorption, is defined as I0. The intensity of the sample beam is defined as I. Over a short period of time, the spectrometer automatically scans all the component wavelengths in the manner described. The ultraviolet (UV) region scanned is normally from 190 to 400 nm, and the visible portion is from 400 to 800 nm.
4.RESULT AND DISCUSSION
WASTEWATER CHARACTERIZATION USING UV-SPEC.
[image:2.595.37.287.534.635.2]The collected sample has the peak absorbance of 1.4 ABS
Fig. 4.1 Absorbance graph for collected sample
It is found to be the maximum pollutance concentration of sample in my project. For plotting graph wavelength is taken along X-axis with the unit nm, and absorbance is taken along the Y-axis with the unit ABS.
ABSORBANCE OF WASTEWAER AT pH 3 FOR 30 MINS
Fig. 4.2 Absorbance graph: pH 3, 30 mins
[image:2.595.317.540.538.675.2]ABSORBANCE OF WASTEWAER AT pH 3 FOR 60 MINS
Fig. 4.3 Absorbance graph: pH 3, 60 mins
The above graph shows that the absorbance of wastewater treated at pH 3 with a contact time of 60 mins. The maximum peak of the graph is recorded as 0.925 ABS. The pollutance removal efficiency at pH 3 with contact time of 60 mins is found to be 57.9%
[image:3.595.322.532.146.262.2]ABSORBANCE OF WASTEWAER AT pH 3 FOR 90 MINS
Fig. 4.4 Absorbance graph: pH 3, 90 mins
The above graph shows that the absorbance of wastewater treated at pH 3 with a contact time of 90 mins. The maximum peak of the graph is recorded as 0.6123 ABS. The pollutance removal efficiency at pH 3 with contact time of 90 mins is found to be 77.9%.
ABSORBANCE OF WASTEWAER AT pH 3 FOR 120 MINS
Fig. 4.5 Absorbance graph: pH 3, 120 mins
The maximum peak of the graph is recorded as 0.557 ABS. The pollutance removal efficiency at pH 3 with contact time of 120 mins is found to be 82.1%
ABSORBANCE OF WASTEWAER AT pH 7 FOR 30 MINS
[image:3.595.55.256.375.490.2]
Fig. 4.6 Absorbance graph: pH 7, 30 mins
The above graph shows that the absorbance of wastewater treated at pH 7 with a contact time of 30 mins. The maximum peak of the graph is recorded as 1.26 ABS. The pollutance removal efficiency at pH 7 with contact time of 30 mins is found to be 50.3%
[image:3.595.340.533.399.512.2]ABSORBANCE OF WASTEWAER AT pH 7 FOR 60 MINS
Fig. 4.7 Absorbance graph: pH 7, 60 mins
The above graph shows that the absorbance of wastewater treated at pH 7 with a contact time of 60 mins. The maximum peak of the graph is recorded as 1.153 ABS. The pollutance removal efficiency at pH 7 with contact time of 60 mins is found to be 55.8%
ABSORBANCE OF WASTEWAER AT pH 7 FOR 90 MINS
[image:3.595.53.267.629.746.2] [image:3.595.334.544.646.765.2]The above graph shows that the absorbance of wastewater treated at pH 7 with a contact time of 90 mins. The maximum peak of the graph is recorded as 0.988 ABS. The pollutance removal efficiency at pH 7 with contact time of 90 mins is found to be 67.4%
[image:4.595.50.254.169.280.2]ABSORBANCE OF WASTEWAER AT pH 7 FOR120MINS
Fig. 4.9 Absorbance graph: pH 7, 120 mins
The above graph shows that the absorbance of wastewater treated at pH 7 with a contact time of 120 mins. The maximum peak of the graph is recorded as 0.925 ABS. The pollutance removal efficiency at pH 7 with contact time of 120 mins is found to be 74.4%
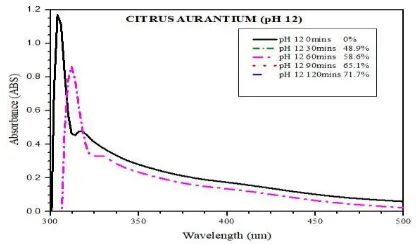
[image:4.595.322.540.170.301.2]ABSORBANCE OF WASTEWAER AT pH 12 FOR 30 MINS
Fig. 4.10 Absorbance graph: pH 12, 30 mins
The above graph shows that the absorbance of wastewater treated at pH 12 with a contact time of 30 mins. The maximum peak of the graph is recorded as 0.9154 ABS. The pollutance removal efficiency at pH 12 with contact time of 30 mins is found to be 48.9%
ABSORBANCE OF WASTEWAER AT pH 12 FOR 60 MINS
Fig. 4.11 Absorbance graph: pH 12, 60 mins
The above graph shows that the absorbance of wastewater treated at pH 12 with a contact time of 60 mins. The maximum peak of the graph is recorded as 0.862 ABS. The pollutance removal efficiency at pH 12 with contact time of 60 mins is found to be 58.6%
[image:4.595.58.261.409.516.2]ABSORBANCE OF WASTEWAER AT pH 12 FOR 90 MINS
Fig. 4.12 Absorbance graph: pH 12, 90 mins
The above graph shows that the absorbance of wastewater treated at pH 12 with a contact time of 90 mins. The maximum peak of the graph is recorded as 0.826 ABS. The pollutance removal efficiency at pH 12 with contact time of 90 mins is found to be 65.1%
ABSORBANCE OF WASTEWAER AT pH 12 FOR 120 MINS
Fig. 4.13 Absorbance graph: pH 12, 120 mins
The above graph shows that the absorbance of wastewater treated at pH 12 with a contact time of 120 mins. The maximum peak of the graph is recorded as 0.805 ABS. The pollutance removal efficiency at pH 12 with contact time of 120 mins is found to be 71.7%
CONSOLIDATED ABSORBANCE GRAPH
The consolidated absorbance graph for pH 3, 7, 12 with varying contact time of 0 mins, 30 mins, 60 mins, 120 mins are shown.
[image:4.595.326.528.437.560.2] [image:4.595.54.262.640.762.2]3. CONCLUSIONS
High Dye Removal efficiency is 82.1 %. These experimental studies have indicated that the Citrus Aurantium has the potential to act as an adsorbent for the removal of the colour and pollutants from aqueous solutions. The effects of contact time and pH on the sample were determined using the experimental data. The adsorption data are plotted graph and the pollutance removal efficiency is calculated. The optimized data for the adsorbent is at pH 3 with a contact time of 120 mins.
REFERENCES
[1] Ajmal.M,Rao.R.A.K,Ahmad.R and Ahmad.J (2000)
‘Adsorption studies on citrus reticulate (fruit peel of orange): removal and recovery of Ni(II) from electroplating wastewater’ Journal of Hazardous Materials, Vol. B 79, pp.117-131.
[2] Bernard , E., and Jimoh, A (2013) ‘adsorption of Pb, Fe,
Cu, And Zn from industrial electroplating wastewater by orange peel activated carbon’ International Journal of Engineering and Applied Sciences August 2013. Vol. 4, No. 2.
[3] Castro R.S.D, Caetano L, Ferreira G., 2011, Banana peel
applied to the solid phase extraction of copper and lead from river water: pre concentration of metal ions with a fruit waste, J. Industrial and engineering chemistry research, 50 (6), pp 3446–3451.
[4] Husoon Z.A., M.N.A. Al-Azzawi and S.A.K. Al-Hiyaly
(2013) ‘Investigation Biosorption Potential of Copper and Lead from Industrial Waste Water Using Orange and Lemon Peels’ Journal of Al-Nahrain University- Science Vol.16 (2), July, 2013, pp.713-179.
[5] Juan Carlos Moreno-Piraján, And Liliana Giraldo
(2012) ‘Heavy Metal Ions Adsorption from Wastewater Using Activated Carbon from Orange Peel’ ISSN: 0973-4945; CODEN ECJHAO E-Journal of Chemistry 2012, 9(2), 926-937.
[6] Moronkola, Giwa-Ajeniya, Alegbe, Eshilokun, Awokoya
and Okoh (2016) ‘The Adsorption of Divalent Metal Ions from Aqueous Media Using Unmodified Orange Peel (Musa sapientum) as Adsorbent’ Journal of Organic & Inorganic Chemistry, 2016, 2:1.
[7] Nimmala Anvesh Reddy, R. Lakshmipathy and N.C.
Sarada (2014) conducted a study on the Application of Citrullus lanatus (water melon) rind as biosorbent for removal of trivalent chromium from aqueous solution. Alexandria Engineering Journal Volume 53, Issue 4, December 2014, Pages 969–975.
[8] Olugbenga Solomon Bello, Mohd Azmier Ahmad (2011)
Adsorption of dyes from aqueous solution using chemically activated Mango peels. IPCBEE vol.6 (2011) © (2011) IACSIT Press, Singapore.
[9] Pollard.S.J.T, Fowler.G.D, Sollars.C.J and Perry.R (1992)
‘Low cost adsorbents for waste and wastewater treatment: a review’ Journal of Science of the total environment, Vol.116, pp. 31-52.
[10] Rao.K.S, M. Mohapatra, S. Anand, and P. Venkateswarlu
(2010) conducted a study on Review on cadmium removal from aqueous solutions. International Journal of Engineering, Science and Technology Vol. 2, No. 7, 2010, pp. 81-103.
[11] Samiksha V. Ashtikar , Amruta D. Parkhi (2014)
‘Adsorption of Copper from Aqueous SolutionUsing Mango Seed Powder’. International Journal of Engineering Research and Applications ISSN : 2248-9622, Vol. 4, Issue 4 (Version 7), April 2014, pp.75-77.
[12] Xiaomin Li. Yanru Tang, Xiuju CaoDandan, LuFang
Luo,Wenjing Shao (2008) ‘Preparation and evaluation of orange peel cellulose adsorbents for effective removal of cadmium, zinc, cobalt and nickel’ Colloids and Surfaces A: Physicochemical and Engineering Aspects Volume 317, Issues 1–3, 20 March 2008, Pages 512–521.
[13] Zhexian Xuan, Yanru Tang, Xiaomin Li, Yinghui