© 2018, IRJET | Impact Factor value: 6.171 | ISO 9001:2008 Certified Journal | Page 3734
Mention Anomaly Based Event Detection using Real-time Twitter Data
Shweta Bhatuse
1, Seema Shrawne
21
P.G. Student, Department of Computer Engineering, V.J.T.I, Mumbai, Maharashtra, India
2Assistant Professor, Department of Computer Engineering, V.J.T.I, Mumbai, Maharashtra, India.
---***---Abstract
- With the rise of social media, people are morehabitual to interact, post, share daily activities on social networking sites. This paper represents Twitter as social sensor for obtaining social media data. Many people use Twitter to share incidents or events happening with them and hence tweets are valuable source of timely information. Detecting events from Twitter data is difficult task as tweets that report interesting events is also overwhelmed by large volume of vague tweets. Existing event detection focuses on only textual content of tweets and ignores social aspect of Twitter. In this paper we propose mention anomaly based event detection technique that solely focuses on tweets and leverages the creation frequency of mentions present in tweets to detect events and their magnitude of impact over the crowd. It differs from other event detection techniques as it dynamically estimates the period of time during each event is discussed rather than assuming predefined fixed duration of time. This event detection approach leads to more accurate event detection by providing clear textual information and precise temporal descriptions. Furthermore visualization is done to explore detected events.
Key Words: Mention anomaly, magnitude of impact,
temporal descriptions, visualization.1. INTRODUCTION
Micro blogging is a broadcast medium that allows users to exchange small digital content such as short texts, links, images, or videos. Virtually any person witnessing or involved in any event is nowadays able to disseminate real-time information. Twitter is a social networking and micro-blogging service that allows users to publish short messages limited to 140 characters, i.e. tweets. Users share, discuss and forward various kinds of information ranging from personal daily events to important and global event related information in real-time. The increasing number of users tweeting around the world makes twitter a worthy source of information. On the other hand it becomes increasingly difficult to identify relevant information related to significant events. A major challenge facing event detection from Twitter streams is to separate the mundane and polluted information from interesting real-world events. An event is commonly defined as a thing that happens at one specific time (Becker et al, 2011 ; Aggarwal and Subbian, 2012). Twitter delivers a continuous stream of tweets, thus allowing the study of how topics grow and fade over time (Yang and Leskovec, 2011). But the list of "trends" determined by Twitter isn't so helpful since it only lists isolated keywords and provides no information about the level of attention it receives from the crowd not temporal
indications. Event detection methods focus on detecting “bursty” patterns which intuitively represents signal events. It uses term-weighting-based approach, topic-modelling-based approach and clustering-topic-modelling-based-approach (Weng and Lee, 2011;Li et al, 2012).
But the majority of prior work focuses on only textual content of tweets and ignores other aspects of Twitter data. However, users often insert extra-textual content in their tweets like user mentions which consists of citing other user’s screennames in tweet i.e. “@username”. Mentions are in fact dynamic links created either intentionally to engage the conversation with specific users or automatically when replying to someone or re-tweeting. These types of links are dynamic as they are limited for particular time period i.e. tweet lifespan and confined for particular topic that is being discussed.
We tackle the issue of event detection by devising new statistical model named mention anomaly based event detection approach. It relies completely on statistical measures obtained from tweets and produces list of events which described as a main word, coordinate words (related words occurred with main word), a period of occurrence of event and its magnitude of impact over crowd. In contrast with existing methods, this approach doesn't only focus on the textual content of tweets but also obtains the frequency at which users interact through mentions to detect the most impactful events more accurately. It also obtains the period of time during which event is discussed rather than assuming fix duration of time for all events.
The rest of this paper is organized as follows. In the next section we discuss related work, before describing in detail the proposed method in Section 3. Then an experimental study showing the method's effectiveness and efficiency is presented and then visualizations shown for exploring the detected events in section 4. Finally, we conclude and discuss future work in Section 5.
2. RELATED WORK
© 2018, IRJET | Impact Factor value: 6.171 | ISO 9001:2008 Certified Journal | Page 3735 Tweet data differs from traditional textual document streams,
in terms of publishing rate, content, etc. Therefore, developing event detection methods using Twitter data has been studied in several papers in recent years. Next, we give a brief survey of the proposed approaches.
2.1 Cluster based event detection
Sakaki et al. (2010) exploited tweets to detect specific types of events such as earthquakes and typhoons. They formulated event detection as a classification problem and trained an SVM on a manually labelled Twitter data set comprising positive events (earthquakes and typhoons) and negative events (other events or non-events. Naaman et al. (2011) uses temporal, social, topical, and Twitter-centric features. The temporal features rely on term frequency that appears in the set of messages associated with a cluster over time. The social features include the percentage of messages containing users interaction (i.e., retweets, replies, and mentions) out of all messages in a cluster. The topical features are based on the hypothesis that event clusters tend to revolve around a central topic, whereas non-event clusters often centre around various common terms (e.g., sleep or work) that do not provide event information. The Twitter-centric features are based on the frequency of multiword hashtags with special capitalization (e.g., BadWrestlingNames). Because the clusters constantly evolve over time, the features are periodically updated for old clusters and computed for newly formed ones. Finally, a support vector machine (SVM) classifier is trained on a labelled set of cluster features and used to decide whether the cluster (and its associated messages) contains real-world event information.
2.2 Term-weighting-based event detection
The Peakiness Score (Shamma et al, 2011) is a normalized word frequency, similar to the tf-idf, used for identifying words that are particular to a fixed length time window. However, individual words may not always be sufficient to describe complex events because of the possible ambiguity and the lack of context. To overcome this problem, Benhardus and Kalita (2013) propose a different normalized frequency metric i.e. Trending Score for identifying event-related n-grams. For a given n-gram and particular time window, the normalized frequency, tfnorm, of that n- gram with regard to the frequency of the other n-grams in the same window is computed. The Trending Score of n-gram in a particular time window is then obtained by normalizing the value of tfnorm in this time window with regard to the values calculated in the others.
2.3 Topic modeling based event detection
Latent Dirichlet Allocation (LDA) is a probabilistic generative model which automatically and jointly clusters words into topics and documents into mixture of topics. Topic modelling techniques such as LDA performs very well on the news data where a document is actually a mixture of a large number of topics. Lau et al (2012) proposes an online
variation of LDA. The idea is to incrementally update the topic model in each time window using the previously generated model to guide the learning of the new model. At every model update, the word distribution in topics evolves. However, the standard LDA doesn't work well on the Twitter data, the major problem is that if we consider a tweet as a single document, then the document is too sparse for the LDA. Yuheng et al (2012) note that this topic modelling methods is not efficient when applied to short documents such as tweets. To resolve this issue, they propose ET-LDA (joint Event and Tweets LDA) which expands tweets with the help of a search engine. But Aiello et al (2013) reveal that dynamic topic models don't effectively handle social streams in which many events are happening in parallel.
3. PROPOSED METHOD
3.1 Problem Definition
Input: As we want to detect events in real-time, tweet corpus C is obtained by extracting tweets through Twitter Streaming API. We discretise time-axis by partitioning tweet corpus into the n slices of tweet corpus of equal time length. Let V be the vocabulary of all terms i.e. words present in all tweets and V@ be the vocabulary of the terms used in tweets that contains at least one mention. Following table gives the definitions of notations:
Table -1: Sample Table format
Notations and Definitions
N Total number of tweets in the corpus Ni Number of tweets in the ith time-slice
Nit Number of tweets in the ith time-slice that contain the term t
N@t Number of tweets in the corpus that contain the term t and at least one mention
Ni@t Number of tweets that contain the term t and at least one mention in the ith time-slice
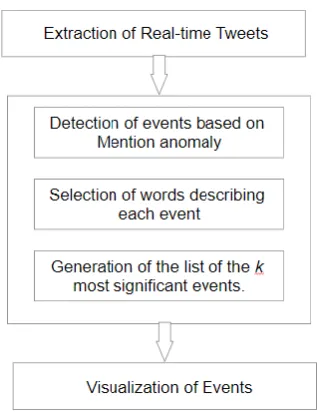
© 2018, IRJET | Impact Factor value: 6.171 | ISO 9001:2008 Certified Journal | Page 3736 Fig -1: Block Diagram of proposed method
The method has three phase flow. The first phase is extracting real time tweets for particular location, second phase is detection of events happening in that location and third phase is visualization of detected events to estimate its impact.
3.1.1 Extraction of Tweets
The input for our method is Real time Tweets extracted through Twitter Streaming API by providing location information whose events we want to detect. The extracted tweets is raw data so we need to preprocess the tweets to remove stopwords, slangwords, emoji patterns, URLs but mentions i.e. @username are kept as we want to detect events using mention frequency.
3.1.2 Event Detection
Before performing event detection, raw tweets are tokenized into words for entire corpus and vocabulary of words is created. Then frequency of each word present in vocabulary is calculated and (word, frequency) entry is stored for each vocabulary entry into vocabulary map. Then entire corpus is divided into corpus slices of fixed timestamp. For each corpus slice i, Global_frequency(Nit) and mention_frequency(Ni@t) is calculated for each word t and mention @t present in vocabulary respectively.
The event detection relies on three components: i) the detection of events based on mention anomaly ii) the selection of words describing each event and iii) the generation of the list of the k most impactful events.
i. Detection of events based on Mention anomaly
The mention creation frequency related to each term t ∈ v@ is analyzed and main terms having highest frequency are obtained. Result of this component is the list of partially
defined events but it doesn’t contain the set of terms related to the main term. The objective of this component is to precisely identify when event has happened and estimate its magnitude of impact over the crowd. This identifies the bursts based on computation of anomaly in the frequency of mention creation for each term in v@.
Computation of anomaly at a point :
Before calculating anomaly measure, the expected number of mention creation associated with term t for each slice of corpus i ∈ [1;n] is defined. We assume that the number of tweets contains term t and at least one mention in ith time slice Ni@t follows some probabilistic model. Thus we can compute probability. [A. Guille-2015].
where p@t is the expected probability of a tweet containing
and at least one mention in any time-slice. Because is large we further assume that P( ) can beapproximated by a normal distribution (Li et al, 2012).
It follows that the expected frequency of tweets containing the term t and at least one mention in the ith time-slice is:
Eventually, we define the anomaly of the mention creation frequency related to the term t at the ith time-slice this way:
The anomaly is positive if the mention creation frequency is strictly greater than the expectation. Event related terms that are specific to given interval of time are likely to have high anomaly values whereas the terms that are not event specific are likely to show little variation from expectation. Computation of magnitude of impact :
The magnitude of impact, Mag, of an event associated with time interval I=[a;b] and main term t is obtained as:
Identification of basic events :
For each word present in vocabulary, we identify the interval I that maximizes the magnitude of impact. That is:
© 2018, IRJET | Impact Factor value: 6.171 | ISO 9001:2008 Certified Journal | Page 3737 The properties of this computation is that the anomaly can
be negative at some point in time interval a to b because of lower activity on Twitter during night and another property is that the given term cannot be considered as the main term of more than one event.
This increases readability of event because if main term describes more number of events then that term is less specific to each event. Then such terms can be considered as coordinate terms rather than main terms.
Each basic_event detected can be describes with following information: i) main term t ii) a time interval I ii) its magnitude of impact over the twitting behavior of the users, Mag(t,I).
ii. Selection of words describing each event
The clustering-based methods in some cases give noisy event descriptions so new approach is provided to give semantically related descriptions. So coordinate terms are selected by applying some bound on number of terms need to be consider to describe each event. This bound is the fixed parameter p. This parameter is to ensure that event is not related with too many terms.
Identification of coordinate terms
The set of coordinate terms describing an event is the set of terms with p highest co-occurrence counts with main term t during the time interval I. Then most related coordinated terms are selected by obtaining correlation of coordinate terms with main terms. The correlation is obtained by calculating weight wq for each coordinate term. This weight is calculated using pearson’s coefficient and the autocorrelation is given as:
So the correlation coefficient equation for obtaining correlation coefficient between main term and coordinate term is:
Then weight of coordinate terms is calculated as a function of ροt,tq to estimate the definition of bursty topic [A. Guille-2015] i.e. 0<=w<=1
This formulation is same as tf-idf weights as it diminishes the weight of terms that occur very frequently in data and increases the weight of terms that occurs less frequently i.e. more specific terms. Then final set of related terms are selected from related coordinate terms whose weight Wtq>=Ѳ.
iii. Generation of the list of the k most impactful events
This phase is responsible to store description of events like magnitude (Mag), Time interval [a:b], main term, correlated terms. It is also responsible to manage duplicate events. Detecting duplicate events :
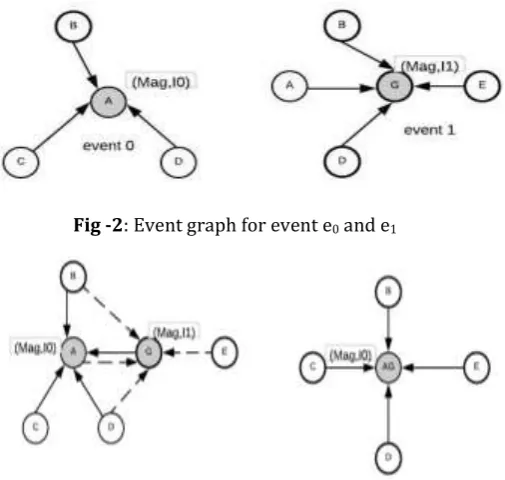
To detect duplicated events, two graphs are used. One is event graph which is directed, labeled, weighted graph to store the information of detected events. The representation of event e in graph is as follows: The main term is represented as node and magnitude Mag and Interval I is assigned to the node. Each coordinate term related with main term t is represented with node and has an edge towards main term node and weight of edge is assigned as wtq. Another graph is redundant graph which is undirected graph that is used to represent duplicated events with the help of their main words.
[image:4.595.316.569.289.529.2]Fig -2: Event graph for event e0 and e1
Fig -3: Collaboration of two duplicate events and Merging of duplicated events e0 and e1
Let e1 be the event that the component is processing .First it checks whether it is a duplicate of any event already stored graph or not. If it is not duplicate event, event is added into graph and count of distinct event is incremented. If event e1 is a duplicate of the event e0, a relation is added between main term t0 of e0 and main term t1 of e1 in redundancy graph. When count of distinct events reaches k, the duplicated events are merged and list of top k most impactful events is returned.
But the duplicate events are detected as follows:
© 2018, IRJET | Impact Factor value: 6.171 | ISO 9001:2008 Certified Journal | Page 3738 description of e1 is stored and edge between t0 and t1 is
added into redundancy graph.
Merging duplicate events
Identifying which events are duplicated and need to be merged is done by identifying connected components in redundancy graph. The merging is done by aggregating the main terms from all duplicated events into single node of main term. But its magnitude and time interval information remains same. The terms describing the updated events are the p highest weighted terms among all. After merging duplicated events the final list of k most impactful events is displayed.
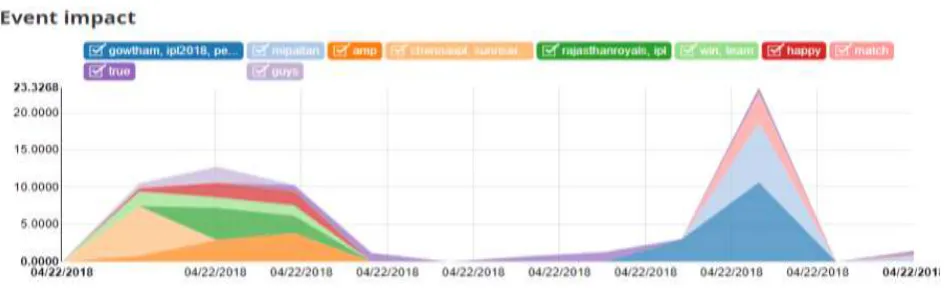
3.1.3 Visualization of events
The visualization of event is used to analyse the magnitude of impact of detected events. This visualization provides the temporal representation of top k significant events. The visualization of event using temporal information shows that some events are mostly discussed for certain duration of time. In next interval the same event may become impractical.
4. EXPERIMENTAL RESULTS
In this section, we represented the experimental study conducted on real-time twitter data to detect events for particular location. For this tweets are extracted from twitter through Twitter Streaming API by passing location coordinates or bounding box of city whose events we want to detect. For this experiment we have extracted English
language tweets for Mumbai by passing location coordinates through Streaming API. The tweet text and created_at(DD-MM-YYYY HH-MM-SS) information is stored in CSV format with two column headers text, date. So total 2635 tweets are extracted on 22nd April 2018 for approx. 6 hours from 1:36:41 PM to 7:23:21 PM.
After extraction of tweets the basic preprocessing is done on tweets like removing slangwords, emoji patterns, URLs are removed from tweet text. Now the event detection is performed on extracted data or corpus. Before event detection some parameters need to be consider like number of top k events k=10, number of candidate words per event p=10, theta Ѳ=0.7 and sigma σ=0.6. Then tweet text vocabulary is created by tokenizing tweet text and removing stopwords. Here total terms stored in vocabulary are 103. This vocabulary is stored in pickle file. The frequency of each term present in vocabulary is calculated and stored in vocabulary_entry. Then entire corpus is divided into corpus slices using fixed time-interval of 30 minutes. So, total 12 corpus slices are created. Then for each corpus slice, global_frequency and mention_frequency is calculated for each word present in vocabulary.
[image:5.595.94.502.473.739.2]Then basic event detection is performed for terms present in vocabulary. The basic events are detected by calculating maximum contiguous subsequence sum on mention frequency. Then anomaly is calculated for total mention frequency by obtaining difference between observed mention frequency and expected value. Then maximum time interval [a:b] and magnitude of event for which anomaly is greater in obtained time interval a to b is calculated. From this basic events containing magnitude, max interval, main term and anomaly information is detected.
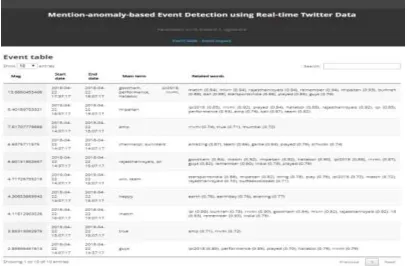
© 2018, IRJET | Impact Factor value: 6.171 | ISO 9001:2008 Certified Journal | Page 3739 Fig -5: Visualization of events
After detection of basic event using main term, there is a need to obtain coordinate terms related to main term is obtained by calculating autocorrelation coefficient between main term and coordinate term. Then weight of coordinate terms is calculated and this top p coordinate terms having weight > Ѳ are considered as related terms. Then event graph is created for each event where all related words are connected with main word and if duplicate events exist then the duplicated events are stored in redundancy graph. After this the duplicate events are merged by aggregating main terms of all duplicated events into single main term node. Finally k most significant events are displayed and visualized.
5. CONCLUSION AND FUTURE WORK
In this paper, mention anomalies are used for event detection by leveraging creation frequency of mention used in tweets. Then temporal information of tweets is considered to obtain time interval in which the event is considered bursty and then main terms are obtained for that time interval. Then along with main term, coordinate terms are also obtained and events are represented in form of graph to remove duplicate events. After detection, the events are visualized using temporal representation to indicate which event is discussed more at what duration. The proposed method can be extended to visualize the events on geographic map by extracting geographic information like latitude and longitude of tweets or place information of tweets.
REFERENCES
[1] Aggarwal CC, Subbian K (2012) Event detection in social streams. In: SDM, pp 624-635
[2] Becker H, Iter D, Naaman M, Gravano L (2011) Beyond trending topics: Real-world event identification on twitter. In: ICWSM, pp 438-441
[3] Yang J, Leskovec J (2011) Patterns of temporal variation in online media. In: WSDM, pp 177-186
[4] Weng J, Lee BS (2011) Event detection in twitter. In:ICWSM, pp 401-408
[5] Li C, Sun A, Datta A (2012) Twevent: Segment-based event detection from tweets. In: CIKM, pp 155-164
[6] Sakaki, Takeshi, Makoto Okazaki, and Yutaka Matsuo. "Tweet analysis for real-time event detection and earthquake reporting system development." IEEE Transactions on Knowledge and Data Engineering 25.4 (2013): 919-931.
[7] Mathioudakis, M., and N. Koudas. 2010. TwitterMonitor: Trend detection over the Twitter stream. SIGMOD Conference, Indianapolis, IN, pp. 11551158.
[8] Naaman, M., H. Becker, and Gravano. L. 2011. Hip and trendy: characterizing emerging trends on Twitter. Journal of the American Society of Information Science and Technology, 62(5): 902918.
[9] Benhardus J, Kalita J (2013) Streaming trend detection in twitter. IJWBC 9(1):122-139
[10] Shamma DA, Kennedy L, Churchill EF (2011) Peaks and persistence: modeling the shape of microblog conversations. In: CSCW, pp 355-358
[11] Lau JH, Collier N, Baldwin T (2012) On-line trend analysis with topic models: #twitter trends detection topic model online. In: COLING, pp 1519-1534
[12] Yuheng H, Ajita J, Doree DS, Fei W (2012) What were the tweets about topical associations between public events and twitter feeds. In: ICWSM, pp 154-161
[13] Aiello LM, Petkos G, Martin C, Corney D, Papadopou-los S, Skraba R, Goker, A, Kompatsiaris Y, Jaimes A (2013) Sensing trending topics in twitter. IEEE Trans Multimedia 15(6):1-15.
[14] Li C, Sun A, Datta A (2012) Twevent: Segment-based event detection from tweets. In: CIKM, pp 155-164