© 2017, IRJET | Impact Factor value: 5.181 | ISO 9001:2008 Certified Journal
| Page 5750
Shear Strengthening of RC beams using Embedded Through Section
(ETS) Technique
Aishwarya R
1, Preetha Prabhakaran
21
M.Tech Student, Dept. of Civil Engineering, Sree Narayana Gurukulam College of Engineering, Ernakulam, Kerala,
India
2
Associate Professor, Dept. of Civil Engineering, Sree Narayana Gurukulam College of Engineering, Ernakulam,
Kerala, India
---***---Abstract –
Strengthening of reinforced concrete (RC) beamsin shear is very essential as shear failure is a brittle and sudden failure without any warnings. ETS technique is one of the techniques newly developed to strengthen a beam in shear. This method also has proved to be efficient than the conventional methods like External Bonding of Reinforcement (EBR) and Near Surface Mounting (NSM) techniques. The ETS technique involves inserting of ETS steel bars from the soffit to the top face of the beam. In this paper, the influence on ETS bar diameter and ETS bar spacing on the ultimate load carrying capacity of the RC beam is studied. Results have shown that, the load carrying capacity of the RC beams increases when the ETS bar spacing decreases. Also, an increase in the ETS bar diameter increases the ultimate load carrying capacity of the RC beam.
Key Words
:
Shear Strengthening, Embedded
Through Section (ETS) Technique, ETS steel bar,
ETS bar diameter, ETS bar spacing
1.
INTRODUCTION
The embedded through-section (ETS) is an effective technique for the shear strengthening of reinforced concrete (RC) elements. This technique is based on the execution of holes drilled through the element cross section, in which steel or fibre reinforced polymer (FRP) bars are inserted and bonded to the surrounding concrete with an epoxy adhesive. Different strengthening techniques, like externally bonded reinforcement (EBR) and near surfaces mounted (NSM), are commonly applied for the shear strengthening of RC beams; however the ETS technique was proved to be particularly efficient, providing a significant increase in shear strength, usually higher than the one attained by using NSM and EBR techniques [10]. The ETS technique is also a cost competitive and feasible solution when EBR and NSM techniques cannot be applied [7].ETS technique has many structural benefits like increased shear strength and ductility of RC beam. It has a better bond performance to prevent debonding failure than EBR and NSM techniques. There is less chance to corrosion and fire damage to the ETS bars since they are protected by the core of the concrete. It can be used in case of bridge beams made contiguous with a deck so that only
the top and bottom faces of the concrete member are accessible.
Mofidi et.al [2] conducted experimental tests on RC beams strengthened in shear using the embedded through section CFRP method and an average increase in shear carrying capacity of 35% was found for the ETS CFRP retrofitted specimens. CFRP rods with a plain surface were 7.83% more effective than sand coated CFRP rods. Also, Breveglieri et.al [6] after conducting a comparative study using steel and CFRP ETS bars in RC beams proved that ETS CFRP bars are more effective than ETS steel bars. Breveglieri et.al [9] also studied the influence of inclination of ETS bars, spacing of ETS bars and percentage of existing stirrups on the ETS shear strengthening efficiency. It was found that, providing 45 degrees inclination in ETS bars increases the efficiency of shear strengthening as it arrests cracks, decreasing the ETS bar spacing increases the shear strengthening effectiveness and as the percentage of already existing shear stirrups increases, the ETS shear strengthening efficiency decreases.
2. EXPERIMENTAL PROGRAMME
2.1 Concrete Mix Proportion
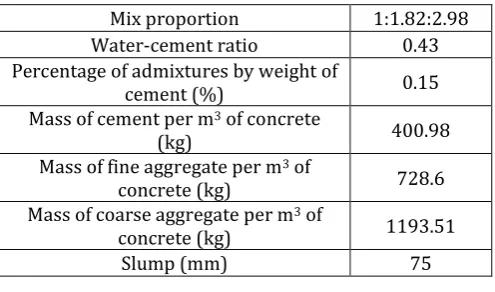
[image:1.595.311.559.625.771.2]M25 Grade concrete was used for the experimental study. IS 456:2000 was used for the mix design of M25 concrete. 53 grade OPC (Ordinary Portland Cement), 20mm size coarse aggregate and M–sand were used. MASTER GLENIUM SKY 8433 is the admixture used. The mix proportion used in the experimental study is shown in Table -1.
Table -1: Mix proportion of M 25 grade concrete Mix proportion 1:1.82:2.98
Water-cement ratio 0.43
Percentage of admixtures by weight of
cement (%) 0.15
Mass of cement per m3 of concrete
(kg) 400.98
Mass of fine aggregate per m3 of
concrete (kg) 728.6
Mass of coarse aggregate per m3 of
concrete (kg) 1193.51
© 2017, IRJET | Impact Factor value: 5.181 | ISO 9001:2008 Certified Journal
| Page 5751
2.2 Test Specimen and Specimen Configuration
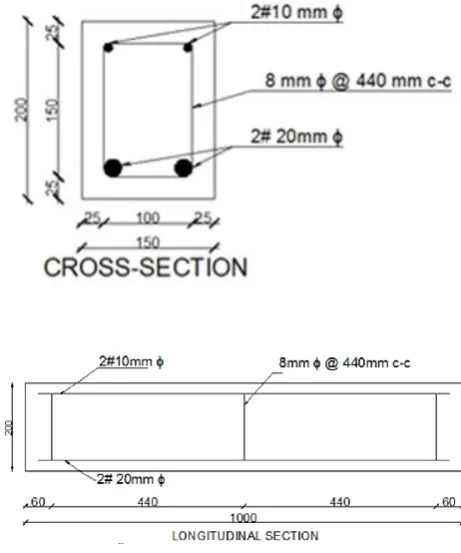
A total of 7 RC shear deficient beam specimens were casted and tested, one of them being the control specimen. The other 6 RC beam specimens were shear strengthened using ETS steel bars by varying the ETS steel bar diameter and ETS steel bar spacing. The cross-sectional dimensions of the specimens were 150 mm X 200 mm with a clear cover of 25 mm at the top and bottom and also at the sides of the beam. The specimen length was 1 m and the effective span is 0.88m.
The percentage of tension reinforcement provided is 2.094% which is a relatively higher value, taken so as to force the occurrence of shear failure in the strengthened beams so that we could study the shear strengthening effectiveness of ETS method. Two numbers of 20 mm diameter bars were provided at the bottom of the beam as tension reinforcement, and two numbers of 10 mm diameter bars were provided at the top of the beam as compression reinforcement. Stirrups of 8 mm diameter were provided at the two support points and at the loading point. The steel bars used were of the grade Fe 500.
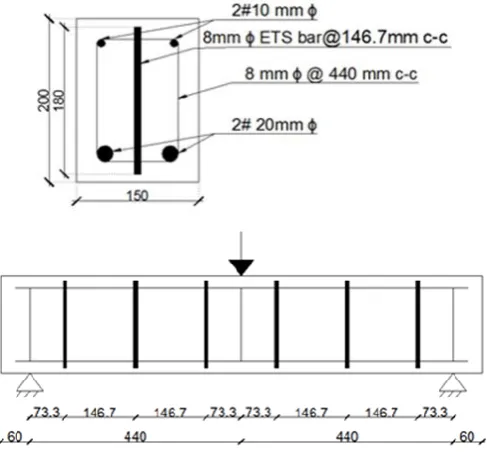
[image:2.595.316.547.149.426.2]There are six ETS configurations in this study with parameters being ETS bar diameter and ETS bar spacing. The diameters of ETS bars used are 8 mm, 10 mm and 12 mm respectively. Also, the spacing of ETS bars studied are 220 mm and 146.7 mm, i.e., one-fourth and one-sixth of the effective span, L of the beam. The ETS shear strengthening ratio can be calculated by taking the ratio of cross sectional area of an ETS bar to the product of breadth of RC beam and spacing of ETS bars. Table -2 shows the specifications of specimens.
Table -2: Specifications of Specimens Name Of
Specimen
ETS Steel
Bar
Diameter
ETS
Steel
Bar
Spacing
ETS shear
strengthening
ratio
ECB - - -
EsL/4d08 8mm L/4 0.15
EsL/6d08 8mm L/6 0.23
EsL/4d10 10mm L/4 0.23
EsL/6d10 10mm L/6 0.35
EsL/4d12 12mm L/4 0.34
EsL/6d12 12mm L/6 0.513
Fig -1 shows the Cross-section and Longitudinal section of Control beam. Fig -2 shows the Cross-section and Longitudinal section of EsL/4d08.
Fig -1:Cross-section and Longitudinal section of Control beam
[image:2.595.49.553.487.795.2]© 2017, IRJET | Impact Factor value: 5.181 | ISO 9001:2008 Certified Journal
| Page 5752
Fig -3 shows the Cross-section and Longitudinal section ofEsL/6d08. The other strengthened specimens which used 10mm and 12mm diameter ETS steel bars followed a similar pattern to that of the specimens EsL/4d08 and EsL/6d08.
Fig -3: Cross-section and Longitudinal section of EsL/6d08
2.3 Strengthening Procedure
[image:3.595.39.283.150.377.2]The seven beam specimens are cast in moulds of dimension 1 m x 150 mm x 200 mm. For the purpose of introducing ETS steel bars in the beams for strengthening, holes with full depth i.e., 200 mm are made in them during the casting process. The diameter of holes is such that it is 8 mm more than the diameter of ETS steel bar to be inserted. Thus, a gap of 4 mm is introduced between the ETS steel bar and the surrounding concrete which is occupied by the polyester resin Lokfix-S. For making holes, round and smooth steel rods with handles are placed in the beam mould prior to the casting process. After 3 to 4 hours of casting the beam, the steel rods are removed by slowly rotating and pulling them out slowly. One such beam after 24 hours of casting is shown in Fig -4.
Fig -4: A beam cast with holes
After 28 days of curing in water, the beams are taken out to dry for a day, the holes are cleaned using water and then the ETS bars are inserted into the holes and then bonded with the surrounding concrete using the adhesive Lokfix-S. A few strengthened beams are shown in Fig. 3.5.
Fig -5: Strengthened beams
2.4 Test Setup
[image:3.595.373.494.345.514.2]The beams cast using the above procedure is tested in UTM, the Universal Testing Machine with load range chosen as 0-500 kN. It is as shown in Fig. 3.6 below. The load is applied at midpoint of the beam specimen, increasing the load at a uniform rate till failure. The specimens are arranged with simply supported conditions with an effective span of 880 mm. Deflection of the beam was measured using a dial gauge of least count 0.01 mm at centre of the specimen. The three point loading arrangement for the beams is shown in Fig -5.
Fig -6: Three – point bending test in UTM
3. RESULTS AND DISCUSSION
[image:3.595.38.287.588.635.2]The control beam and strengthened beams are tested under three point bending and the results are obtained in terms of the ultimate load and deflection at ultimate load. Also, the failure modes were noted. All the beams failed in shear. The failure patterns of control beams and EsL/6d08 are shown in Fig -6 and Fig -7 respectively. The other strengthened beams also followed a similar shear failure pattern.
[image:3.595.307.559.662.733.2]© 2017, IRJET | Impact Factor value: 5.181 | ISO 9001:2008 Certified Journal
| Page 5753
Fig -8: Failure pattern of EsL/6d08The beam test results are tabulated in Table -3.
Table -3: Beam Test Results
Speci
men Shear ETS Strength
ening Ratio
Ultima te Load (kN)
Increa se In Ultima
te Load
(%)
Deflec tion At
Yield Load (mm)
Deflec tion At Ultima
te Load (mm)
ECB - 98 - 2.47 3.2
EsL/4 d08
0.15 119 21.43 2.93 4.3
EsL/6 d08
0.23 125 27.55 2.7 3.98
EsL/4 d10
0.23 127 29.59 2.9 4.55
EsL/6 d10
0.35 131 33.67 2.78 4
EsL/4 d12
0.34 132 34.69 3.05 4.58
EsL/6 d12
0.513 140 42.85 3.37 5.25
3.1 Influence of ETS Bar Spacing
The influence of ETS bar spacing in the load carrying capacity of the strengthened beams is one of the main parameters considered in this study. Two different spacing is chosen for the study. They are L/4 and L/6 where L is the effective span of the beam. All the specimens tested in this study follow a similar fashion for its load- deflection curve till its yield point and then there is an abrupt increase in the deflection followed by a sudden shear failure with minimal warnings.
3.98, 125
3.2, 98 4.3, 119
0 20 40 60 80 100 120 140
0 2 4 6
Loa
d
(kN)
Deflection (mm)
EsL/6d08
ECB
EsL/4d08
Chart -1: Load Vs deflection curves for ETS bar diameter of 8mm for the two ETS bar spacing
The specimen EsL/6d08 has an increase in ultimate load of 27.55% compared to the 21.43% increase for the specimen EsL/4d08. It is evident from Chart -1which shows the load Vs deflection curves for the strengthened specimens with ETS bar diameter of 8 mm for the two ETS bar spacing. From it, we can see that, the ultimate load is greater for the strengthened beam with ETS bar spacing of L/6.
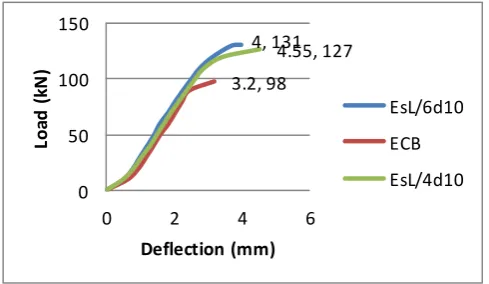
A very similar result is obtained for the next set of strengthened beams: EsL/4d10 and EsL/6d10 The specimen EsL/6d10 has an increase in ultimate load of 33,67% compared to the 29.59% increase for the specimen EsL/4d10 as shown in Chart -2which shows the load Vs deflection curves for the strengthened specimens with ETS bar diameter of 10 mm for the two ETS bar spacing. Thus, the ultimate load is greater for the strengthened beam with ETS bar spacing of L/6 when the ETS bar diameter is 10 mm.
4, 131
3.2, 98
4.55, 127
0 50 100 150
0 2 4 6
Loa
d
(k
N
)
Deflection (mm)
EsL/6d10
ECB
EsL/4d10
Chart -2: Load Vs deflection curves for ETS bar diameter of 10 mm for various ETS bar spacing
[image:4.595.311.556.534.676.2]© 2017, IRJET | Impact Factor value: 5.181 | ISO 9001:2008 Certified Journal
| Page 5754
shown in Chart -3 which shows the load Vs deflection curvesfor the strengthened specimens with ETS bar diameter of 12 mm for the two ETS bar spacing. The ultimate load is clearly greater for the strengthened beam with ETS bar spacing of L/6 when the ETS bar diameter is 12 mm.
5.25, 140
3.2, 98 4.58, 132
0 50 100 150
0 2 4 6
Loa
d
(kN)
Deflection (mm)
EsL/6d12
ECB
EsL/4d12
Chart -3: Load Vs deflection curves for ETS bar diameter of 12 mm for various ETS bar spacings
Chart -4 depicts a bar chart showing the effect of ETS bar spacing on the percentage increase in ultimate load. The three sets of results in it is a solid indication of the fact that the ultimate load carrying capacity is positively affected by the decreased spacing of the ETS bars.
27.55
33.67
42.85
21.43
29.59 34.69
0 10 20 30 40 50
Esd08 Esd10 Esd12
In
cr
ease in u
lti
m
ate
load
(%
)
ETS bar spacing= L/6
ETS bar spacing= L/4
Chart -4: Bar chart showing the effect of ETS bar spacing on the percentage increase in ultimate load
3.2 Influence Of ETS Bar Diameter
The effect of ETS bar diameter on shear strength is the second parameter considered in this study. The two spacing chosen for the study are L/4 and L/6 where L is the effective span of the beam as mentioned previously. Also the different ETS bar diameters taken are 8mm, 10mm and 12mm
respectively. The effect of these ETS bar diameters on the shear strength is elaborated in the current session.
The load Vs deflection curves for the strengthened specimens with ETS bar spacing of L/4 for the three ETS bar spacing are shown in Chart -5, i.e., for the specimens EsL/4d08, EsL/4d10 and EsL/4d12. From it, we can see that, the ultimate load is greater for the strengthened beam with ETS bar diameter of 12mm with an increase in ultimate load of 34.69% compared to the 21.43% and 29.59% increase for specimens EsL/4d08 and EsL/4d10 respectively. Also, as the diameter of ETS bars increases, its contribution towards the load carrying capacity of the RC beam also increases.
Chart -5: Load Vs deflection curves for ETS bar spacing L/4 for various ETS bar diameters
Now, decreasing the spacing of ETS bars from L/4 to L/6- the graphs of which are given in Chart -6 similar results as aforementioned is obtained, which is of course an increase in the ultimate load of RC beams as a result of increasing the diameter of ETS bars i.e., 27.55%, 33.67% and 42.85% increase in ultimate loads for the specimens EsL/6d08, EsL/6d10 and EsL/6d12 respectively.
5.25, 140
3.2, 98 3.98, 1254, 131
0 50 100 150
0 5 10
Loa
d
(k
N)
Deflection (mm)
EsL/6d12
ECB
EsL/6d08
EsL/6d10
© 2017, IRJET | Impact Factor value: 5.181 | ISO 9001:2008 Certified Journal
| Page 5755
Chart -7 depicts a bar chart showing the effect of ETS bardiameter on the percentage increase in ultimate load. The two sets of results in it indicates that the ultimate load carrying capacity increases as the spacing of the ETS bars decreases.
34.69 42.85
21.4329.59 27.55
33.67
0 20 40 60
EsL/4 EsL/6
In
cr
ease in U
lti
m
ate
Load
(%
)
ETS bar dia= 12 mm ETS bar dia= 08 mm
ETS bar dia= 10 mm
Chart -7: Bar chart showing the effect of ETS bar diameter on the percentage increase in ultimate load
4. CONCLUSIONS
The major conclusions derived from the experimental study are as follows:
Shear strengthening of RC beams by ETS method is very effective in increasing its load carrying capacity. The ETS shear strengthened beams have 21.43% to 42.85% increase in ultimate load compared to the unstrengthened beam.
The load carrying capacity of ETS strengthened beams increases as the spacing of the ETS bars decreases. Upto 13.27% increase in ultimate load is obtained when the spacing of ETS bars decreased from L/4 to L/6. The load carrying capacity of ETS strengthened beams
increases as the diameter of the ETS bars increases. An average of 11.22% increase in ultimate load is found when the diameter of ETS bars increased from 8mm to 10mm. Also, an average of 7.145% increase in ultimate load is found when the diameter of ETS bars increased from 10mm to 12mm.
REFERENCES
[1] A. Godat, A.L. Hady, O. Challal and K.W. Neale, “Bond Behaviour of the ETS FRP bar Shear-Strengthening Method”, Journal of Composites for Construction, 16, 529-539, 2012.
[2] Amir Mofidi, Omar Challal, Brahim Benmokrane and Kenneth Neale, “Experimental tests and design model for RC beams strengthened in shear using the embedded through section FRP method”, Journal of Composites for Construction, 16, 540-550, 2012.
[3] Ahmed Godat, Omar Challal, Kenneth W. Neale,
“Nonlinear finite element models for the embedded through-section FRP shear strengthening method”, Computers and Structures, 119, 12-22, 2013.
[4] E.Kaya, C.Kutan, S.Sheikh and A.Iiki, “Flexural Retrofit of
Support Regions of Reinforced Concrete Beams with Anchored FRP Ropes Using NSM and ETS Methods under Reversed Cyclic Loading”, Journal of Composites for Construction, 04016072, 1-16, 2016.
[5] J.A.O.Barros and G.M.Dalfre, “Assessment of the
Effectiveness of the Embedded Through-Section Technique for the Shear strengthening of Reinforced Concrete Beams”, Strain-An International Journal for Experimental Mechanics, 49, 75-93, 2012.
[6] M. Breveglieri, A. Aprile, J.A.O. Barros “Embedded
Through-Section shear strengthening technique using steel and CFRP bars in RC beams of different percentage of existing stirrups”, Composite Structures, 126, 101-113, 2015.
[7] M. Breveglieri, A. Aprile, J.A.O.Barros “RC beams strengthened in shear using the embedded through section technique: Experimental results and analytical formulation”, Composites Part B, 89, 266-281, 2016.
[8] M. Breveglieri, A. Aprile, J.A.O.Barros and A. Ventura-
Gouveia “Strategies for numerical modeling the behaviour of RC beams strengthened in shear using the
ETS technique”, Engineering Structures, 128, 296-315, 2016.
[9] Matteo Breveglieri, Alessandra Aprile, Joaquim A.O. Barros, “Shear strengthening of reinforced concrete beams strengthened using embedded through section steel bars”, Engineering Structures, 81, 76-87, 2014.
[10]O.Challal, A.Mofidi, B.Benmokrane and K.Neale,
“Embedded through section FRP Rod method for shear strengthening of RC beams : Performance and comparison with existing techniques”, Journal of Composites for Construction, 15, 374-383, 2011.