© 2017, IRJET | Impact Factor value: 5.181 | ISO 9001:2008 Certified Journal | Page 767
An Empirical Correlation for Two-Phase Inflow Performance
Relationship in Horizontal Oil Wells
Ramadan Emara
1, 21
(Home) Mining and Petroleum Engineering Department, Faculty of Engineering, Al Azhar University
2(Secondment) Petroleum and Natural Gas Technology Department, Faculty of Engineering,
The British University in Egypt
---***---Abstract -
The appropriate method to increase the wellproductivity in low permeability and naturally fractured reservoirs is the horizontal well because of its large reservoir contact area. Several investigators have utilized reservoir simulation to evaluate the horizontal well performance in solution gas drive reservoirs. This research scrutinizes the performance of a two phase inflow for a horizontal oil well producing through the boundary dominated flow regime. A 430 data points were collected from simulation of 43 data sets of fluid property, relative permeability and reservoir geometry. All data sets were investigated from initial pressure to minimum bottom-hole pressure. Linear regression analysis was used to develop an empirical inflow performance relationship (IPR) based on the simulator outcomes. Statistical analyses were used to evaluate the performance of the developed correlation. The obtained outcomes include an average relative error (ARE) of 0.78, an average absolute error (AARE) of 2.37 and coefficient of regression (R2) of 0.995. The presented IPR relationship was compared to other horizontal inflow performance relationships available in literature. The proposed correlation exhibited suitable approximations of well performance over a wide range of operating circumstances.
Key Words: Two-phase IPR; Solution gas drive reservoir;
Horizontal oil well IPR.
1. INTRODUCTION
The main task of a petroleum engineer is to enhance the well productivity. The horizontal well is the suitable solution for this purpose because of its reservoir contact area. The horizontal well accomplishes higher ultimate recovery than a vertical well in certain reservoir condition. In low permeability and naturally fractured reservoirs, the horizontal well represents the economic solution. The horizontal well represents an appropriate method for both production and injection in several enhanced oil recovery applications. Many researchers have used reservoir simulation to study the horizontal oil well behavior. These researches have led to present empirical correlations of IPR to estimate the performance of a horizontal oil well. In 1968, Vogel1 investigated the performance of a vertical well
in a solution gas drive reservoir. He developed an empirical IPR based on the investigation of simulation outcomes, and it
was simple to apply and gain rapid approval by industry. In 1973, Fetkovich2 scrutinized data of multi-rate tests
accomplished in 40 boundary- dominated flow oil wells of 6 different oil reservoirs. He displayed that, once the gas saturation of oil wells becomes larger than the critical gas saturation, the typical inflow performance relationship (IPR) of gas wells can also be applied for oil wells. The presented IPRs were for vertical oil wells and could not be suitable for horizontal oil wells. In 1987, Plahn et al.3 utilized a reservoir
simulator to study the effect of different reservoir rock and fluid properties on the behavior of multiphase flow of horizontal oil wells in a solution gas drive reservoir. They presented a set of type curves to predict the production from horizontal oil wells. In 1989, Bendakhlia and Aziz 4
investigated the horizontal oil wells performance in a solution gas drive reservoir using a commercial reservoir simulator. The authors concluded that, the reservoir fluid and rock properties did not affect significantly on the IPRs. They presented an IPR function of the stage of reservoir depletion. In 1990, Cheng5 investigated the performance of
slanted and horizontal oil wells using a vertical/horizontal/slanted well simulator (Boast VHS). The author observed that, the IPRs for horizontal and slanted wells proceed like to the Vogel’s IPR parabolic shape. He developed separate empirical IPRs corresponding with various angles. In 1998, Retnanto and Economides6 scrutinized the horizontal and
multibranched oil well performance in a solution gas drive reservoir using reservoir simulation. Based on nonlinear regression the authors developed an empirical IPR using simulation results. In 2005, Wiggins7 investigated the
performance of a horizontal oil well in a solution gas drive reservoir. The well was fully penetrating the reservoir producing through the boundary dominated flow regime. He presented two IPRs base on simulator results linear regression analysis. In 2013, based on linear regression analysis, Jabbar and AlNuaim8 introduced an equation of IPR
for a horizontal oil well producing from a solution gas drive reservoir using simulation results. The authors regressed the coefficients of the Harrison exponential equation to produce their equation. In 2013, Mohammadreza et al.9 presented a
Vogel-type IPR relationship based on regression analysis. They concluded that, the coefficients of their equation is a function of vertical and horizontal permeability ratio. In 2015. Ali Musa and Enamul10 developed correlations of IPR
© 2017, IRJET | Impact Factor value: 5.181 | ISO 9001:2008 Certified Journal | Page 768
set of downhole production data for 18 horizontal wells.They classified the data based on productivity index to produce their equations. In this research, a reservoir simulator was utilized to investigate the rate-pressure behavior of a horizontal oil well in a solution gas drive reservoir. The present paper suggests an empirical IPR based on linear regression analysis of the performance data produced through the simulation study. The developed IPR is compared to literature IPRs and shows suitable accuracy with those relationships.
2. Methodology
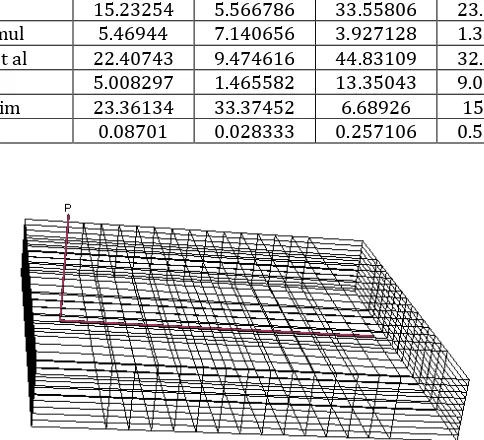
Eclipse Black oil reservoir simulator was used to generate rate-pressure data for a horizontal oil well in a solution gas drive reservoir. The simulation outcomes were created under the following assumptions: The horizontal well is completely penetrating the reservoir as shown in Fig 1, the production starts at the bubblepoint pressure, saturation of water phase is immobile, capillary pressure is negligible and boundary-dominated flow condition prevails. Forty-three various cases of reservoir circumstances were simulated to produce the rate-pressure behavior data. These cases cover a wide range of reservoir fluid, rock and geometry data. Table 1 illustrates the ranges of the simulated parameters. These parameters are initial pressure, temperature, oil gravity, gas gravity, residual oil saturation, critical gas saturation, connate water saturation, rock compressibility, horizontal well length, drainage width, horizontal and vertical permeabilities and pay zone thickness. A base case was installed to start the parameters sensitivity analysis. Afterwards, each parameter was varied from the lower value to the upper value of its range in each simulation run. In Table 1, the base case variable values are shown in the top line. For the rest of the cases reported, the reservoir variables are varied independently over the range presented in the table while preserving the values of the remainder of the variables in the base case. A blank space in the Table 1 displays that the base case value is carried forward. For each simulation case, the performance data of a horizontal oil well was obtained at constant bottomhole pressure. The maximum oil production rate was obtained from the simulator results at a minimum flowing bottomhole pressure of 14.7 psia. For all Forty-three reservoir cases, the inflow performance curves were developed from the generated data. Fig. 2 shows the pressure-production behavior for the base case developed in this paper. The curve is convex as observed by Vogel in his research of vertical oil wells. Based on Vogel observation, he presented a robust normalization procedure which led to the development of his IPR. Fig. 3 illustrates the normalized presentation of the information offered in Fig.2. The results of all simulation cases were normalized in this manner. Linear regression analysis was implemented on these outcomes. Generally the resulting equation can be written as follows:
(1) Where: P1= -1.875898 P2= 0.875071 P3=-1.536952 P4= 0.558035
3. Correlation Validation
In order to validate the accuracy of the derived correlation, statistical analysis has been used to evaluate its performance. Statistical indicators are presented in the appendix. The obtained outcomes include an average relative error (ARE) of 0.78, an average absolute error (AARE) of 2.37 and coefficient of regression (R2) of 0.995 for
horizontal oil well IPR.
4. Results and Discussion
For verifying the proposed two-phase inflow performance relationship of a horizontal oil well, the presented correlation was compared to the IPR methods of Cheng, Retnanto and Economides, Wiggins, Ali Musa and Enamul, Mohammad reza et al, Harrison and Jabbar and AlNuaim to estimate their suitability for use. Table 2 illustrates five simulated drawdowns test data. Table 3 illustrates a comparison of eight IPRs approaches to the simulated data that are shown in Table 2. This case compares how well each correlation estimates the maximum oil production rate from given test data. It is observed for this case that the proposed IPR provides the best estimates of the maximum oil production rate. However, percent differences for the IPR Presented in this study is less than 1% for test 1, 2, 3 and 4 and less than 5% for test 5, while the IPRs of the other methods estimate the simulated data of percent differences greater than 40% for test 5.
5. Conclusion
Numerical reservoir simulator was used to generate data of inflow performance for a horizontal oil well in a solution gas drive reservoir.
Based on the simulator outcomes, an empirical inflow performance relationship has been presented for horizontal oil wells producing from solution gas drive reservoirs that are suitable for use over a
wide range of reservoir properties
© 2017, IRJET | Impact Factor value: 5.181 | ISO 9001:2008 Certified Journal | Page 769
Nomenclature
API Oil gravity
C Rock compressibility, psi-1
h Oil formation thickness, ft L Horizontal well length, ft kh horizontal permeability, md
Kv vertical permeability, md
qo Oil production rate, STB/d
qom Maximum oil production rate, STB/d
P1-P4 Correlation coefficients
Pi Initial reservoir pressure, psi
Pwf Bottomhole flowing pressure, psi
Swi initial water saturation, fraction
Sor residual oil saturation, fraction
Sgc Critical gas saturation, fraction
T Reservoir temperature, oF
Xa drainage width, ft
ф porosity, fraction ϒg gas gravity
REFERENCES
[1].Vogel, J.V.: "Inflow Performance Relationships for Solution-Gas Drive Wells", JPT (Jan. 1968) 83-92. [2].Fetkovich, M.J.: "The Isochronal Testing of Oil
Wells", paper SPE 4529 presented at the 1973 SPE Annual Meeting, Las Vegas, NV, Sept. 30 - Oct. [3].Plahn, S.V., Startzman, R.A., and Wattenbarger, R.A.:
“A Method for Predicting Horizontal Well Performance in Solution-Gas-Drive Reservoirs,” paper SPE 16201 presented at the 1987 SPE Production Operations Symposium, Oklahoma City, OK, 8-10 March.
[4].Bendakhlia, H. and Aziz, K.: “Inflow Performance Relationships for Solution-Gas Drive Horizontal Wells,” paper SPE 19823 presented at the 1989 SPE Annual Technical Conference and Exhibition, San Antonio, TX, 8-11 Oct.
[5].Cheng, A.M.: “Inflow Performance Relationships for Solution-Gas Drive Slanted/Horizontal Wells, paper SPE 20720 presented at the 1990 SPE Annual Technical Conference and Exhibition, New Orleans, LA, 23-26 Sept.
[6].Retnanto, A. and Economides, M.J.: “Inflow Performance Relationships of Horizontal and Multibranched Wells in a Solution-Gas-Drive Reservoir,” paper SPE 50659 presented at the 1998
SPE European Petroleum Conference, The Hague, The Netherlands, 20-22 Oct.
[7].Wiggins, M.L., and Wang, H.-S.: “A Two-Phase IPR for Horizontal Oil Wells,” SPE 94302 presented at
2005 SPE Production
Operations Symposium, Oklahoma City, Oklahoma, 16-19 April.
[8].Jabbar and AlNuaim: “Analytical Comparison of Two Phase IPR Correlations for Horizontal Oil Wells” SPE 164143 presented at 2013 SPE Middle East Oil and Gas Show, Bahrain, 10-13 March.
[9].Mohammadreza, M., Babak, A., Mojtaba, P.S., Zhaorui Shi and Holden, Z.: “Generalized Inflow Performance Relationship (IPR) for Horizontal Wells” SPE 165691 presented at 2013 SPE Eastern Regional Meeting, Pennsylvania, USA, 20-22 August. [10]. Ali Musa and Enamul, H.: “A New
Correlation for Two Phase Inflow Performance Relationship in Horizontal Wells” SPE 127548 presented at 2015 SPE Middle East Oil and Gas Show, Bahrain, 8-11 March.
APPENDIX
Statistical Error Analysis
The following three statistical parameters were used in this study to evaluate the accuracy of the correlations.
1-Average percent relative error (ARE)
Where
2-Average absolute percent relative error (AARE)
3-Coefficient of correlation
The lower the value of Er the more equally distributed are
© 2017, IRJET | Impact Factor value: 5.181 | ISO 9001:2008 Certified Journal | Page 770
The correlation coefficient describes the range of connectionbetween two variables namely experimental and estimated values obtained from the correlation.
The value of r2 varies from -1 to +1. As the value of
[image:4.595.70.531.165.725.2]correlation coefficient approaches +1, it means there is a strong positive relationship between these two variables.
Table 1: Simulation cases
Case Pi T API ф ϒg Sor Sgc Swi C L Xa Kh Kv h
Base
Case 3500 180 45 0.2 0.65 0.3 0.05 0.25 0.00004 1500 1500 100 15 80 1 1500
2 2500 3 5000
4 150
5 165
6 220
7 20
8 35
9 60
10 0.12
11 0.16
12 0.24
13 0.55
14 0.6
15 0.7
16 0.2
17 0.25
18 0.4
19 0.02
20 0.04
21 0.1
22 0.15
23 0.2
24 0.35
25 0.000002
26 0.000004
27 0.00006
28 500
29 1000
30 2000
31 750
32 1250
© 2017, IRJET | Impact Factor value: 5.181 | ISO 9001:2008 Certified Journal | Page 771
Table 1: Continued34 30
35 70
36 150
37 5
38 10
39 20
40 50
41 65
[image:5.595.92.505.99.255.2]42 100
Table 2: Draw down Test Data
Item Test 1 Test 2 Test 3 Test 4 Test 5
Reservoir Pressure, psi 5000 5000 3500 3500 1500
Bottom-hole Flowing Pressure, psi 2250 1250 2275 1925 1425
Oil Flow Rate, STB/d 10024 11423 4911.24 6184.7 455.62
[image:5.595.75.520.414.541.2]Maximum oil Flow Rate, STB/d 12693.5 12693.5 7751.75 8541.6 2724.5
Table 3: Comparison of IPR Methods in Estimating the Maximum Oil Flow Rate
Method Test 1
Error % Error % Test 2 Error % Test 3 Error % Test 4 Error % Test 5
Cheng 6.173798 6.837288 1.734292 2.68301 42.74946
Retnanto and Economides 2.404854 2.45846 14.4138 8.41684 146.7242 Wiggins 15.23254 5.566786 33.55806 23.70714 120.1337 Ali Musa and Enamul 5.46944 7.140656 3.927128 1.330583 61.50319 Mohammad reza et al 22.40743 9.474616 44.83109 32.82265 144.9958 Harrison8 5.008297 1.465582 13.35043 9.027321 63.02585
Jabbar and AlNuaim 23.36134 33.37452 6.68926 15.6851 92.43212 This Study 0.08701 0.028333 0.257106 0.539955 4.840017
[image:5.595.178.420.465.685.2]