© 2018, IRJET | Impact Factor value: 6.171 | ISO 9001:2008 Certified Journal | Page 356
Performance Analysis Of Optimization Threshold And Fixed Threshold
In Energy Detection For Cognitive Radio
1
Vaghela Monaben P,
2Prof. Rahul M.Patel
1P.G. Student, Dept. of Electronics and Communication Engineering, GEC- Surat, Gujarat, India 2 Dept. of Electronics and Communication Engineering, GEC- Surat, Gujarat, India
---***---Abstract - Cognitive Radio is a new paradigm in wireless
communication to tackle the problem of spectrum underutilization. One of the important functions of cognitive radio is spectrum sensing. There are many spectrum sensing algorithms available in the literature out of which energy detection is widely used because it is easy to implement and it does not require prior information about PU (Primary User). In this paper, proposed threshold optimization for energy detection scheme which aims at maximizing spectrum utilization. All performance done under MATLAB R2017a.Numerical results demonstrate that proposed threshold outperforms the conventional energy detection.
Key Words: Cognitive radio, Spectrum sensing, Energy
detection, Adaptive threshold.
1. INTRODUCTION
With the increase in the number of wireless applications and wireless users, the demand of wireless spectrum is increasing day by day. Currently used fixed spectrum allocation policy is facing difficulty to accommodate the growing demand due to the shortage of spectrum. However it has been reported by FCC that it is not the shortage of spectrum but inefficient utilization [1]. It has been shown that large part of the spectrum is unused by the PUs or licensed users independent of time and space.
Cognitive radio is identified as a technique which may be used to solve the problem of spectrum under utilization [2]. This term “cognitive radio” was first coined by Joseph Mitola in his PhD thesis [3, 4]. In cognitive radio networks, Secondary Users (SUs) or unlicensed users also named as CRs can use licensed frequency band provided PU is not using that particular band. To enable this technology, SUs have to sense the spectrum to make a decision about the presence or absence of PUs and then SUs can use that frequency band to transmit its own data if PU is found absent. There are many spectrum sensing algorithms available in the literature which include matched filter detection, cyclostationary feature detection, energy detection and others. Energy detection is most widely used because of its simple implementation and as it does not require the prior information about the PU. However, the noise uncertainty degrades its performance in low SNR region. Performance of each sensing technique is measured in terms of probability of detection (Pd) and probability of
false alarm (Pf). Probability of detection is detecting the
presence of PU when PU is actually present and probability of false alarm is detecting the presence of PU when PU actually is not present. Higher probability of detection means the better protection of Pus and lower probability of false alarm means better utilization of the spectrum.
Conventional energy detector [5] uses a single threshold to detect the presence or absence of PU. CSS in which each CR employs double threshold instead of a single threshold was introduced in [6] where each CR makes a local decision when the observed energy is above the upper threshold or below the lower threshold otherwise did not report anything. In this case, some amount of sensing information is lost because CR does not report anything when the observed energy falls in between the two thresholds. If all the CRs lie in the confused region, sensing failure condition occurs.
In this paper,proposed threshold optimization for energy detection scheme which aims at maximizing spectrum utilization. The closed-form expression for adaptive threshold is derived and simplified.Results demonstrate that proposed threshold outperforms the conventional energy detection.
The rest of the paper is organized as follows: section 2 covers System model of energy detection, Section 3 covers spectrum utilization formulation and proposed threshold optimization. Section 4 shows simulations results and analysis and section 5 concludes the paper.
2. SYSTEM MODEL
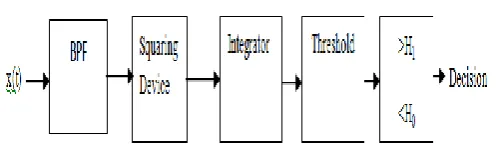
© 2018, IRJET | Impact Factor value: 6.171 | ISO 9001:2008 Certified Journal | Page 357 Fig.1: Block diagram of an energy detection scheme.
Analytically, determining the sample signal x(n)is reduced to an identification problem, formalized as an hypothesis test; H0 and H1. H0 implies absence, whereas H1 denotes
presence of the signal, represented by;
Where u (n ) is Additive White Gaussian Noise(AWGN) which is assumed as independent and identically distributed (i.i.d) random process with zero mean and variance σ2n. s(n) is PU signal and it is also assumed to be an i.i.d Gaussian random process with zero mean and variance σ2s.We further assume that both signal s(n) and noise u(n) are independent of each other. h(n) is the channel gain which has been assumed as unity. And n=1, 2,…., N is the index of the signal sample. Signal to noise ratio (SNR) is defined as the ratio of signal variance to noise variance (SNR () = σ2s / σ2n).
A conventional energy detector measures the energy (X) associated with the received signal and compare it with a predetermined threshold (λ) to decide among the two hypotheses H0 or H1.
Using an energy detector, a test statistic is computed from discrete samples of the channel under investigation [8, 9].
Y is the test statistic at the energy detector node; the number of samples under test is N. It is assumed that the noise power at the ED node is normally distributed with zero mean and unity variance. Thus, the received signal x(n)is normalized with respect to the noise power. Though the estimate of this noise power can be said to be uncertain.
From above equation, the distribution of the received signal energy at the ED node is written as,
and are the central and non-central chi square distributions, respectively, dis the time-bandwidth product at the node, is the non-centrality parameter equal to the signal to noise ratio .
The PDF for a chi-squared distribution, Y is (from [7])
Г (.) is the gamma function and Iv(.)is the vth-order modified
Bessel function of the first kind.
Pd is the probability that H1 is selected when a signal is
present. The expression for both Pd and Pfa are generally
computed as [10, 11],
Pd= P(Y>λ|H1)
Pfa =P(Y> λ|H0)
Here Q (.) is complementary distribution function of standard Gaussian given by [8];
erfc is a complementary error function.
Probability of miss detection would be given as, Pmd =1-Pd
3. SPECTRUM UTILIZATION FORMULATION
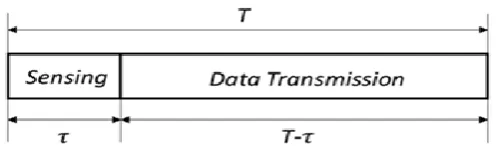
© 2018, IRJET | Impact Factor value: 6.171 | ISO 9001:2008 Certified Journal | Page 358 Fig.2: Frame structure
For analysis, I assume that interference lead to data loss and eventually to spectrum under utilization. I assume that the traffic loads of the PUs are exponentially distributed with mean occupation and idle time per frame as and respectively. Then , PUs spectrum occupancy will be given as;
= /(+)
In perfect sensing, probability of wrong decisions is zero (both Pfa and Pmd are equal to zero).In this case, SU will
transmit only if the channel is detected as idle and will keep silent if the channel is found occupied. But PU may appear in between two sensing epochs and suffer interference on account of SUs transmission .The probability that there is interference between PU and SU in such a case is given as [11];
In imperfect sensing,there are two types of sensing errors (i) miss detection (ii) false alarm makes the SU to keep silent even when the channel is actually vacant,So decreasing the chances of spectrum utilization. On the other hand ,miss detection leads to collisions between PU and SU transmission which results in data loss and ultimately decreases the spectrum utilization.In a miss detection case,PU may become inactive before the next sensing epoch and there is probability that there is no data loss even in miss detection .Probability of interference in miss detection is given as [11];
In view of above analysis ,average time for which the band is utilized either by a PU or SU for successful data transmission in a single frame may be formulated as;
First and second term of above equation represents the data transmission of SU while third and fourth represents data transmission of PU. Normalized spectrum utilization will be given as;
SU norm =SU/T
3.1 PROPOSED OPTIMIZATION THRESHOLD
The trade-off between Pd and Pfa is formulated to an
equivalent form of maximizing the normalized spectrum utilization in the capacity of the PUs spectrum occupancy and decision threshold λ as:
max (SU norm(λ)) = max(SU(λ))
Threshold that maximizes spectrum utilization can be calculated by differentiating SU w.r.t. threshold λ and equating it to zero as ∂SU = 0
∂λ
After simplification , I will get
Further simplification yields a quadratic equation as
As a solution of the quadratic equation, I get
The decision threshold should be positive and real therefore appropriate threshold is given as
4. SIMULATION RESULT AND ANALYSIS
System parameters for the numerial analysis are indicated below:
Sensing time =2ms Frame duration T=100ms
PU spectrum occupancy is varied from 0 to 1. Busy time of PU,= *T
Idle time of PU,=(1-) T For fixed threshold Pfa=0.1
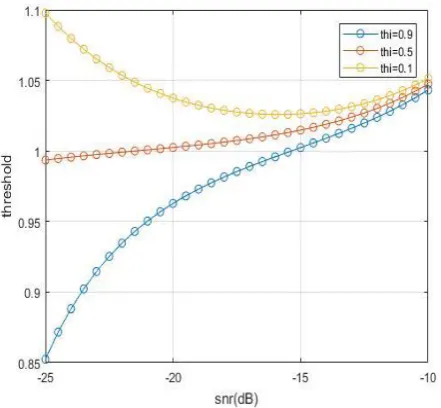
© 2018, IRJET | Impact Factor value: 6.171 | ISO 9001:2008 Certified Journal | Page 359 Fig 3:Threshold as a function of SNR
Fig 3 shows the curve between proposed adaptive threshold and SNR.Threshold is plotted for different PUs occupancy =0.1,0.5,0.9.It can be seen that threshold decreases with the increase in .
SNR Threshold
= 0.9 = 0.5 = 0.1
-25 0.8524 0.9936 1.098
-20 0.9629 1.002 1.038
-15 1.002 1.015 1.026
[image:4.595.315.551.344.526.2]-10 1.043 1.047 1.051
Table: 1: Threshold and SNR for different PUs occupancy
In fig 4, Spectrum utilization is plotted as a function of for different SNR values of -25dB,-20dB and -10dB.This curves shows better spectrum utilization for channels with high SNR.
Fig 5 shows the spectrum utilization as a function of SNR for fixed threshold and proposed adaptive threshold for =0.3.It can be seen that proposed adaptive threshold has maximum spectrum utilization when compared to fixed threshold.
Fig 4:Normalized spectrum utilization as a function of PUs spectrum occupancy()
Fig.5:Normalized spectrum utilization for proposed threshold and fixed thrshold when =0.3
SNR(dB) Normalized Spectrum Utilization Proposed
Threshold Fixed Threshold
-24 0.5756 0.5574
-19 0.5943 0.5891
-15 0.6539 0.6306
-13 0.6679 0.6322
-11 0.6692 0.6323
Table:2:SNR and Normalization Spectrum Utilization when =0.3
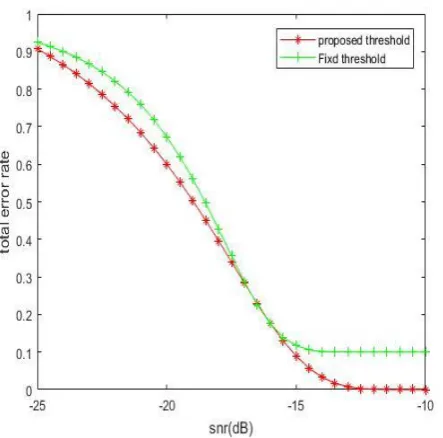
[image:4.595.27.294.392.467.2]© 2018, IRJET | Impact Factor value: 6.171 | ISO 9001:2008 Certified Journal | Page 360 Fig.6:Total error rate for proposed threshold and fixed
threshold
5. CONCLUSIONS
In this paper, a proposed threshold optimization technique is to maximize the normalized spectrum utilization for specified PU spectrum occupancy. The closed-form expression for adaptive threshold is derived while keeping in view the sudden appearance/disappearance of PU in between two sensing epochs. Numerical analysis shows the better spectrum utilization for the proposed scheme as compared to fixed threshold.
REFERENCES:
[1] Federal Communications Commission, “Spectrum policy task force report,” FCC 02-155, Nov 2002.
[2] Federal Communications Commission, “Notice of proposed rulemaking and order, Facilitating opportunities for flexible, efficient and reliable spectrum use employing cognitive radio technologies”, FCC 03-322, Dec.2003.
[3] J. Mitola and G. Q. Maguire, “Cognitive Radio: Making software radios more personal,” IEEE Pers. Communication. , vol. 6, no.4, pp 13-18, Aug. 1999.
[4] J. Mitola, “Cognitive radio: An integrated architecture for software defined radio,” PhD. Diss., Royal Institute of Technology, Stockholm, Sewden, 2000.
[5] H. Urkowitz, “Energy detection of unknown deterministic signals”, IEEE Proceedings, vol. 55 , no. 4, pp. 523-531, Apr. 1967.
[6] C. H. Sun, W. Zhang and K. Ben Letaief, ‘‘Cooperative spectrum sensing for cognitive radios under bandwidth
constraints,’’ IEEE Conf. on Wireless Communications and Networking, vols. 1-9, pp. 1--5, Mar. 2007.
[7] F. F. Digham, M. S. Alouini, and M. K. Simon, "On the Energy Detection of Unknown Signals Over Fading Channels", IEEE Transactions On Communications, vol. 55, pp. 21-24, 2007.
[8] Atapattu, S.; Tellambura, C.; Hai, Jiang & Rajatheva, N. , “Unified analysis of low-SNR energy detection and threshold selection” , IEEE Trans. Veh. Technol., 2015, 64(11), 5006-5019.
[9] Kozal, A.S.B.; Merabti M. & Bouhafs, F., “An improved energy detection scheme for cognitive radio networks in low SNR region”, In IEEE Symposium on Computers and Communications (ISCC), 2012, Cappadocia, pp. 000684-000689.
[10] Zhang KB, Bao Z., ”An Adaptive Spectrum Sensing Algorithm under Noise Uncertainty”, IEEE international Conference on Communication, 2011;1-5.