Identifying Relationship between Hearing loss
Symptoms and Pure-tone Audiometry Thresholds with
FP-Growth Algorithm
Nasir G. Noma
Biomedical Computing & Engineering Technologies (BIOCORE Malaysia) Applied
Research Group,
Centre for Advance Computing Technology, Universiti Teknikal Malaysia Melaka
Mohd Khanapi Abd Ghani
Biomedical Computing & Engineering Technologies (BIOCORE Malaysia) Applied
Research Group,
Centre for Advance Computing Technology, Universiti Teknikal Malaysia Melaka
ABSTARCT
Considerable numbers of studies have related audiometry hearing threshold values with various diseases and conditions that cause hearing loss. The purpose of this study was to find the relationship that exists between pure-tone audiometry threshold values and hearing loss symptoms in a medical datasets of 339 hearing loss patients using association rule mining algorithm. FP-Growth (Frequent Pattern) algorithm is employed for this purpose to generate itemsets given 0.2 (20%) as the support threshold value and 0.7 (70%) as the confidence value for association rule generation. Interesting relationships were discovered and the results were compared to earlier findings using the same method on a sample datasets of 50 hearing loss patients with 0.1 as the minimum support and 0.7 confidence thresholdsfor the association rule mining. There is similarity in the correlation that exists between symptoms and the pure-tone hearing thresholds from the initial study results and the correlation in the current study results. The experimental result with 339 patients medical datasets extends previously published findings on 50 patients’ medical datasets and the sets of symptoms that appear together is consistent with current knowledge of those symptoms occurring together as evidenced clinically.
Keywords
Threshold, Pure-tone, FP-Growth, sensorineural, tinnitus, vertigo
1.INTRODUCTION
With the rate at which medical data is accumulating, mining for knowledge from the data is essential for decision-making support and prediction. Pure-tone audiometry data can be used to measure auditory threshold as a function of stimulus frequency[1]. [2]Indicates a relationship between Meniere disease and low frequency sensorineural hearing loss.[3]Indicates, a connection between high-frequency sensorineural hearing loss and noise exposure, and the association of cardiovascular risk generated by smoking and diabetes with both high and low-frequency hearing loss. Pure-tone air and bone conduction thresholds audiometry were
obtained from unscreened population of older adults to observe the rate of changes over the period of 10 years. The baseline measurement predictors for that period are reported for specific age groups of both genders. The threshold changes over the said period for those at the age of 50 to 60 years old were found to be more at the higher frequencies while changes in threshold were at lower frequencies for the aged (80 years and above)[4]. Age-related changes in pure-tone audiometry were also observed in a longitudinal study on hearing thresholds of 813 adult males. The results shows steady rate of hearing loss at higher frequencies andincrease in the rate of hearing loss at lower frequencies[5]. A study on the effect of age and noise related hearing loss on high frequency thresholds was carried out on 187 industrial noise-exposed and 52 non-industrial noise-exposed subjects. The test-retest in the study shows high frequency audiometry (HFA) as a technique that is as reliable as the conventional in indicating noise-induced hearing loss and can be used more reliably to monitor hearing loss of individual cases over time period. Results from this study show both exposed and non-exposed subjects to have hearing loss at high frequencies (10-18 kHz). The effect of age seems more predominant than that of noise in the higher frequencies, this influence is not the same for the conventional frequency range (0.25-8kHz)[6]. In a similar study[7], results suggest ear with noise-induced hearing loss does not aged at the same rate with non-noise damaged ear. The study examined 15 year change in audiometric threshold of 203 men with mean age of 64 years to determine whether high frequency notches influences auditory aging. To determine if the rate of change in pure-tone hearing thresholds is differed by sex among Korean subjects, a slope of linear regression was used to measure the rate of change in pure-tone thresholds at 0.25-8kHz. Results indicates significant sex differences in pure-tone thresholds with thresholds of women lower than men at frequencies above 2kHz and hearing impairment worse in men than women at high frequencies 4-8kHz[8]. In another cross-sectional study to find differences in age-related audiometric results, a group of 473 subjects aged between 70 to 75 years were examined using pure-tone audiometry. Results indicate no significant differences in pure-tone thresholds between these age groups[9]. To study longitudinal changes in thresholds and the effects of threshold
Mohamad Khir Abdullah
Department of Otorinolaringologi Hospital PakarSultanah Fatimah Muar
levels on these longitudinal changes, high frequency pure-tone thresholds of 188 older adults between the ages of 60 to 81 years were analysed using the slope of linear regression to measure the rate of change in pure-tone thresholds[10]. [11]Suggests pure-tone audiometry as a reliable method to describe hearing status of a population after cross-sectional analysis of pure-tone hearing thresholds of 778 subjects of French descent aged 70 years and above. In a 5-year study, 342 diabetic veterans and 352 non-diabetic veterans who were tested on different audiometric measures, including pure-tone thresholds, results shows diabetic patients at the age of 60 years and younger have hearing loss at the high frequencies[12]. [13]Have also related age and genes to specific audiogram shapes.
2. RELATED WORKS
A number of studies have employed different machine learning and statistical methods in exploring and analysing audiometric data.[14]Have used a combination of statistical and neural techniques on audiology medical records with the aim of looking for factors influencing which patient will benefit from hearing aid. Audiogram shapes were clustered into homogeneous and heterogeneous groups using K-means clustering with the aim of helping clinicians in the diagnosis of hearing loss in the future[15]. [16]Experiment with multi-layer perceptron neural network and support vector machine in classifying ear disorders from otoneurological data. [17]Uses K-nearest neighbour and naïve Bayes classification algorithms to determine the classification accuracy of combining machine learnt knowledge with expert's knowledge. The results showed accurate classification when machine learnt knowledge is combined with the experts' knowledge.
3. METHODS
Hearing thresholds were obtained on 399 patients record across all ages (3-88 years) measured at 11 frequencies ranging from 0.125-8kHz from pure-tone audiogram collected over 10-year period from 2003 to 2012. The thresholds were the patients’ first audiometry test results obtained from Hospital PakarSultanah Fatimah file archive. Other attributes in the medical record such as diagnosis and bio data (age and gender) of the patients during the first visit were also collected. This is to avoid obtaining improved result after patient undergoes treatments.
The data was collected using hand-held digital scanner which is used to scan the document and saved in portable document format (PDF) format. This is later converted into digital format. The result is free text data comprising of diagnosis, age, gender and also numeric data in the form of audiometry thresholds. This is done by manually entering of each record into a text document. The data is saved in a in a format the FP-Growth algorithm can accept.
Some of the hearing loss symptoms, age, gender of the patients and audiometry thresholds were abbreviated. For example, the symptoms of tinnitus as (TNTS), vertigo as (VTG). Others like Meniere disease, otalgia, ottorhea, giddiness, and rhinitis were not abbreviated. The gender of male and female were represented as (F) for female and (M) for male. Ages of the patients were divided into three groups and represented as (E) for early, (M) for mid and (L) for late. For example, 55 years was represented as 5M (mid 50’s), late 80’s like 89 years was represented as 8L. Hearing thresholds were represented with colon in between the frequencies and
the sound dB. For example, 500:45R signifies threshold at frequency of 500Hz at 45dB for the right ear (R) and 8000:80L signifies high frequency of 8kHz at 80dB in the left ear (L).
Template-based approach is adopted as the approach that incorporates subjective knowledge for evaluating the quality of extracted itemsets[18]. This allows us to restrict the itemset generated by the frequent pattern growth (FP-Growth) algorithm. Hence, filtering all the itemsets and returning only those containing any of the symptoms of TNTS, VERTIGO, MENIERE, OTALGIA etc.
4.
COMPARISON
OF
CLUSTER
ANALYSIS
WITH
ASSOCIATION
ANALYSIS
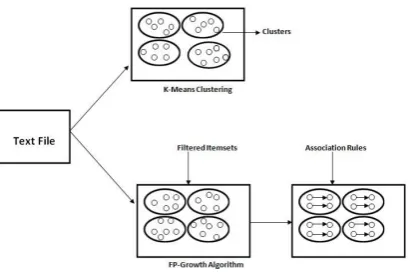
Clustering algorithm has been used in various studies to find patterns and relationships in audiometry dataset. It is a type of unsupervised learning that involves partitioning a set of objects into groups, such that the objects in the same group are similar while those in other groups are dissimilar [19]. [15] Have used K-means cluster analysis in grouping similar audiograms shapes shared by homogenous subjects and separating the ones shared by heterogeneous subjects. [20]. [21][22] Employs clustering algorithm in grouping distinctive audiometric profiles of hearing impaired children. However, association analysis with FP-Growth algorithm is more efficient in extracting related items in a dataset.
The relationship between items in a cluster is based on distance metric while that between items in the symptoms-based filtered itemsets is symptoms-based on minimum support and confidence threshold. There is more of relationship between items that frequently appear together in certain percentage of the data than those grouped together based on similarity. Generated itemsets from FP-Growth algorithm are classified into groups based on symptoms while only similar items are grouped in the same cluster using cluster analysis.
Table 1 and Figure 1 below depict the comparison between cluster analysis and association analysis in uncovering relationship in a dataset.
Table 1.Comparison of Cluster Analysis with Association Analysis
Content Relationship Between
Items
Filtering
Association Analysis
Itemsets Support and Conf. Threshold
Symptom-Based Itemsets
Clustering Analysis
Similar Items
Based on Distance metric
Figure 1: Comparison of Cluster Analysis with Association Analysis
5. FP-GROWTH ALGORITHM
Machine learning methods can enable the discovery of hidden patterns or rules occurring in dataset[17]. The discovery of knowledge can be determined when these patterns are new, useful and understandable[23]. Hence, knowledge discovery process transform data into knowledge[24]. The two most conventional ways of finding interesting patterns in data are association rules and frequent itemsets[25]. FP-Growth algorithm is built from Apriori algorithm[26]with different techniques of generating itemsets that commonly occur together in a dataset. FP-Growth algorithm can find frequent items more efficiently than apriori algorithm in that it scans the dataset only twice to generate itemsets. The first scan counts the frequency of all the items and removes the infrequent ones. The rule is, superset containing that item will also be infrequent and the second scan builds the FP-tree data structure which is traversed to mine frequent itemsets[26]. [27]Propose an efficient algorithm based on the FP-Growth for mining the complete set of all correlated pairs on transaction databases. FP-tree data structure has been used in combination with decision tree to generate CT scan brain images and classify the images for diagnosis[28]. FP-tree data structure is efficient and scalable for mining both long and short frequent patterns and is believed to be faster than any frequent pattern mining algorithm[29]. Storing of the datasets in the FP-tree structure results to faster execution time than many of the itemsets generation algorithm commonly used, with two orders of magnitude better in performance than algorithm like Apriori[26].
The extent of relationship between items within an itemset can be measured in terms of support and confidence. Support is the number of times a rule is applicable within a given dataset. An audiometry data ADjcontains itemsetS if S is a subset of AD. It can be represented mathematically:
Ϭ (S) = |{ADi|S
ADi, ADiD}| (1)Ϭ (S) denotes support for an itemsetS. ADirefers to individual audiometry data with S as its subset (S
ADi) which means every item of S is also an item in ADiand ADiis an element of the dataset (D).Confidence measures the reliability of inference made by an association rule[18]. It suggests a strong correlation between items within an itemset in the antecedent and consequent of the rule[18]. For example, the high confidence in rule TNTS→2000:30 shows high probability for 2000:30 hearing threshold to be in individual audiometry data (ADi) that
contains TNTS. Confidence determines the frequency of appearance of items in itemset (S) in data (ADi) that contains item (T). The metrics for this can be represented:
(2)
(3)FP-Growth algorithm was used to find frequent itemsets within the patient’s audiometry dataset. The minimum support threshold of 0.2 (20%) was chosen for itemset generation and 0.7 (70%) as the confidence threshold value for association rule mining. Although, it is difficult to find minimum support and confidence threshold that give satisfactory result, we chose 0.2 as the minimum support value and 0.7 as confidence value because rules are generally uninteresting if they apply to less than 10% of the dataset[30].
5.1 FP-Growth Algorithm
Input: Dataset (D) Minimum Support (minS)
Output: Set of frequent patterns
Step 1: Constructing the FP-Tree
I) Removing items not meeting minS For each element in header table If element <minS
Delete element
If no element meet minimum support Exit
II) Sort element by global frequency
III) Populate tree with ordered frequent itemset IV) Build the FP-Tree
Start with null set (ϴ) Add frequent items to ϴ
If path exist
Additemset to existing path Else
Create new path
V) Mining frequent items from the tree
Extracting conditional pattern bases
If leaf node != None
Add leaf node to prefix path
Create conditional FP-Trees
Start from the bottom of header table Construct conditional FP-trees Mine the conditional FP-trees VI) For each Frequent Itemset (S)
For each item (T) in S If T == Symptoms Return S
6. RESULTS
[image:4.595.314.539.90.316.2]The result of initial study carried out on 50 patient’s medical record and pure-tone audiometry measures[32] is depicted in table 2, 3 and 4. This is compared with the result for the current study on 339 patient’s audiometry data which is in table 5 and 6.
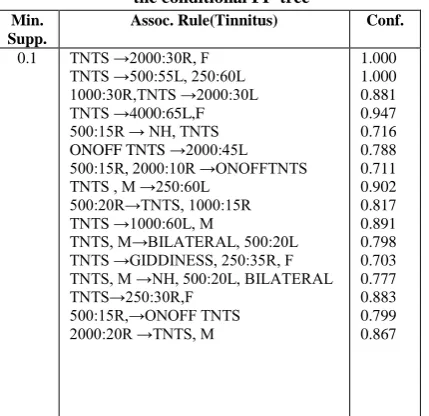
Table 2. Initially observed Tinnitus association rules from the conditional FP-tree
Min. Supp.
Assoc. Rule(Tinnitus) Conf.
0.1 TNTS →2000:30R, F
TNTS →500:55L, 250:60L 1000:30R,TNTS →2000:30L TNTS →4000:65L,F 500:15R → NH, TNTS ONOFF TNTS →2000:45L 500:15R, 2000:10R →ONOFFTNTS TNTS , M →250:60L
500:20R→TNTS, 1000:15R TNTS →1000:60L, M
TNTS, M→BILATERAL, 500:20L TNTS →GIDDINESS, 250:35R, F TNTS, M →NH, 500:20L, BILATERAL TNTS→250:30R,F
500:15R,→ONOFF TNTS 2000:20R →TNTS, M
1.000 1.000 0.881 0.947 0.716 0.788 0.711 0.902 0.817 0.891 0.798 0.703 0.777 0.883 0.799 0.867
Table 3.Initially observed Vertigo association rules from the conditional FP-tree
Min. Supp.
Assoc. Rule(Vertigo) Conf.
0.1 VTG→ 4000:65L, F
VTG →1000:10L, BILATERAL VTG→1000:10L, NH
250:35R →VRTG, F
VTG, M →500:20R, NH, BILATERAL VTG→1000:10L, 500:20L
VTG →500:15R, F 2000:20R →VTG, M VTG →1000:10L, F VTG →2000:25, F 500:15R →1000:10R, VTG 2000:15R →4000:10R, VTG 4000:10R, VTG →500:20L, NH
4000:10R, VERTIGO → BILATERAL,NH 2000:15R → VTG, F
250:35R, VTG →500:25, F
VTG, 1000:10L→1000:15R, BILATERAL 1000:60L →2000:55L, VTG
0.958 0.805 0.809 0.772 0.702 0.782 0.878 0.791 0.813 0.790 0.761 0.707 0.801 0.798 0.885 0.801 0.813 0.859
Table 4.Initially observed Giddiness association rules from the conditional FP-tree
Min. Supp.
Assoc. Rule (Giddiness) Conf.
0.1 GIDDINESS →250:35R, F
500:20R → GIDDINESS TNTS, GIDDINESS→250:35R, F
0.899 0.790 0.840
Table 2, 3 and 4 above, shows the relationship between hearing loss symptoms, gender and audiometry thresholds from initial study on 50 hearing loss patient’s dataset[32]. As previously explained TNTS represents tinnitus, VTG means vertigo, NH means normal hearing, BILATERAL means both ears, M and F represent the two genders of male and female while L and R signifies left and right. 0.1 (10%) was chosen as support value for itemsets generation and 0.7 (70%) as confidence value for association rule. Interesting relationships were discovered between pure-tone audiometry thresholds and three different symptoms of tinnitus, vertigo and giddiness.
Table 5. Currently observed Tinnitus/Vertigo association rules from the conditional FP-tree
Min. Supp.
Assoc. Rule (TNTS/VERTIGO) Conf.
0.2 TNTS, VTG→500:20R, M 0.931
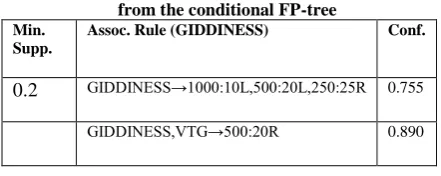
[image:4.595.316.538.91.317.2] [image:4.595.56.271.371.579.2]Table 6.Currently observed Giddiness association rules from the conditional FP-tree
Min. Supp.
Assoc. Rule (GIDDINESS) Conf.
0.2 GIDDINESS→1000:10L,500:20L,250:25R 0.755
GIDDINESS,VTG→500:20R 0.890
The association rules for the current studies are shown in table 5 and 6. When comparing between the results from initially observed tinnitus association rules in table 2 with that of currently observed tinnitus and vertigo association rules in table 5, results in table 2 shows correlation between symptoms of tinnitus and normal hearing threshold at 0.5kHz (500:15R,→ONOFF TNTS) in the right ear “R”. This is reflected in the current study on 339 patients where results from table 5 shows correlation between symptoms of tinnitus and vertigo and normal hearing threshold at 0.5 kHz (TNTS, VTG→500:20R, M) also in the right ear “R” in male patients. Similar relationship can be found in initially observed vertigo association rules in table 3 where a similar correlation also exist between normal hearing threshold and vertigo (VTG, M →500:20R, NH, BILATERAL), (VTG →500:15R, F).
Current study results in table 5 shows association rules (TNTS, VTG→250:40R, 400:45R, F). Similar rules can be seen in the initial studies in table 2 (TNTS→250:30R, F), (TNTS, M →250:60L) and (TNTS →GIDDINESS, 250:35R, F). This shows similarity of initial study results and that of the current study where both shows low frequency mild-moderate hearing loss in patients with condition of tinnitus. The result in table 3 also reflects this; (250:35R →VRTG, F).
The current study result in table 6 shows correlationbetween the symptoms of giddiness and somepure-tonethresholds. Thissignifiescorrelationbetweengiddiness and normal hearing at highfrequencythresholds in the left and rightear; (GIDDINESS→1000:10L, 500:20L, 250:25R). Similar resultisreflected in the initial study result in table 4; (500:20R → GIDDINESS).
6. AKNOWLEDGEMENT
The authors wish to thank the Department of Otolaryngology, Hospital Sultanah Fatimah, Muar, Johor for their support and cooperation and for making the sample medical audiology records available to us.
7. CONCLUSION AND FUTURE WORK
The results from previous study on 50 patient’s audiometric data were analysed. Interesting relationship between pure-tone audiometry and other attributes in the medical datasets were uncovered and represented in the form of association rules extracted from frequent itemsets. These rules suggest the existence of strong connection between items within sets of itemsets. Similar results were compared with that of recent study on 339 patient’s audiometric data using the same method but with increase in itemsets generation support threshold from 0.1 used in the previous study to 0.2. The two results were found to correspond. This indicates relationship between those symptoms within that range of pure-tone thresholds. However, there is the need for prior knowledge about relationships between these attributes because association analysis does not necessarily indicatecausality[18]. For example[31]indicate tinnitus patients have higher thresholds in mild and higher frequencies. This corresponds with our result. More data is needed for future experiment to confirm this. In the near future we would include both air and bone conduction thresholds and use FP-Growth algorithm to trim the data down to only important information which we can use to predict hearing loss symptoms given the two thresholds of a patient.
8. REFERENCE
[1] C. Halpin and S. D. Rauch, ‘Clinical implications of a damaged cochlea: pure tone thresholds vs information-carrying capacity’, Otolaryngol Head Neck Surg, vol. 140, no. 4, pp. 473–476, Apr. 2009.
[2] J. H. Hwang, H. C. Ho, C. J. Hsu, W. S. Yang, and T. C. Liu, ‘Diagnostic value of combining bilateral electrocochleography results for unilateral Ménière’s disease’, Audiol. Neurootol., vol. 13, no. 6, pp. 365–369, 2008.
[3] Y. Agrawal, E. A. Platz, and J. K. Niparko, ‘Risk factors for hearing loss in US adults: data from the National Health and Nutrition Examination Survey, 1999 to 2002’, Otol. Neurotol., vol. 30, no. 2, pp. 139–145, Feb. 2009. [4] T. L. Wiley, R. Chappell, L. Carmichael, D. M.
Nondahl, and K. J. Cruickshanks, ‘Changes in hearing thresholds over 10 years in older adults’, J Am Acad Audiol, vol. 19, no. 4, pp. 281–292; quiz 371, Apr. 2008. [5] L. J. Brant and J. L. Fozard, ‘Age changes in pure-tone
hearing thresholds in a longitudinal study of normal human aging’, J. Acoust. Soc. Am., vol. 88, no. 2, pp. 813–820, Aug. 1990.
[6] H. O. Ahmed, J. H. Dennis, O. Badran, M. Ismail, S. G. Ballal, A. Ashoor, and D. Jerwood, ‘High-frequency (10-18 kHz) hearing thresholds: reliability, and effects of age and occupational noise exposure’, Occup Med (Lond), vol. 51, no. 4, pp. 245–258, Jun. 2001.
[7] G. A. Gates, P. Schmid, S. G. Kujawa, B. Nam, and R. D’Agostino, ‘Longitudinal threshold changes in older men with audiometric notches’, Hear. Res., vol. 141, no. 1–2, pp. 220–228, Mar. 2000.
[8] S. Kim, E. J. Lim, H. S. Kim, J. H. Park, S. S. Jarng, and S. H. Lee, ‘Sex Differences in a Cross Sectional Study of Age-related Hearing Loss in Korean’, Clin Exp Otorhinolaryngol, vol. 3, no. 1, pp. 27–31, Mar. 2010. [9] R. Jönsson, U. Rosenhall, I. Gause-Nilsson, and B.
Steen, ‘Auditory function in 70- and 75-year-olds of four age cohorts. A cross-sectional and time-lag study of presbyacusis’, Scand Audiol, vol. 27, no. 2, pp. 81–93, 1998.
[10] F.-S. Lee, L. J. Matthews, J. R. Dubno, and J. H. Mills, ‘Longitudinal study of pure-tone thresholds in older persons’, Ear Hear, vol. 26, no. 1, pp. 1–11, Feb. 2005. [11] C. Blanchet, C. Pommie, M. Mondain, C. Berr, D.
Hillaire, and J.-L. Puel, ‘Pure-tone threshold description of an elderly French screened population’, Otol. Neurotol., vol. 29, no. 4, pp. 432–440, Jun. 2008. [12] N. Vaughan, K. James, D. McDermott, S. Griest, and S.
[13] A.-M. R. de Heer, P. L. M. Huygen, R. W. J. Collin, H. Kremer, and C. W. R. J. Cremers, ‘Mild and variable audiometric and vestibular features in a third DFNA15 family with a novel mutation in POU4F3’, Ann. Otol. Rhinol. Laryngol., vol. 118, no. 4, pp. 313–320, Apr. 2009.
[14] M. N. Anwar and M. P. Oakes, ‘Data mining of audiology patient records: factors influencing the choice of hearing aid type’, in Proceedings of the ACM fifth international workshop on Data and text mining in biomedical informatics, New York, NY, USA, 2011, pp. 11–18.
[15] C.-Y. Lee, J.-H. Hwang, S.-J. Hou, and T.-C. Liu, ‘Using cluster analysis to classify audiogram shapes’, Int J Audiol, vol. 49, no. 9, pp. 628–633, Sep. 2010. [16] M. Moein, M. Davarpanah, M. A. Montazeri, and M.
Ataei, ‘Classifying ear disorders using support vector machines’, in 2010 Second International Conference on Computational Intelligence and Natural Computing Proceedings (CINC), Sept., vol. 1, pp. 321–324.
[17] K. Varpa, K. Iltanen, and M. Juhola, ‘Machine learning method for knowledge discovery experimented with otoneurological data’, Comput Methods Programs Biomed, vol. 91, no. 2, pp. 154–164, Aug. 2008.
[18] P.-N. Tan, M. Steinbach, and V. Kumar, Introduction to Data Mining, 1st ed. Addison-Wesley, 2005.
[19] C. Sammut and G. I. Webb, Eds., Encyclopedia of Machine Learning, 2010th ed. Springer, 2011.
[20] L. Ciletti and G. A. Flamme, ‘Prevalence of hearing impairment by gender and audiometric configuration: results from the National Health and Nutrition Examination Survey (1999-2004) and the Keokuk County Rural Health Study (1994-1998)’, J Am Acad Audiol, vol. 19, no. 9, pp. 672–685, Oct. 2008.
[21] K. C. P. Yuen and B. McPherson, ‘Audiometric configurations of hearing impaired children in Hong Kong: implications for amplification’, Disabil Rehabil, vol. 24, no. 17, pp. 904–913, Nov. 2002.
[22] K. C. P. Yuen and B. McPherson, ‘Audiometric configurations of hearing impaired children in Hong
Kong: implications for amplification’, Disabil Rehabil, vol. 24, no. 17, pp. 904–913, Nov. 2002.
[23] N. Wickramasinghe, R. K. Bali, and B. Lehaney, Healthcare Knowledge Management Primer. Taylor & Francis, 2009.
[24] U. Fayyad, G. Piatetsky-shapiro, and P. Smyth, ‘From Data Mining to Knowledge Discovery in Databases’, AI Magazine, vol. 17, pp. 37–54, 1996.
[25] P. Cabena, Hadjnian, Stadler, Verhees, and Zanasi, Discovering Data Mining: From Concept to Implementation. Prentice Hall, 1997.
[26] P. Harrington, Machine Learning in Action. Manning Publications, 2012.
[27] Z. He, S. Deng, and X. Xu, ‘An FP-Tree Based Approach for Mining All Strongly Correlated Item Pairs’, in Computational Intelligence and Security, Y. Hao, J. Liu, Y. Wang, Y. Cheung, H. Yin, L. Jiao, J. Ma, and Y.-C. Jiao, Eds. Springer Berlin Heidelberg, 2005, pp. 735–740.
[28] P. Rajendran and M. Madheswaran, ‘Hybrid Medical Image Classification Using Association Rule Mining with Decision Tree Algorithm’, arXiv:1001.3503, Jan. 2010.
[29] J. Han, J. Pei, Y. Yin, and R. Mao, ‘Mining Frequent Patterns without Candidate Generation: A Frequent-Pattern Tree Approach’, Data Min. Knowl. Discov., vol. 8, no. 1, pp. 53–87, Jan. 2004.
[30] I. H. Witten, E. Frank, and M. A. Hall, Data Mining: Practical Machine Learning Tools and Techniques, Third Edition, 3rd ed. Morgan Kaufmann, 2011.
[31] V. L. Simoens and S. Hébert, ‘Cortisol suppression and hearing thresholds in tinnitus after low-dose dexamethasone challenge’, BMC Ear, Nose and Throat Disorders, vol. 12, no. 1, p. 4, Mar. 2012.