Metrics in Evaluating Software Defects
Chen-Huei Chou
School of Business College of Charleston
Charleston, SC, USA
ABSTRACT
Due to the popularity of mobile devices and increasing demands of software applications, more and more individual developers join this industry. However, software defects top at the cost of software development. Software metrics are able to show some indication of software defect. This paper reviews popular static code and object-oriented metrics and summarizes heuristics for using the metrics. Correlations between software defect and metrics are presented. Finally, advantages and disadvantages of metrics are discussed.According to the summary of correlation analyses, some metricsshow inconsistent relationships with software defect. Implications to practice and research are provided.
Keywords
Software defect, software metrics, static code metrics, object-oriented metrics.
1.
INTRODUCTION
The demand of software development is getting stronger year after year. Specifically, due to the prevalence of mobile devices such as smartphones and tablets, the need of mobile applicationsis unimaginable. For example, 35 billion of Apps have been downloaded from Apple, Inc. and the company has paid more than $6.5 million dollars to the developers[26]. The cost, both time and money, for software development is normally high. Jim Johnson, a chairman of a research companyThe Standish Group, stated that “faulty software costs businesses $78 billion per year”[18].Most of the mobile applications such as Apps for Apple’s iOS devices are developed by individuals. The cost could be easily underestimated. Among the costs on software development, software defects usually top at the cost of software development.
Software defects can be measured in two ways: defect density and failure density[4]. Defect density shows the total number of defects found in every thousand lines of program source code. Failure density indicates the total number of detected failures per thousand lines of code. In order to detect software defects, software metrics are normally used. In the literature, not all software metrics are found to be related to software defect. However, there is a limited amount of studies focusing on summarizing both static code and object oriented metrics in relations to software defect. This paper attempts to review popular static code and object oriented metrics, to highlight highly correlated metrics with software defect, to summarize heuristic values for using these metrics, and to offer pros and cons of these metrics.
The rest of the paper is organized as follows.Popular static code metricsare first discussed in the second section and then object oriented metrics in the third section. In the fourth section, summary of heuristics, correlations between metrics and software defect, and advantages and disadvantages of the
metrics are provided. Finally,implications to practice and research are provided.
2.
STATIC CODE METRICS
2.1
Source Lines of Code (SLOC)
SLOC is one of the oldest static code metrics for evaluating software defects. Akiyama [6] established an estimated regression relating lines of code LOC and defect DEF:
LOC DEF4.860.018
Based on this regression equation, it is expected to see about 41 software defects when the SLOC of the software program is 2,000. Park [23] further defined physical SLOC that it includes executable lines, declarations, compiler directives, and empty lines. Comments are excluded in counting physical SLOC. Logical SLOC was defined similarly to exclude begin and end symbols that delimit (sub)program bodies, then, else, otherwise symbols, etc. Bhatt et al. [8]defined executable physical LOC as the total LOC minus blank and comment lines. The executable logical LOC was defined as the number of statements that is executed. When the size of SLOC is larger, it is harder to understand and maintain the software program. Also, it is more prone to defect.O’Neill [22] suggested that it would take an hour to inspect 250 to 500 lines of code during new development and 1000 to 1500 lines of code during maintenance stage.
2.2
Comment Percentage (CP)
The CP is defined as a ratio of the number of comment lines to the number of non-blank LOC [19]. Software development life cycle is normally long. In any stage of the life cycle, comments will help developers and maintainers to better understand the programs. Higher comment percentages will increase understandability and maintainability[27]. It is suggested to maintain at least 8% on comment percentage to enhance the understandability [21].
2.3
Halstead Metrics
Halstead Metrics [16] is one of the earliest software program metrics using operators and operands to describe the complexity of software. At that time, most programs are procedural and each source code of the programs is stored in a single file. However, Halstead Metrics can be used to measure modern programs written in C, C++, and Java. When evaluating software programs using Halstead Metrics, programs’vocabulary, size, volume, difficulty, effort, errors, and testing time can be obtained.
Four key parameters are prepared in the source code level: n1,
n2, N1, and N2, where
n1 is the number of distinct operators; n2 is the number of
distinct operands; N1 is the number of operator instances;
The vocabulary n is the total number of distinct operators and distinct operands n1 + n2. The size of the program N is the
total number of operator instances and operand instances N1 +
N2. The volume of the program Vis Nlog2n. The difficulty
D to write or understand a program is 2
2 1 2 n
N n
. Effort E can be measured by VD . The number of delivered bugs
(defects)B can be estimated by 3000
3 2
E
. More recently, when
estimating the number of delivered bugs in object oriented
programs, 3000
V
is used instead. Also, time needed to write a
program is related to effort E and can be estimated by 18
E
seconds.
In order to lower the chance of software defects, McCabe Software [21] suggested to limit the size of program N to 300, the volume V to 1500, difficult D to 30, effort E to 300,and estimated bugs B to 0.6.
2.4
McCabe Cyclomatic Complexity (CC)
McCabe Cyclomatic Complexity metric[20], based on a directed graph, is to quantify the complexity of a software program. The Cyclomatic Complexity is computed as follows:
P N E
Complexity Cyclomatic
where
Eis the number of edges of the graph; Nis the number of nodes of the graph; Pis the number of connected components.
A high value of Cyclomatic Complexity indicates high complexity of a program which is harder to understand, test, modify, and maintain. In order to reduce the risk of software development, it is suggested to limit the Cyclomatic Complexity to 10[33]. Based on different level of risks, Foreman et al. [14] suggested different threshold values of Cyclomatic Complexity when evaluating the risk of a software program. When the Cyclomatic Complexity is less than or equal to 10, the program is simple and the risk is low. The program is more complex and it is considered moderate risk when the Cyclomatic Complexity is between 11 and 20. For a complex program, the Cyclomatic Complexity is between 21 and 50 and the risk is high. The value of Cyclomatic Complexity greater than 50 indicates that a program becomes untestable and the risk is very high.
3.
OBJECT-ORIENTED METRICS
3.1
Chidamber & Kemerer (CK) Metrics
Suite
Although Halstead Metrics can be used in object-oriented programs, it does not cover important aspects of object oriented programming such as inheritance, coupling, etc. The CK metrics suite is designed for measuring object-oriented programs [13]. The suite includes six metrics discussed as follows.
3.1.1
Weighted Method per Class (WMC)
The WMC indicates the total complexity of an object-oriented class, measured by the number of methods defined in the class when all methods’ complexity are considered unity.
n
i i
C W MC
0
, where n is the number of methods in a class and Ci is the complexity of class.
In software development, it is suggested to have smalleramount of methods rather than larger amount of methods. Smaller amount of methods will reduce program complexity and increase readability of program [15].
3.1.2
Depth of Inheritance Tree (DIT)
Assuming that class inheritance in object-oriented programming can be described as a hierarchical tree, a class in the lower level of the three has more methods and variables to inherit from its upper level of classes. The DIT indicates the maximum length from a class to its root class, which is the depth of the hierarchy. The larger the DIT, the higher the level of inheritance is. Cartwright and Shepperd[12] found that DIT is related to the defect density of classes.
3.1.3
Number of Children (NOC)
NOC shows the number of immediate sub-classes derived from a base class. The NOC represents the width of the class hierarchy. High value of NOC indicates high reuse of the base class.If the base class is thoroughly tested, high reuse of the base class could reduce the chance of defect. However, in the software defect literature, there is no conclusive result relating the NOC to defect (see summary of studies in Table 2 discussed later). NOC was found to be positively, negative, or none related with software defect in those studies.
3.1.4
Coupling between Object Classes (CBO)
Coupling is defined as “the measure of the strength of association established by a connection from one module to another”[30].CBO measures the interdependence of two classes. Coupling between two classes happens when one class uses methods or variables defined by another class. It is harder for another program to reuse the highly coupled classes in a program due to the complexity. When coupling between classes is high, it would be more time consuming for programmers to clearly understand the codes and make further changes.Sahraoui et al. [25] suggested to avoid CBO values above 14.3.1.5
Response for a Class (RFC)
RFC is defined as “a set of methods that can potentially be executed in response to a message received by an object of that class”[13].RFC indicates the number of methods in the response set of the class. Prior studies (e.g. [29, 36])found that high value of RFC is associated with software defect. When RFC is high, the classes are more complex and hard to understand, test, and even debug. A low RFC, therefore, is preferred.
3.1.6
Lack of Cohesion (LCOM)
value of LOCM is preferred. LCOM was found to be a significant measure indicating software defects[5, 29, 35, 36].
3.2
Metrics for Object-Oriented Design
(MOOD)
Abreuand Carapuça[1] proposed a set of metrics called Metrics for Object Oriented Design (MOOD) to measure object-oriented programs, meeting the following criteria:
metrics determination should be formallydefined
non-size metrics should be system sizeindependent
metrics should be dimensionless or expressed in some consistent unit system
metrics should be obtainable early in thelife-cycle
metrics should be down-scalable
metrics should be easily computable.
metrics should be language independent.
A set of six metrics were suggested as follows.
3.2.1
Method Hiding Factor (MHF)
MHF is to measure the ratio of the sum of the invisibilities of all methods in all classes to the total number ofall methods. Invisibility of a method indicates a ratio of total invisible classes to the number of classes, excluding itself.
MHF is defined as
TC
i d i
TC i C M m mi C M M V i d 1 1 ) ( 1 ) ( ) ( 1 ( , where ) ( i d C
M is total number of methods defined,TC is the total number of classes in the program, V(Mmi)is the visibility of the method Mmi.V(Mmi)is prepared using
1 ) , ( _ ) ( 1
TC C M visible is M V TCi mi j
mi and 0 call may 1 ) , ( _ otherwise M C i j iff C M visible
is mi j j mi
In object oriented programming, an interface of an object is created to include a group of methods without implementing the behavior of methods. The interface is visible to the whole program. However, the implementation of the interface is hidden to itself. MHF is 0 when all methods are public. When all methods are private, the MHF is 1. MHF was found to be moderately and negatively correlated with defect density[4]. Defect density would decrease when MHF increases. However, higher MHF shows limited functionality since most methods are specific and hard for reuse, which is contradicting to the spirit of object-oriented programming advocating object reuse.
3.2.2
Attribute Hiding Factor (AHF)
AHF is very similar to MHF, while AHF measures the invisibilities of attributes defined and MHF indicates the invisibilities of methods defined. AHF follows the ratio of the sum of the invisibilities of all methods in all classes to the total number of all methods. AHF can be calculated by
TC
i d i
TC i C A m mi C A A V i d 1 1 ) ( 1 ) ( ) ( 1 ( ,
whereAd(Ci)is total number of attributes defined, TC is the total number of classes in the program, V(Ami)is the visibility of the method Ami. V(Ami)is
prepared using 1 ) , ( _ ) ( 1
TC C A visible is A V TCi mi j
mi and 0 reference may 1 ) , ( _ otherwise A C i j iff C A visible
is mi j j mi
A minimum value of AHF is 0, happened when all attributes are publicly declared. If all attributes are hidden and only accessible by their corresponding methods, AHF is 1. However, AHF was found not influencing software quality[4].
3.2.3
Coupling Factor (CF)
Similar to the CBO in Chidamber & Kemerer Metrics, CF is a measure for coupling of classes. CF represents a ratio of non-inherence couplings to maximum possible couplings. The possible value of CF ranges from 0 (no classes are coupled) to 1 (all classes are coupled to all other classes).Abreuand Carapuça [1] suggested that CF should be below 0.52. It is found that CF is highly correlated with software defect density [4].
3.2.4
Method Inheritance Factor (MIF)
MIF measures the ratio of total number of inherited methods in all classes to the total number of available methods for all
classes. It is defined as
TC
i a i
TC
i i i
C M C M 1 1 ) ( ) ( ,
where Ma(Ci)Md(Ci)Mi(Ci), Md(Ci)is total number of methods defined in class Ciand Mi(Ci)is total number of
inherited methods in class Ci. A high MIF indicates a large
portion of methods in a class were inherited from parent classes. When a class defines more of its own methods, the MIF is getting lower.It is suggested to keep the MIF between 0.25 and 0.37 [1].
3.2.5
Attribute Inheritance Factor (AIF)
AIF is very similar to MIF while AIF is a measure for inherited attributes and MIF is a measure for inherited methods.AIF indicates the ratio of total number of inherited attributes in all classes to the total number of available
attributes in all classes. AIF is prepared as
TC
i a i
TC
i i i
C A C A 1 1 ) ( ) ( ,
where Aa(Ci)Ad(Ci)Ai(Ci), Ad(Ci)is total number of attributes defined in class Ci and Ai(Ci)is total number of
inherited attributes in class Ci. The AIF was found to be
negatively correlated with software defect [4].
3.2.6
Polymorphism Factor (PF)
Polymorphism is an object-oriented programming principle which allows message passing with different implementations. PF is to measure the ratio of the total number of overriding methods in all classes to the sum of maximum number of possible distinct polymorphic situations in all classes. When a larger amount of methods are overridden in derived classes, the PF increases.It is more or less conclusive to keep PF lower than 0.1[2, 3, 4, 17].
4.
SUMMARY OF METRICS
Correlations between software defect and software metrics are discussed in the subsection 4.2. Finally, the advantages and disadvantages of the software metrics are discussed in subsection 4.3.
4.1
Heuristics of Metrics
Table 1 shows the heuristics of metrics suggested in the literature.The abbreviations of metrics, used in prior sections, are applied in the first column of Table 1. Second column includes the heuristic of the corresponding metric in the first column. The third column reports their source studies. In the literature, heuristics were provided to most of metrics discussed in the paper except Depth of Inheritance Tree, Number of Children, and Lack of Cohesion from CK metrics suite. Although different values were suggested from different studies, Cyclomatic Complexity, Weighted Method per Class, Coupling between Object Classes, Response for a Class, and Polymorphism Factor received similar recommended values. Because of the design of metrics in MOOD suite, the values range from 0 to 1. However, prior experimental studies failed to offer a consistent range of values for five out of six MOOD metrics.
Table 1.Summary of heuristic values for using software metrics
Metric Value Study
Source Linesof Code
Inspection speed of 250-500 lines per hour during new development and 1000-1500 lines per hour during maintenance
O’Neill 1996 [22]
Comment Percentage
≥8% to enhance understandability
McCabe Software 2012 [21]
Halsted SizeN
≤300 McCabe Software 2012 [21]
Halsted Volume V
≤1500 McCabe Software 2012 [21]
Halsted Difficult D
≤30 McCabe Software 2012 [21]
Halsted Effort E
≤300 McCabe Software 2012 [21]
Halsted Estimated Bugs B
≤0.6 McCabe Software 2012 [21]
Cyclomatic Complexity
≤10 ≤10 low risk 11-20 moderate risk 21-50 high risk >50 very high risk
Watson et al. 1996 [33] Foreman et al. 1997 [14]
CK WMC 100(risk prob.=.1) 5 (risk prob.=.06) 46 (risk prob.=.075) 98 (risk prob.=.10)
Rosenberg 1997 [24] Shatnawi 2010 [28]
CK DIT N/A N/A CK NOC N/A N/A CK CBO 5(risk prob.=.06)
≤ 14
6 (risk prob.=.06) 16 (risk prob.=.075) 29 (risk prob.=.10)
Rosenberg 1997 [24] Sahraoui et al. 2000 [25]
Shatnawi 2010 [28]
CK RFC 100(risk prob.=.08) 17 (risk prob.=.06)
Rosenberg 1997 [24] Shatnawi 2010 [28]
80 (risk prob.=.075) 164 (risk prob.=.10) CK LCOM N/A N/A MOOD
MHF
0.154≤MHF≤ 0.387** 0.077≤ MHF≤0.254*
Abreu et al. 1996 [2] Harrison et al. 1998 [17]
MOOD AHF
0.192≤ AHF≤0.355** 0.44≤AHF≤0.675*
Abreu et al. 1996 [2] Harrison et al. 1998 [17]
MOOD CF <0.52
0.013 ≤CF≤ 0.055** 0.031 ≤ CF ≤ 0.063*
Abreuand Carapuça 1994 [1]
Abreu et al. 1996 [2] Harrison et al. 1998 [17]
MOOD MIF
0.25≤MIF≤0.52
0.606≤MIF≤0.771** 0.143≤MIF≤0.455*
Abreuand Carapuça1994 [1] Abreu et al. 1996 [2] Harrison et al. 1998 [17]
MOOD AIF
0.633≤AIF≤0.815** 0.113≤AIF≤0.468*
Abreu et al. 1996 [2] Harrison et al. 1998 [17]
MOOD PF 0.03≤PF≤0.12* 0.053≤PF≤0.108** ≤ 0.1
0.029≤PF≤0.089*
Abreu et al. 1995 [3] Abreu et al. 1996 [2] Abreu and Melo 1996 [4]
Harrison et al. 1998 [17]
* indicates findings from experimental results ** indicates a 90% confidence interval of estimations
4.2
Software Defect and Metrics
The software metrics,no matter static code metrics or object-oriented metrics, covered in this study are not all highly correlated with software defect. This section summarizes the findings in the literature and organizes the results in Table 2. Metrics are included in the first column. The second column shows the relationships between metrics and a commonly used software defect variable—defect density. The third column reports the corresponding studies.
In CK suite, consistent relationships were identified between defect and metrics (Weighted Method per Class, Response for a Class, and Lack of Cohesion). However, inconsistent relationships were identified between defect and the rest of three metrics (Depth of Inheritance Tree, Number of Children, Coupling between Object Classes). AHF was the only metric found in MOOD suite not correlated with defect.
Table 2.Summary of correlation analyses between software defect and software metrics
Metric Correlation
with Defect Study
Source Lines of Code
+ + (High) +: C++ + (High): Java + (High) + (High)
Akiyama 1971 [6] Briand et al. 2000 [9] Subramanyamet al. 2003 [31] Subramanyamet al. 2003 [31] Yu et al. 2002 [35]
Zhou and Leung 2006 [36] CK WMC +
+ + + (High) + +: C++ N/C: Java
[image:4.595.316.546.70.370.2] [image:4.595.55.284.346.780.2] [image:4.595.317.541.610.770.2]+ + (High) + (High)
Tang et al. 1999 [32] Yu et al. 2002 [35] Zhou and Leung 2006 [36] CK DIT N/C
+ (High) + (High) − +
+ − N/C N/C N/C
Aggarwal et al. 2009 [5] Basili et al. 1996 [7] Briand et al. 2000 [9] Briand et al. 2001 [11] Cartwright and Shepperd 2000 [12]
Shatnawi and Li 2008 [29] Subramanyamet al. 2003 [31] Tang et al. 1999[32] Yu et al. 2002 [35] Zhou and Leung 2006 [36] CK NOC N/C
− (High) − N/C − N/C + − (High)
Aggarwal et al. 2009 [5] Basili et al. 1996 [7] Briand et al. 2000[9] Briand et al. 2001 [11] Shatnawi and Li 2008 [29] Tang et al. 1999 [32] Yu et al. 2002 [35] Zhou and Leung 2006 [36] CK CBO +
+ + (High) + (High) + (High) + +: C++
−: Java N/C + + (High)
Aggarwal et al. 2009 [5] Basili et al. 1996 [7] Briand et al. 2000 [9] Briand et al. 1999 [10] Briand et al. 2001[11] Shatnawi and Li 2008 [29] Subramanyamet al. 2003 [31] Subramanyamet al. 2003 [31] Tang et al. 1999 [32] Yu et al. 2002 [35] Zhou and Leung 2006 [36] CK RFC +
+ (High) + + (High) + (High) + + + + (High)
Aggarwal et al. 2009 [5] Basili et al. 1996 [7] Briand et al. 2000 [9] Briand et al. 1999 [10] Briand et al. 2001 [11] Shatnawi and Li 2008 [29] Tang et al. 1999 [32] Yu et al. 2002 [35] Zhou and Leung 2006 [36] CK
LCOM + + + +
Aggarwal et al. 2009 [5] Shatnawi and Li 2008 [29] Yu et al. 2002 [35] Zhou and Leung 2006 [36] MOOD
MHF
− (Moderate) Abreu and Melo 1996 [4]
MOOD AHF
N/C Abreu and Melo 1996 [4]
MOOD CF
+ (Very high) Abreu and Melo 1996 [4]
MOOD MIF
− (Moderate) Abreu and Melo 1996 [4]
MOOD AIF
− (Low) Abreu and Melo 1996 [4]
MOOD PF
− (High) Abreu and Melo 1996 [4]
Note: + means positive correlation; − means negative correlation; N/C means not correlated
4.3
Advantages and Disadvantages of
Metrics
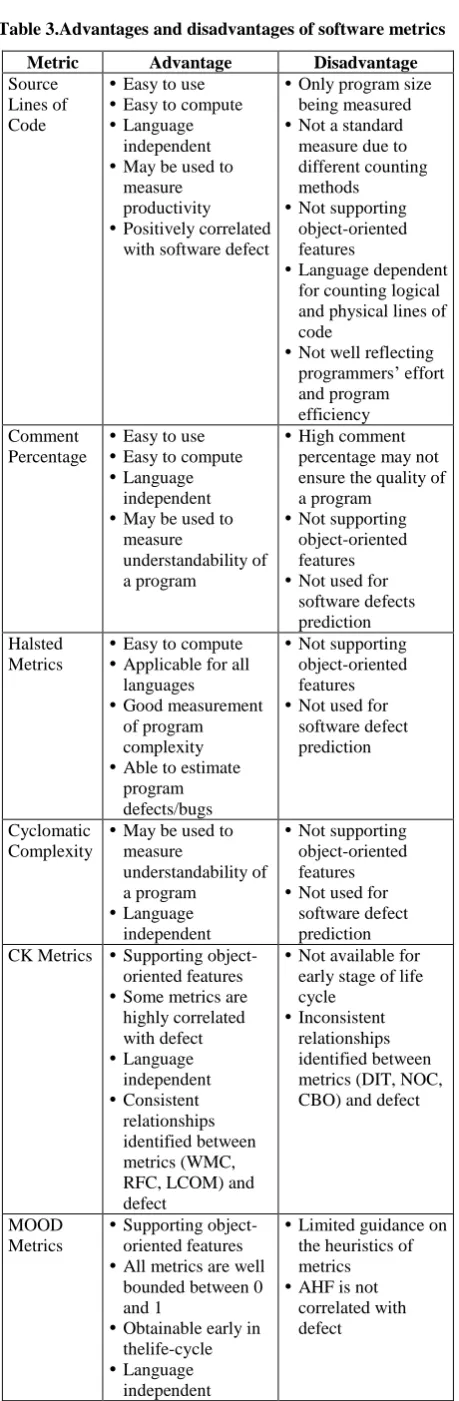
[image:5.595.317.547.63.765.2]Based on the features and functionalities of the software metrics discussed in this paper, the pros and cons of software metrics are provided in Table 3.
Table 3.Advantages and disadvantages of software metrics
Metric Advantage Disadvantage
Source Lines of Code
Easy to use
Easy to compute
Language independent
May be used to measure productivity
Positively correlated with software defect
Only program size being measured
Not a standard measure due to different counting methods
Not supporting object-oriented features
Language dependent for counting logical and physical lines of code
Not well reflecting programmers’ effort and program efficiency Comment
Percentage
Easy to use
Easy to compute
Language independent
May be used to measure
understandability of a program
High comment percentage may not ensure the quality of a program
Not supporting object-oriented features
Not used for software defects prediction Halsted
Metrics
Easy to compute
Applicable for all languages
Good measurement of program complexity
Able to estimate program defects/bugs
Not supporting object-oriented features
Not used for software defect prediction
Cyclomatic Complexity
May be used to measure
understandability of a program
Language independent
Not supporting object-oriented features
Not used for software defect prediction CK Metrics Supporting
object-oriented features
Some metrics are highly correlated with defect
Language independent
Consistent relationships identified between metrics (WMC, RFC, LCOM) and defect
Not available for early stage of life cycle
Inconsistent relationships identified between metrics (DIT, NOC, CBO) and defect
MOOD Metrics
Supporting object-oriented features
All metrics are well bounded between 0 and 1
Obtainable early in thelife-cycle
Language independent
Limited guidance on the heuristics of metrics
5.
CONCLUSIONS AND
IMPLICATIONS
Based on the summary of heuristics using metrics and correlations between software defect and metrics, some consistency and inconsistency were identified.Next, the potential implications of this paper for practice as well as research are discussed.
5.1
Implication for practice
There are severalimplications for practice, especially for software developers and project managers. Some metrics were found to be highly correlated with software defect. When conducting software development projects, some of the metrics can be easily prepared even during early development life cycle. Based on their suggested values, projects can be better managed and controlled.
5.2
Implication for research
Due to the inconsistent findings of some metrics relating to software defect, future studies could systematically validate these metrics using different projects in different scales. Different programming languages may have different impacts on the use of metrics. Future studies can compare and contrast the same projects written in different languages or for different platforms. Mobile applications could be one of the best candidates since the same application may be prepared using different programming languages and target to different platforms such as iOS, Android, Microsoft Windows Phone, etc.
6.
REFERENCES
[1] Abreu, F. B. and Carapuça, R. 1994. Object-oriented software engineering: Measuring and controlling the development process. InProceedings of the 4th International Conference on Software Quality.
[2] Abreu, F. B., Esteves, R., and Goulão, M. 1996. The design of Eiffel programs: Quantitative evaluation using the mood metrics. In Proceedings of TOOLS’96, Santa Barbara, California, USA.
[3] Abreu, F. B., Goulão, M., and Esteves, R. 1995. Toward the design quality evaluation of object-oriented software systems. In Proceedings of the 5th International Conference on Software Quality, Austin, Texas, USA,pp. 44-57.
[4] Abreu, F. B.and Melo, W. 1996. Evaluating the impact of object-oriented design on software quality. In Proceedings of the 3rd InternationalSoftware Metrics Symposium. pp. 90-99.
[5] Aggarwal, K. K., Singh, Y., Kaur, A., and Malhotra, R. 2009. Empirical analysis for investigating the effect of object‐oriented metrics on fault proneness: a replicated case study. Software Process: Improvement and Practice, Vol. 14, No. 1, pp. 39-62.
[6] Akiyama, F. 1971. An example of software system debugging. Information Processing, Vol. 71 No. 1, pp. 353-379.
[7] Basili, V. R., Briand, L. C., and Melo, W. L. 1996. A validation of object-oriented design metrics as quality indicators. IEEE Transactions on Software Engineering, Vol. 22, No. 10, pp. 751-761.
[8] Bhatt, K., Tarey, V., and Patel, P. 2012. Analysis Of Source Lines Of Code(SLOC) Metric, International
Journal of Emerging Technology and Advanced Engineering, Vol. 2, No. 5, pp. 150-154.
[9] Briand, L. C., Wüst, J., Daly, J. W., and Porter, D. V.2000. Exploring the relationships between design measures and software quality in object-oriented systems. Journal of Systems and Software, Vol. 51, No. 3, pp. 245-273.
[10]Briand, L. C., Wüst, J., Ikonomovski, S. V., and Lounis, H. 1999. Investigating quality factors in object-oriented designs: an industrial case study. In Proceedings of the 21st international Conference on Software Engineering, pp. 345-354.
[11]Briand, L. C., Wüst, J., and Lounis, H. 2001. Replicated case studies for investigating quality factors in object-oriented designs. Empirical Software Engineering, Vol. 6, No. 1, pp. 11-58.
[12]Cartwright,M. and Shepperd, M. 2000.An Empirical Investigation ofan Object-Oriented Software System,”
IEEE Transactions on Software Engineering, Vol. 26, No. 7, pp. 786-796.
[13]Chidamber, S. R. and Kemerer, C. F. 1994. A Metrics Suite for Object Oriented Design, IEEE Transactions on Software Engineering, Vol. 20, No. 6, pp. 476–493. [14]Foreman, J., Gross, J., Rosenstein, R., Fisher, D., and
Brune, K. 1997. C4 Software Technology Reference Guide: A Prototype (CMU/SEI-97-HB-001). Retrieved December 14, 2012, from the Software Engineering Institute, Carnegie Mellon University website: http://www.sei.cmu.edu/library/abstracts/reports/97hb00 1.cfm
[15]Fowler, M., Beck, K., Brant, J., Opdyke, W., and Roberts, D. 1999. Refactoring: Improving the Design of Existing Code. Reading, Massachusetts: Addison Wesley.
[16]Halstead, M. H. 1977. Elements of Software Science, New York: Elsevier North-Holland.
[17]Harrison, R., Counsell, S. J., and Nithi, R. V. 1998. An evaluation of the MOOD set of object-oriented software metrics. IEEE Transactions onSoftware Engineering, Vol. 24, No. 6, pp. 491-496.
[18]Johnson, J. 2001. Let’s Stop Wasting $78 Billion per Year. CIO Magazine.
[19]Lorenz, M.and Kidd, J. 1994. Object-oriented software metrics: a practical guide. Prentice-Hall, Inc.
[20]McCabe, T. J. 1976. A Complexity Measure, IEEE Transactions on Software Engineering, Vol. 2, No. 4, pp. 308-320.
[21]McCabe Software. 2012. Metrics & Thresholds in McCabe IQ. Available at: http://www.mccabe.com/pdf/McCabe%20IQ%20Metrics .pdf
[22]O’Neill, D. 1996. National Software Quality Experiment Results 1992-1996. In Proceedings of the Eighth Annual Software Technology Conference. pp. 21-26.
University website: http://www.sei.cmu.edu/library/abstracts/reports/92tr020. cfm
[24]Rosenberg, L. 1997. Metrics for Object-Oriented Environment, In Proceedings of EFAITP/AIE Third Annual Software Metrics Conference.
[25]Sahraoui, H. A., Godin, R., and Miceli, T. 2000. Can Metrics Help to Bridge the Gap Between the Improvement of OO Design Quality and Its Automation?, in Proceedings of 16th IEEE International Conference on Software Maintenance.
[26]Sloan, P. 2012. Apple by the numbers: 35B apps downloaded, 100M iPads sold. CNET. Available at: http://news.cnet.com/8301-13579_3-57537667-37/apple-by-the-numbers-35b-apps-downloaded-100m-ipads-sold/
[27]Sharble, R. C. and Cohen, S. S.1993. The Object Oriented Brewery: A Comparison of Twoobject oriented Development Methods, ACM SIGSOFT Software Engineering Notes, Vol. 18, No. 2., pp. 60 -73.
[28]Shatnawi, R. 2010. A quantitative investigation of the acceptable risk levels of object-oriented metrics in open-source systems. IEEE Transactions on Software Engineering, Vol. 36, No. 2, pp. 216-225.
[29]Shatnawi, R. and Li, W. 2008. The effectiveness of software metrics in identifying error-prone classes in post-release software evolution process.Journal of Systems and Software, Vol. 81, No. 11, pp. 1868-1882.
[30]Stevens, W. P., Myers, G. J., and Constantine, L. L. 1974. Structured design.IBM Systems Journal, Vol. 13, No. 2, pp. 115-139.
[31]Subramanyam, R., and Krishnan, M. S. 2003. Empirical analysis of CK metrics for object-oriented design complexity: Implications for software defects. IEEE Transactions on Software Engineering, Vol. 29, No. 4, pp. 297-310.
[32]Tang, M. H., Kao, M. H., and Chen, M. H. 1999. An empirical study on object-oriented metrics. In
Proceedings of Sixth International Software Metrics Symposium, pp. 242-249
[33]Watson, A. H., McCabe, T. J., and Wallace, D. R. 1996. Structured testing: A testing methodology using the cyclomatic complexity metric. National Institute of Standards and TechnologySpecial Publication 500-235. [34]Yourdon, E., and Constantine, L. L. 1979. Structured
design: fundamentals of a discipline of computer program and systems design. Prentice-Hall, Inc.. [35]Yu, P., Systa, T., and Muller, H. 2002. Predicting
fault-proneness using OO metrics. An industrial case study. In
Proceedings of Sixth European Conference on Software Maintenance and Reengineering, pp. 99-107.