Control of an Actuator DC Energy-saving Dedicated to
the Electric Traction
Moez Hadj Kacem
Laboratory of Electronic andInformation Technology (LETI-Sfax) Tunisia
Souhir Tounsi
Laboratory of Electronic andInformation Technology (LETI-Sfax) Tunisia
Rafik Neji
Laboratory of Electronic and Information Technology
(LETI-Sfax) Tunisia
ABSTRACT
The electric vehicle (Ve) is struck by their low autonomy. To remedy this problem, we opted for the choice of a converter structure in electromagnetic switch, since it has no power dissipation in switching and conduction
.
The development of a control law of motorization continues saving energy and its implementation under the environment of MATLAB / SIMULINK, led to the scientific results of high level.
Keywords
electric vehicle, the DC motor (MCC), converter, design, analysis, finite element electromagnetic switch control.
Nomenclature
I Current in permanent regim Ecu Thickness of the copper layer Lsp Average length of one turn Ns Number of winding spire Sd Main section of a tooth Sc Section of the wire Ld Width of the tooth
Bc Maximal flux density in the ferro-magnetic core Bd Flux density in the left and right teeth
Bcs Flux density in the yoke µ0 Air permeability
µr Copper relative permeability Hd Height of the tooth
ρ Copper resistivity
Ub Amplitude of the switched voltage feeding the winding
Dco Maximal opening of the ferro-magnetic core xt Displacement of the ferro-magnetic core Hcu Height of the winding
Ldc Distance separating the winding and the right tooth
Eb Length of the main tooth
V Displacement speed of the ferro-magnetic core
Mt Mass of the mobile core Ke electric constan Ra winding resistance ia Armature current
La The inductance of the armature winding
1.
INTRODUCTION
In light of high oil crises and atmospheric pollution in recent decades, vehicle electrification becomes a topical project. But the production of electric vehicles in large volumes is still hampered by their low autonomy and their relatively high cost.
Naturally, the MCC are driven at varying speed through a chopper IGBT leading to several problems [1] which include the floating potential, the tail current, the lath-up and static and dynamic problem [2] of losses. These problems lead to complications of the control circuit and to the requirement in most cases of the integration of a cooling system of the chopper. That’s why we chose a structure of a converter to electromagnetic switches leading to the suppression of all these problems. The directive in an analytical model for sizing this type of switch is developed in conjunction with a validation study of complementarity and the finite element method.
The study of dynamic behavior of the engine showed that the switching frequency is low, which led us to integrate a low gear reduction ratio to reduce the frequency of magnetization of the engine, to solve the problem of compatibility of the type of switch in the overall system[3]. We also present a control strategy MCC saving energy. Indeed, when the VE operates in high acceleration regime (regime starts), the motor absorbs a strong current[4], since the forward drive of the carcass demand a high torque. To solve this problem leading to a high energy consumption, we chose to impose an increase of the excitation current proportional to an increase in dielectric constant at this operating regime. This control technology (Overfluxing) significantly reduces energy consumption. At high speeds, the electric constant is reduced to a value that ensures a maximum speed of 80km/h.
2.
STRUCTURE OF THE STATIC
CONVERTER
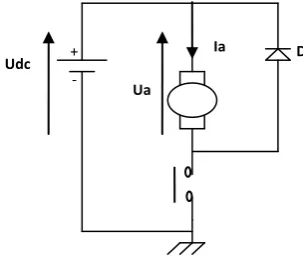
Fig 1: Structure diagram of the converter
The choice of this structure is justified by the fact. That a single switch that switches to the opening and closing and a single diode, which promotes the substantial absence of power dissipation [5]. Most of this structure has the advantage of relatively low cost compared to the structures of four-quadrant choppers.
2.1
Model
The converter model for electromagnetic switch is presented in the following figure [2]:
Fig 2: Converter model for electromagnetic switch
2.2
Principle of operation
This structure is composed by a mechanical contact normally closed S Fig3. The supply of the coil by a sufficient current causes attraction of the rod by induction phenomenon, and subsequently the change of state of the switch S. The de-excitation of the coil leads to the cancellation of the force of attraction of the rod, allowing the switch to return to its initial state.
Fig 3: Arm of the static converter with electromagnetic switches
3.
MODELING OF THE
ELECTROMAGNETIC SWITCH
The design parameters of the winding generation are illustrated in figure 4 [2].
Fig 4: Design parameters
3.1
Electrical and geometrical parameters
modeling
The flux density in the copper when the kernel is closed ferromagnetic, is deducted from the application of theorem amps:
The thickness of the ferromagnetic core is derived from the application of the theorem of conservation of flow:
The thickness of the cylinder head is expressed by the following relationship:
The winding resistance is expressed as follows:
The winding resistance of protection used to limit the winding current to the maximum current supported by the
winding Lb:
The expression of the inductor winding.
2 s
ec 0 r
cu
N I
B
2 E
ec d
ti
c
B L
L
2 B
ec d
cs
cs
B L
E
2 B
s sp
bob
c
N L
R
S
d
2 cu b
b 0 s
cu co t lc dc
S
H E
2
L N
2 E D x E L
+ Ia
Ua
Udc
-
D
Copper layer
S
Spring
Movable rod
Coil
Culass
e
E
lcD
coE
cuH
dL
dcL
dgL
ddL
dL
tiE
c(1)
(2)
(3)
(4)
[image:2.595.315.556.135.291.2]3.2
Modeling the force of attraction of
ferromagnetic core
The attractive force of drift based on ferro-magnetic energy stored in the winding:
This energy is transformed into mechanical energy of the core face ferromagnetic:
Hence the force of attraction is deduced from the following relationship:
3.3
Validation of finite element analysis
model
The length of the coil of production is important, which reduces the three-dimensional effects, resulting in the maintaining of a two-dimensional model. Indeed, the model is made with measurements taken from the analytical calculation and is simulated for different static positions of
the ferromagnetic core.
The distribution of field lines is shown in Figure 5:
Fig 5: The distribution of the field lines
FIG 6 illustrates the evolution of the inductance value for different positions of the ferromagnetic core, calculated by the analytical method and finite element method:
Fig 6: Inductance value for different positions of ferro-magnetic core
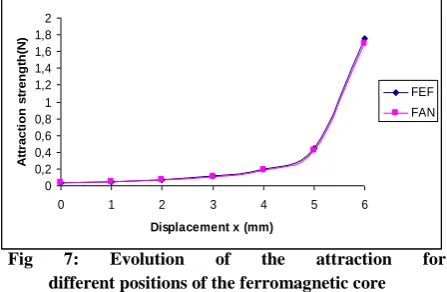
This face shows that the two curves are combined, thus validating the analytical approach to modeling inductance. Figure 7 shows the evolution of the attraction force for different positions of the ferromagnetic core calculated by the analytical method and the finite element method:
Fig 7: Evolution of the attraction for
different positions of the ferromagnetic core
This face shows that the two curves are combined, thus validating the analytical modeling approach to the production of fully winding.
4.
CONTROL OF THE DC MOTOR
ENERGY SAVING TRACTION
4.1
Traction motor
The equation of electrical model of a DC motor is given by the following relationship:
t
E
dt
di
L
i
R
U
a aa a a
a
The induced electromotive force of the motor is expressed by the following relationship:
e
a
t
K
E
The electromagnetic torque developed by the motor is given by the following relationship:
a e
em
K
i
C
4.2
Model of converter
The signal for adjusting the supply voltage of the motor [6] so that the latter can develop the torque necessary to move the VE, is compared with a pointed triangular frequency much lower than the frequency of opening and closing of the electromagnetic switch . This comparison attack a living hysteresis between 0 and the DC bus voltage Udc set for our application at 100 V in order to act on the pulse width of the control signals for adjusting the amplitude of current required to achieve a value of the electromagnetic torque sufficient to move the VE at the desired speed. The delay in opening the closure is modeled for the following transfer function:
2
b b
1
W L I
2
2 b t
t
dL dx
1
F V I
2 dx dt
2 b
t
dL 1
F I
2 dx
(6)
(7)
(8)
0 0,1 0,2 0,3 0,4 0,5 0,6
0 1 2 3 4 5 6
Displacement x (mm)
Ind
uc
ta
nc
e
(
m
H
)
LEF
LAN
0 0,2 0,4 0,6 0,8 1 1,2 1,4 1,6 1,8 2
0 1 2 3 4 5 6
Displacement x (mm)
A
tt
ra
c
ti
on
s
tr
e
ng
th(
N
)
FEF FAN
(9)
(10)
[image:3.595.314.538.139.285.2] [image:3.595.55.276.438.540.2]Ua 1 1
Tr .s+1
Sigale triagulaire : MLI
Relay Siganle de contrôle
1
Controlleur de surfluxage
Ke 1 ou Ke 2 1
Switch Ke2
0.5 Ke1 0.35
Clock2
Controlleur de surfluxage
Vitesse de consigne 50
Switch
Signale triangulaire
Régulateur de vitesse
Vref
Vrep Signale de contrôle
Product 1
Modèle du moteur Ua
Ke1 ou Ke2
Ea Cem
Modèle du convertisseur
Sc
Sm Ua
Ke2 0.5 Ke1 0.35
Equation de mouvement du véhicule électrique 1
Cem V(Km/h)
Wm
Clock2 S
T 1
1 )
s ( Ft
s
Where Ts =Ton=Toff = 0.0047 s : Time of delay in closing and opening.
The model of static converter implanted under the MATLAB Environment / SUMULINK is illustrated by the following figure: deduced from Ampere's theorem:
Fig 8: Model of converter
4.3
Equation of motion of the
The equation that governs the movement of VE is derived from the fundamental relation of dynamics [7, 8, 9]:
v
C
C
r
dt
dV
M
v
d
em
RWhere Mv is the mass of VE, rd is the reduction ratio of gear box and CR (V) is the resistive torque of the carcass:
sin
2
2
R
f
M
g
R
M
C
S
V
R
M
g
V
C
vr f
x va r V r r R
Where is the angle between the road with the horizontal and Mva is the density of air, Cx is the coefficient of air penetration, Sf is the front surface of the VE, fr is the coefficient of resistance turnover and g is the acceleration due to gravity (with g = 9.8 Nm).
4.4
Equation of motion of the
Following a simulation at an average speed of EV, we set the start time or the electromagnetic torque and high (high current) to 685.
During the interval when the engine is running a scheme, we imposed a constant electric Ke larger than the constant for operation outside this regime [10].
Fig 9:Controller Overfluxing.
Or 85 s is the startup time Si t < 85 s
Ke
0
.
85
Si t
85 sKe
0
.
35
And Ts is the delay time or the engine runs
4.5
Model of the global energy chain
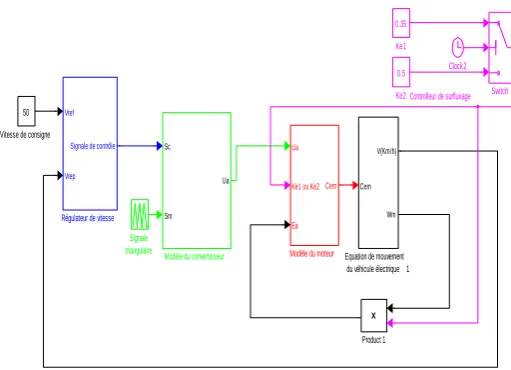
[image:4.595.57.271.176.285.2]The coupling of different models leads to the overall architecture of the power chain model implanted under the environment of MATLAB / SIMULINK following:
Fig 10:Model of the global chain of power EVs.
4.6
Descriptions of simulation results
Simulation results implanted under the environment of MATLAB / SIMULINK are:
4.6.1
And reference
speeds of response:
From the characteristic speed of response to a power line model without integrated controller Overfluxing we set the starting time to 85 s, according to the figure below:
Fig 11: And reference speeds of response
(12)
(13)
(14)
0 10 20 30 40 50 60 70 80 90 100 -10
0 10 20 30 40 50 60 70
Temps (s)
V
ite
ss
es
(
km
/h
)
Vitesse de référence Vitesse de réponse
t
dReference speeds Response speeds
sprates
Time (s)
S
p
ee
d
s
Ti
me
(
[image:4.595.303.559.233.418.2] [image:4.595.302.550.551.729.2]4.6.2
Currents with and without overfluxing:
Fig 12: Currents with and without Overfluxing
This figure illustrates that the starting current undergoes a significant decrease with the controller Overfluxing, leading to reduced energy consumption of VEs.
4.6.3
Couples with and without Overfluxing:
Fig 13: Couples with and without electromagnetic Overfluxing.
[image:5.595.315.534.161.343.2]4.6.4
Powers with and without Overfluxing
Fig 14: Powers with and without Overfluxing
This power is much lower for a chain with power controller Overfluxing.
4.6.5
Energy consumed with and without
Overfluxing
The energy consumed is calculated from the relationship as follows:
dt
P
W
co
co
Fig 15: Energy consumption with and without Overfluxing.
The average value of this energy is without controller Overfluxing WCOM = 0.3444 Kw.h
It is much lower for a chain with power controller Overfluxing WCOM = 0.1080 Kw.h
4.6.6
Speed with and without Overfluxing
:
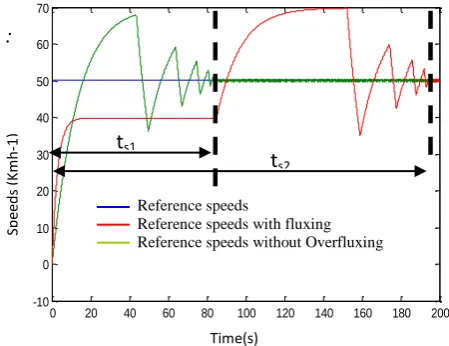
Fig 16: Speed with and without Overfluxing
Where ts1 is time to speed stability without Overfluxing and ts2 is the time to speed stability with Overfluxing:
ts2> t s1.
The drawback of the integration of a system Overfluxing Start is the importance of the stability time Overfluxing with speed relative to that without Overfluxing.
0 10 20 30 40 50 60 70 80 90 100 -200 -100 0 100 200 300 400 500 Temps (s) C o u p le s ( N .m )
Couple électromagnétique sans surfluxage Couple électromagnétique avec surfluxage
(15)
0 10 20 30 40 50 60 70 80 90 100
-400 -300 -200 -100 0 100 200 300 400 500 C o u ra n ts ( A ) Temps (s)
Courant sans surfluxage Courant sans surfluxage
Area
overfluxin
g
Zone de
surfluxage
Currents with Overfluxing Currents without Overfluxing
Time(s) C ur re nt s (A )
0 10 20 30 40 50 60 70 80 90 100 0 0.1 0.2 0.3 0.4 0.5 0.6 0.7 Temps (s) E n e rg ie s ( k .w .h )
Energie cosommée sans surfluxage Energie cosommée avec surfluxage
Energy consumed with fluxing Energy consumed without
Overfluxing Ene rg y ( kwh) Time(s)
0 20 40 60 80 100 120 140 160 180 200
-10 0 10 20 30 40 50 60 70 Temps (s) V it e s s e s ( k m /h )
Vitesse de référence
Vitesse de réponse sans surfluxage Vitesse de réponse avec surfluxage
t
s1t
s2Reference speeds
Reference speeds with fluxing Reference speeds without Overfluxing
Time(s) Spe eds ( Km h -1)
0 10 20 30 40 50 60 70 80 90 100
-10 0 10 20 30 40 50 Temps (s) P u is s a n c e s ( k w )
Puissance sans surfluxage Puissance avec surfluxage
Powers with fluxing Powers without Overfluxing
Time(s) P o we rs (Kw )
Couples with electromagnetic Overfluxing Couples without electromagnetic Overfluxing
[image:5.595.313.538.464.637.2]5.
CONCLUSION
In this paper, we presented a systematic design methodology of a static converter with electromagnetic switches, dedicated to electric traction. This study succeeded in defining the parameters of manufacturing and control of the converter structure.
Our work has focused on the modeling and the development of a control law continues the engine chosen, reducing energy consumption and eventually leading to increased autonomy factor for the production of VEs in large series.
We presented a control strategy saving energy. This strategy is based on Overfluxing the DC motor during hard acceleration phase to reduce the current drawn by the motor. In this context, a chain model power, taking into account this technique, is implanted under the Environment MATLAB / SIMULINK.
Simulation results found are very encouraging. Perspective to this work as it will be very interesting in this integrated control laws and take into account the recovery of energy during phases of strong deceleration.
REFERENCES
[1] A. AMMOUS, B. ALLARD, H. MOREL: “Transient Temperature Measurements and Modeling of the IGBT under short circuit”. IEEE Transactions Electronics, vol. 13, No. 1, 1998,p.12-25.
[2] S. TOUNSI, M.Hadj KACEM, R.NEJ: Design of Static Converter for Electric Traction” International Review of Electrical Engineering, IRE MOS Vol.3, N°6.
[3] C. Houda ,B.Boumedyen,AM. Naceur, “Applikation of the forecasting parameters Horizon Moving in Diagnosis of broken bars in induction motor”, 2012 International Conference on Computer Application and System Modeling. Vol 50 – N°17.
[4] H. Yoshida, K. Kawata, Y. Fukuyama, S. Takayama, Y. Nakinishi: “ A particle swarm optimization for reactive power and voltage control Considering safety assessment of tension”, IEEE Transactions on Power Systems, 15 (2000) pp 1232-1239.
[7] S. Tounsi, R. NEJI, F. SELLAMI: “Design of a radial engine for permanent magnet flux electric vehicle”. EPE 2003 (10th European Conference on Power Electronics and Applications), 2-4 September in Toulouse-France, CD: PP151.
[6] Blaabjerg, F., Consoli, A., Ferreira, juge, et Wyk JD 2005 "The future of electronic power and conversion", IEEE Transaction on Power Electronics, vol. 20, p. 715-720. 20, pp. 715-715-720.
[5] A .Mukhtiar, A. Larik Mohammad,R .Aslam Uqaili “Performance Analysis and Design Intelligent Power Controller Soft switched half-bridge DC / DC Converter using neural networks”, 2012 International Conference on Computer Application and System Modeling. Vol 50 - No. 17.
[8] R. NEJI, S. TOUNSI, F. SELLAMI: “Optimization and Design for a permanent magnet motor radial flow for electric vehicles”. Journal of Electrical Systems (JES), 1-4 (2005 p. 1-47-68.Nvb2010.
[9] K. Jouiliand and K. Ben Salem “Controlling a DC Motor for the Electric Traction”. L.A memory in embedded system ISECS 2011.