Munich Personal RePEc Archive
Trade Policy Developments in Tanzania:
The Challenge of Global and Regional
Integration
Walkenhorst, Peter
World Bank
February 2005
Trade Policy Developments in Tanzania:
The Challenge of Global and Regional Integration
#
Peter Walkenhorst *
February 2005
ABSTRACT
Over the past two decades, Tanzania has embarked on a marked liberalization of its trade regime. The Government wants this reform process to continue and sees international integration at the global and regional level as a means to achieve higher economic efficiency, productivity and international competitiveness. This study reviews the trade policy situation in Tanzania and identifies a number of key issues and challenges for the country. In particular, the analysis describes the state of domestic trade policy, examines regional integration efforts, and identifies priorities for the attention of policy makers and international donors.
KEYWORDS
Trade, tariffs, effective rates of protection, regional integration, overlapping agreements
JEL CLASSIFICATION
F13; F14; F15; O24
#) This paper serves as a background document for the preparation of the “Tanzania: Diagnostic Trade Integration Study.” Dar Es Salam and Washington DC: Ministry of Industry and Trade and World Bank. The findings, interpretations, and conclusions expressed in this study are entirely those of the author. They do not necessarily represent the view of the World Bank, its Executive Directors, or the countries they represent.
Table of Contents
Executive Summary ... 3
1.
Background ... 4
2.
Domestic Trade Policies ... 5
2.1
Import Policies ... 7
2.2
Export Policies ... 13
2.3
Revenues from Trade Taxes ... 14
3.
Regional Trade Agreements ... 16
3.1
History of Regional Integration ... 16
3.2
Importance of Regional Trade ... 18
3.3
Economic Effects of Regional Initiatives ... 20
3.4
Overlapping Membership in Regional Agreements ... 23
4.
Recommendations for Policy Reform and Technical Assistance ... 25
EXECUTIVE SUMMARY
Over the past two decades, Tanzania has embarked on a marked liberalization of its trade regime. The Government wants this reform process to continue and sees international integration at the global and regional level as a means to achieve higher economic efficiency, productivity and international competitiveness. This study reviews the trade policy situation in Tanzania and identifies a number of key issues and challenges for the country. In particular, the analysis describes the state of domestic trade policy, examines regional integration efforts, and identifies priorities for the attention of policy makers and international donors.
Upon joining the East African Community (EAC) customs union in January 2005, Tanzania changed its import regime and adopted the EAC common external tariff. As a results, its listed average import duty rate fell moderately from 13.8 per cent to 12.3 per cent. The tariff regime continues to be escalatory and generates significant domestic market protection and anti-export bias. The scale and dispersion of policy-induced transfers distorts production incentives and makes it possible for a considerable number of value-subtracting firms to persist. The authorities should rebalance their trade incentives in order to increase the efficiency of the economy.
Export restrictions have been phased out for most products in the late 1990s. However, in 2003 the Government introduced a 15 per cent export tax on raw hides and skins to assist the struggling domestic tanning and leather industry by discouraging exports and making a larger number of domestically produced hides and skins available for local processing. Yet, given the importance of informal trade in hides and skins and world-wide experience with export restrictions, the success of this strategy is highly uncertain. The Government should critically assess the effectiveness of the restrictions with a view to phasing them out.
Tanzania has reduced its dependence on trade taxes as sources of government revenue through the introduction of value-added taxation. Import duties now account for less than 10 per cent of government income compared with more than a third in the mid-1990s. This development represents a major achievement that should be consolidated by further strengthening the domestic tax system, and thereby laying the foundation for deeper international integration of the economy.
Tanzania is committed to the process of regional integration and is pursuing closer ties with neighboring African nations. The country is engaged in two regional trade agreements (RTAs), namely the East African Community and the Southern African Development Community, and is considering to re-enter the Common Market for Eastern and Southern Africa, from which it withdrew in 2000. However, as regional trade is of only modest importance and external tariffs remain high, there is a considerable risk that regional agreements have a net trade-diverting and welfare-diminishing impact. In order to reduce this risk, Tanzania should push for reductions in the EAC‟s common external tariff and anchor its regional integration efforts firmly within a framework of multilateral liberalization, while leveraging cooperation at the regional level to tackle regulatory impediments to trade.
1. BACKGROUND
Over the past two decades, Tanzania has made significant progress in opening up its economy to international markets, but still does not fully exploit its potential to benefit from trade. In the mid-1980s, increasing supply shortages and a worsening balance of payments in the largely state-controlled economy contributed to triggering a fundamental change in economic and trade policy orientation. The previously pursued “policy of confinement” was abandoned and liberalization efforts were initiated. Restrictions on imports were gradually reduced, foreign exchange transactions were freed up, and the structure of tariffs was simplified. These reforms were reinforced and extended in the early 1990s when import bans for luxury goods and licensing requirements for exports were abolished and the private sector was granted permission to compete in the processing and marketing of cash crops. Moreover, since the late 1990s quantitative restrictions and taxes on most exports have been eliminated (World Bank, 2002) and progress has been made in liberalizing the financial, telecommunications, and transportation sectors (Musonda, Kweka and Kabelwa, 2004). Import tariffs were adjusted and gradually reduced on several occasions over time, most recently when Tanzania joined the East African Community (EAC) customs union in January 2005.
The marked liberalization of the trade regime is reflected in indicators of market openness, such as tariff rate averages. Tanzania‟s tariffs have fallen by more than 7 percentage points since the late 1990s. While other countries in Eastern and Southern Africa have liberalized in parallel, Tanzania‟s import duties have declined clearly below the regional average (Figure 1).
In February 2003, the Government explicitly laid out its future international integration strategy by publishing a comprehensive set of principles and objectives for trade policy making (United Republic of Tanzania, 2003). This National Trade Policy assigns a central role to trade as a means to achieve higher efficiency, productivity and international competitiveness. Moreover, export-led growth is identified as being instrumental for economic development and poverty eradication. To reap these benefits, further international integration efforts are envisaged.
In particular, the National Trade Policy lays down five specific objectives. These concern:
i. improvements in physical infrastructure and information dissemination;
ii. establishment of an integrated, diversified and competitive economy;
iii. stimulation of value-adding activities on primary export commodities;
iv. attraction of investment flows into sectors that have a comparative advantage; and
Figure 1: Simple tariff averages in Eastern and Southern Africa
(in per cent)
Note: The membership in the Common Market of Eastern and Southern Africa (COMESA), and the Southern African Development Community (SADC) overlaps.
Source: International Monetary Fund.
The following discussion reviews the trade policy situation in Tanzania in the context of these objectives and identifies a number of key issues and challenges for the country. The focus of the study is thereby on how trade taxes and quantitative restrictions affect the goods sector. The analysis falls into three parts. First, the state of domestic trade policy is described, with particular emphasis on the structure and economic effects of border policies. Then, Tanzania‟s regional integration efforts are examined, including a preliminary assessment of the impacts of the formation of the EAC customs union with Kenya and Uganda. And finally, some priorities for the attention of policy makers and international donors are identified based on the preceding analysis.
2. DOMESTIC TRADE POLICIES
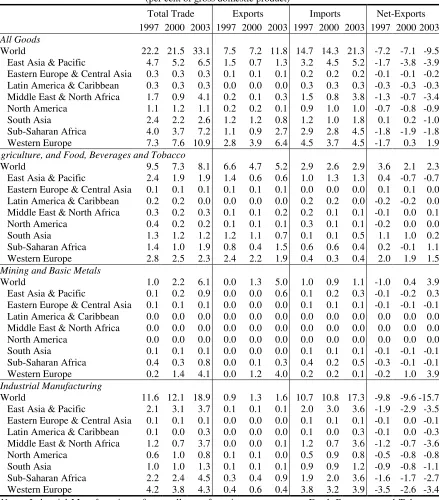
Tanzania‟s main trading partners are located in Western Europe, Sub-Saharan Africa and East Asia (Table 1). In 2003, these three regions accounted for almost 90 per cent of the country‟s exports and two-thirds of all imports. Trade relationships have intensified in particular with Sub-Saharan countries since the late 1990s, even though official statistics should be interpreted with care, as unrecorded transactions are important in the region.
10 15 20 25
1997 1998 1999 2000 2001 2002 2003 2004
Tanzania
COMESA countries (simple average)
Table 1: Structure of Tanzania’s Merchandise Trade
(per cent of gross domestic product)
Total Trade Exports Imports Net-Exports 1997 2000 2003 1997 2000 2003 1997 2000 2003 1997 2000 2003
All Goods
World 22.2 21.5 33.1 7.5 7.2 11.8 14.7 14.3 21.3 -7.2 -7.1 -9.5 East Asia & Pacific 4.7 5.2 6.5 1.5 0.7 1.3 3.2 4.5 5.2 -1.7 -3.8 -3.9 Eastern Europe & Central Asia 0.3 0.3 0.3 0.1 0.1 0.1 0.2 0.2 0.2 -0.1 -0.1 -0.2 Latin America & Caribbean 0.3 0.3 0.3 0.0 0.0 0.0 0.3 0.3 0.3 -0.3 -0.3 -0.3 Middle East & North Africa 1.7 0.9 4.1 0.2 0.1 0.3 1.5 0.8 3.8 -1.3 -0.7 -3.4 North America 1.1 1.2 1.1 0.2 0.2 0.1 0.9 1.0 1.0 -0.7 -0.8 -0.9 South Asia 2.4 2.2 2.6 1.2 1.2 0.8 1.2 1.0 1.8 0.1 0.2 -1.0 Sub-Saharan Africa 4.0 3.7 7.2 1.1 0.9 2.7 2.9 2.8 4.5 -1.8 -1.9 -1.8 Western Europe 7.3 7.6 10.9 2.8 3.9 6.4 4.5 3.7 4.5 -1.7 0.3 1.9
Agriculture, and Food, Beverages and Tobacco
World 9.5 7.3 8.1 6.6 4.7 5.2 2.9 2.6 2.9 3.6 2.1 2.3 East Asia & Pacific 2.4 1.9 1.9 1.4 0.6 0.6 1.0 1.3 1.3 0.4 -0.7 -0.7 Eastern Europe & Central Asia 0.1 0.1 0.1 0.1 0.1 0.1 0.0 0.0 0.0 0.1 0.1 0.0 Latin America & Caribbean 0.2 0.2 0.0 0.0 0.0 0.0 0.2 0.2 0.0 -0.2 -0.2 0.0 Middle East & North Africa 0.3 0.2 0.3 0.1 0.1 0.2 0.2 0.1 0.1 -0.1 0.0 0.1 North America 0.4 0.2 0.2 0.1 0.1 0.1 0.3 0.1 0.1 -0.2 0.0 0.0 South Asia 1.3 1.2 1.2 1.2 1.1 0.7 0.1 0.1 0.5 1.1 1.0 0.2 Sub-Saharan Africa 1.4 1.0 1.9 0.8 0.4 1.5 0.6 0.6 0.4 0.2 -0.1 1.1 Western Europe 2.8 2.5 2.3 2.4 2.2 1.9 0.4 0.3 0.4 2.0 1.9 1.5
Mining and Basic Metals
World 1.0 2.2 6.1 0.0 1.3 5.0 1.0 0.9 1.1 -1.0 0.4 3.9 East Asia & Pacific 0.1 0.2 0.9 0.0 0.0 0.6 0.1 0.2 0.3 -0.1 -0.2 0.3 Eastern Europe & Central Asia 0.1 0.1 0.1 0.0 0.0 0.0 0.1 0.1 0.1 -0.1 -0.1 -0.1 Latin America & Caribbean 0.0 0.0 0.0 0.0 0.0 0.0 0.0 0.0 0.0 0.0 0.0 0.0 Middle East & North Africa 0.0 0.0 0.0 0.0 0.0 0.0 0.0 0.0 0.0 0.0 0.0 0.0 North America 0.0 0.0 0.0 0.0 0.0 0.0 0.0 0.0 0.0 0.0 0.0 0.0 South Asia 0.1 0.1 0.1 0.0 0.0 0.0 0.1 0.1 0.1 -0.1 -0.1 -0.1 Sub-Saharan Africa 0.4 0.3 0.8 0.0 0.1 0.3 0.4 0.2 0.5 -0.3 -0.1 -0.1 Western Europe 0.2 1.4 4.1 0.0 1.2 4.0 0.2 0.2 0.1 -0.2 1.0 3.9
Industrial Manufacturing
World 11.6 12.1 18.9 0.9 1.3 1.6 10.7 10.8 17.3 -9.8 -9.6 -15.7 East Asia & Pacific 2.1 3.1 3.7 0.1 0.1 0.1 2.0 3.0 3.6 -1.9 -2.9 -3.5 Eastern Europe & Central Asia 0.1 0.1 0.1 0.0 0.0 0.0 0.1 0.1 0.1 -0.1 0.0 -0.1 Latin America & Caribbean 0.1 0.0 0.3 0.0 0.0 0.0 0.1 0.0 0.3 -0.1 0.0 -0.3 Middle East & North Africa 1.2 0.7 3.7 0.0 0.0 0.1 1.2 0.7 3.6 -1.2 -0.7 -3.6 North America 0.6 1.0 0.8 0.1 0.1 0.0 0.5 0.9 0.8 -0.5 -0.8 -0.8 South Asia 1.0 1.0 1.3 0.1 0.1 0.1 0.9 0.9 1.2 -0.9 -0.8 -1.1 Sub-Saharan Africa 2.2 2.4 4.5 0.3 0.4 0.9 1.9 2.0 3.6 -1.6 -1.7 -2.7 Western Europe 4.2 3.8 4.3 0.4 0.6 0.4 3.8 3.2 3.9 -3.5 -2.6 -3.4
Note: Industrial Manufacturing refers to all manufacturing sectors except Food, Beverages and Tobacco, and Basic Metals (ISIC revision 2 codes 31 and 37). Trade with non-specified countries is included in the World-total.
Source: World Bank Staff based on UN COMTRADE database accessed through WITS.
[image:7.612.90.529.106.606.2]Western Europe. On a sectoral basis, Tanzania has had a trade surplus for agricultural and mining products and related manufactures, but a large deficit for industrial manufactures.
2.1 Import Policies
Tanzania is a founding member of the World Trade Organization (WTO) and its trade policy is guided by adherence to WTO rights and obligations. Tanzania grants at least
most-favored-nation (MFN) treatment to its trading partners. All tariffs are ad valorem, and there are
no seasonal duties, tariff quotas, or variable levies. Tanzania has tariff bindings at a rate of 120 per cent on goods in 755 tariff lines, covering all agricultural goods and some manufactured products. Bound tariffs represent the maximum allowable tariffs that WTO members have scheduled as part of their commitments in the Uruguay Round of multilateral trade negotiations. Application of import duties above bound rates is not allowed, unless trading partners adversely affected by the tariff change are compensated.
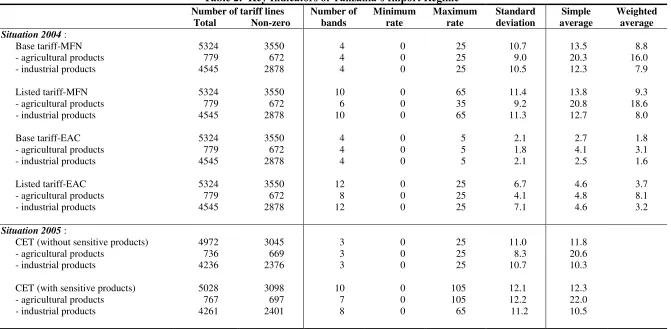
Yet, countries are free to apply import duties that are lower than their bindings, which is the case in Tanzania. The country‟s simple MFN-tariff average across all tariff lines was 13.5 per cent in 2004 and the import-weighted average amounted to 8.8 per cent (Table 2). The applied tariff structure is escalatory with four duty bands being employed in 2004, ranging from zero to 25 per cent. Capital goods and unprocessed materials could enter the country free of import duty, while tariffs of 10, 15, and 25 per cent, respectively, were charged on semi-processed inputs, fully processed inputs, and final consumer goods. Of the 5324 tariff lines, 3550 (or 67 per cent) were non-zero, with 2084 (39 per cent) being subject to the highest duty rate of 25 per cent. While duty exemptions for imports by central and local governments were abolished in July 2002, exemptions continued to be granted for projects financed by development partners, charitable organizations and entities with statutory exemptions or under bilateral agreements. Estimates put the value of duty exemptions in Tanzania at about 9 per cent of potential customs revenue (Castro, Kraus and de la Rocha, 2004).
In addition to the MFN-tariffs, Tanzania used to apply suspended duties to imports of
goods in 128 tariff lines until the end of 2004. Most of these surcharges were ad valorem levies,
while a few tariff lines were subject to specific duties. The additional import taxes were supposed to protect domestic industry from unfair competition until new legislation on anti-dumping and countervailing duties, which was enacted in April 2004, would be fully implemented. The highest suspended duty rate amounted to 40 per cent, bringing the peak applied tariff rate to 65 per cent (25 per cent MFN-tariff plus 40 per cent suspended duty). Moreover, minimum dutiable values of USD 390 per metric ton applied to imports of sugar.
Table 2: Key Indicators of Tanzania’s Import Regime
Number of tariff lines Number of bands
Minimum rate
Maximum rate
Standard deviation
Simple average
Weighted average Total Non-zero
Situation 2004 :
Base tariff-MFN 5324 3550 4 0 25 10.7 13.5 8.8
- agricultural products 779 672 4 0 25 9.0 20.3 16.0
- industrial products 4545 2878 4 0 25 10.5 12.3 7.9
Listed tariff-MFN 5324 3550 10 0 65 11.4 13.8 9.3
- agricultural products 779 672 6 0 35 9.2 20.8 18.6
- industrial products 4545 2878 10 0 65 11.3 12.7 8.0
Base tariff-EAC 5324 3550 4 0 5 2.1 2.7 1.8
- agricultural products 779 672 4 0 5 1.8 4.1 3.1
- industrial products 4545 2878 4 0 5 2.1 2.5 1.6
Listed tariff-EAC 5324 3550 12 0 25 6.7 4.6 3.7
- agricultural products 779 672 8 0 25 4.1 4.8 8.1
- industrial products 4545 2878 12 0 25 7.1 4.6 3.2
Situation 2005 :
CET (without sensitive products) 4972 3045 3 0 25 11.0 11.8
- agricultural products 736 669 3 0 25 8.3 20.6
- industrial products 4236 2376 3 0 25 10.7 10.3
CET (with sensitive products) 5028 3098 10 0 105 12.1 12.3
- agricultural products 767 697 7 0 105 12.2 22.0
- industrial products 4261 2401 8 0 65 11.2 10.5
Note: Listed tariffs are import duty plus suspended duty. Agricultural products are those in HS 01-24, and industrial ones those in HS 25-99. Calculations are done at the 8-digit HS-level. Weighted tariffs are based on 2003 import data.
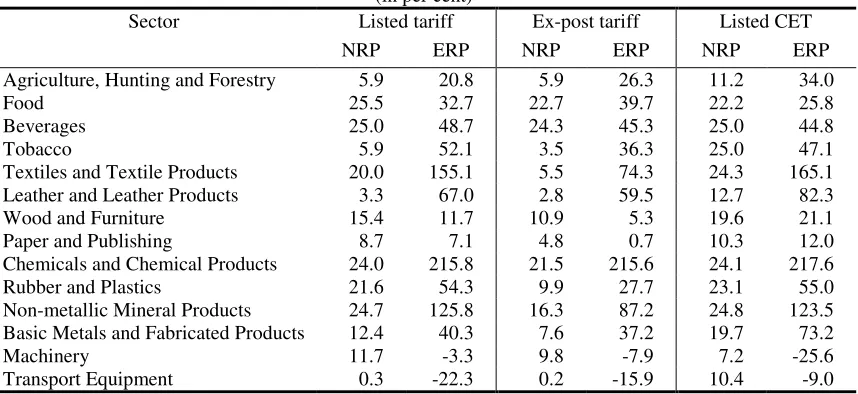
[image:9.792.71.742.99.428.2]The application of suspended duties and minimum dutiable values reduced the transparency of the import regime, accentuated the dispersion in the tariff structure, and led to more pronounced tariff escalation. The latter generates high effective rates of protection (ERPs) for producers that have access to inputs at low-tariff rates, while being able to shield behind high import barriers for their final products. By taking into account protection on both outputs and inputs, ERPs provide a better representation of tariff-generated transfers to producers than nominal rates of protection (NRPs), which are based on protection of outputs only. In some sectors in Tanzania, ERPs exceed NRPs substantially and reach levels of more than 100 per cent.
Also, ERPs show a larger variation across sectors than NRPs and range from –16 per cent for
[image:10.612.94.523.244.441.2]transport equipment to 216 per cent for chemicals (Table 3).
Table 3: Nominal and Effective Rates of Protection
(in per cent)
Sector Listed tariff Ex-post tariff Listed CET NRP ERP NRP ERP NRP ERP Agriculture, Hunting and Forestry 5.9 20.8 5.9 26.3 11.2 34.0
Food 25.5 32.7 22.7 39.7 22.2 25.8
Beverages 25.0 48.7 24.3 45.3 25.0 44.8
Tobacco 5.9 52.1 3.5 36.3 25.0 47.1
Textiles and Textile Products 20.0 155.1 5.5 74.3 24.3 165.1 Leather and Leather Products 3.3 67.0 2.8 59.5 12.7 82.3 Wood and Furniture 15.4 11.7 10.9 5.3 19.6 21.1 Paper and Publishing 8.7 7.1 4.8 0.7 10.3 12.0 Chemicals and Chemical Products 24.0 215.8 21.5 215.6 24.1 217.6 Rubber and Plastics 21.6 54.3 9.9 27.7 23.1 55.0 Non-metallic Mineral Products 24.7 125.8 16.3 87.2 24.8 123.5 Basic Metals and Fabricated Products 12.4 40.3 7.6 37.2 19.7 73.2
Machinery 11.7 -3.3 9.8 -7.9 7.2 -25.6
Transport Equipment 0.3 -22.3 0.2 -15.9 10.4 -9.0
Note: Listed tariffs are import duty plus suspended duty. Ex-post tariffs are average tariffs (i.e. customs receipts divided by cif import values). .
Source: Maxwell Stamp (2003).
Imports are subject to the same value-added and excise tax rates as domestically produced goods. Indeed, a large share of the excise duty revenues, which are charged at specific or ad valorem rates of up to 30 per cent, is derived from goods that are mainly imported, such as petroleum and cars. Also, the collection of value-added taxes is to a significant extent based on imports. In this context, the authorities should pay attention that not only the indirect tax rates but also the intensity and yield of tax collection is similar for imported and domestic products. Otherwise, the indirect taxes could turn into implicit barriers to trade by raising the costs of imports relative to domestically produced goods.
complaints from companies that the duty refunds are delayed by several months or even years. In any case, since Tanzania can not influence world market prices, exporters do not receive the significant policy-generated transfers that producers for the domestic market obtain, thus biasing producers‟ decisions against selling abroad. Indeed, the higher the domestic market protection is, the stronger the anti-export bias becomes.
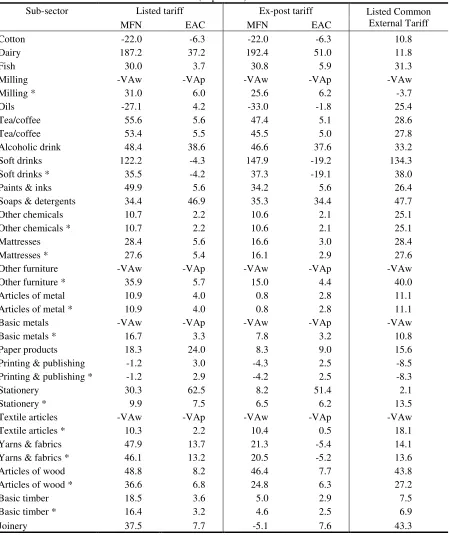
Yet, awareness among officials of the potentially adverse effects of protectionisms seems not always sufficient, which could lead to tolerance of costly resource misallocations. In a recent survey of 152 manufacturing enterprises, 24 firms were found to be value-subtracters (Maxwell Stamp, 2003). The value of their tradable production inputs at international prices exceeded the trade value of their final products. Because of the distorted domestic price structure, these companies were not necessarily loss-making and could, hence, continue to operate, although they were clearly representing a waste of resources for the economy overall. Results from a follow-up enterprise survey confirm the existence of value-subtractors in Tanzania and suggest that these highly inefficient firms are particularly prevalent in the milling, furniture, metals, and textiles sub-sectors (Table 4).
One characteristic of Tanzania‟s import policy that increases the risk of allowing value
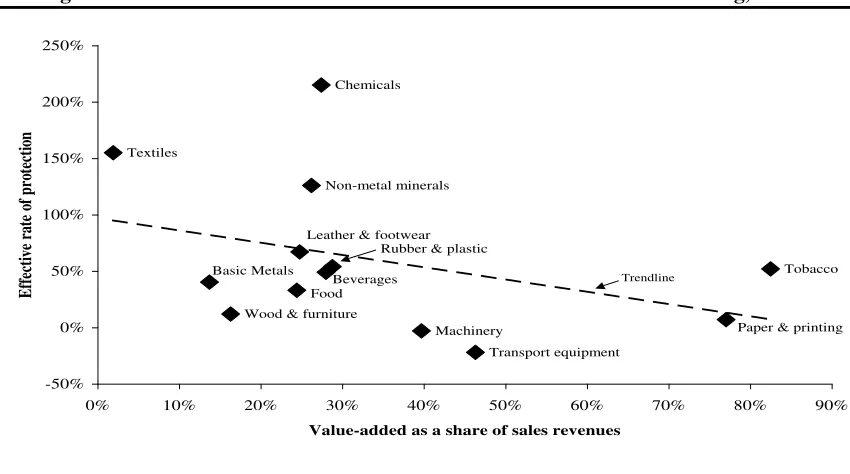
[image:11.612.96.521.461.698.2]-subtracters to persevere is that high market price support is granted to manufacturing branches with low value-added. Sectors like chemicals or textiles for which the share of value-added in sales revenue is relatively small receive strong market protection, while high value-added industries, like paper and publishing, machinery, and transport equipment, are not supported to a significant extent or even taxed through high tariffs on imported inputs (Figure 2). This structure of protection supports the survival of firms that are internationally uncompetitive and that generate little income to pay wages and income taxes, while imposing significant costs on the economy through high output prices. In this context, a rebalancing of trade incentives appears desirable with a view to initiating an efficiency-enhancing restructuring process in low value-added manufacturing branches and thus reducing the risk of policy-induced resource misallocations.
Figure 2: Effective Rates of Protection and Value-added in Manufacturing, 2002
Source: World Bank Staff based on Maxwell Stamp (2003) and National Bureau of Statistics (2003).
Textiles
Tobacco
Paper & printing Transport equipment
Machinery Chemicals
Non-metal minerals
Wood & furniture Basic Metals
Leather & footwear
Food Beverages
Rubber & plastic
-50% 0% 50% 100% 150% 200% 250%
0% 10% 20% 30% 40% 50% 60% 70% 80% 90%
Value-added as a share of sales revenues
Table 4: Effective Rates of Protection for Selected Sub-Sectors (in per cent)
Sub-sector Listed tariff Ex-post tariff Listed Common External Tariff
MFN EAC MFN EAC
Cotton -22.0 -6.3 -22.0 -6.3 10.8
Dairy 187.2 37.2 192.4 51.0 11.8
Fish 30.0 3.7 30.8 5.9 31.3
Milling -VAw -VAp -VAw -VAp -VAw
Milling * 31.0 6.0 25.6 6.2 -3.7
Oils -27.1 4.2 -33.0 -1.8 25.4
Tea/coffee 55.6 5.6 47.4 5.1 28.6
Tea/coffee 53.4 5.5 45.5 5.0 27.8
Alcoholic drink 48.4 38.6 46.6 37.6 33.2
Soft drinks 122.2 -4.3 147.9 -19.2 134.3
Soft drinks * 35.5 -4.2 37.3 -19.1 38.0
Paints & inks 49.9 5.6 34.2 5.6 26.4
Soaps & detergents 34.4 46.9 35.3 34.4 47.7
Other chemicals 10.7 2.2 10.6 2.1 25.1
Other chemicals * 10.7 2.2 10.6 2.1 25.1
Mattresses 28.4 5.6 16.6 3.0 28.4
Mattresses * 27.6 5.4 16.1 2.9 27.6
Other furniture -VAw -VAp -VAw -VAp -VAw
Other furniture * 35.9 5.7 15.0 4.4 40.0
Articles of metal 10.9 4.0 0.8 2.8 11.1
Articles of metal * 10.9 4.0 0.8 2.8 11.1
Basic metals -VAw -VAp -VAw -VAp -VAw
Basic metals * 16.7 3.3 7.8 3.2 10.8
Paper products 18.3 24.0 8.3 9.0 15.6
Printing & publishing -1.2 3.0 -4.3 2.5 -8.5 Printing & publishing * -1.2 2.9 -4.2 2.5 -8.3
Stationery 30.3 62.5 8.2 51.4 2.1
Stationery * 9.9 7.5 6.5 6.2 13.5
Textile articles -VAw -VAp -VAw -VAp -VAw Textile articles * 10.3 2.2 10.4 0.5 18.1 Yarns & fabrics 47.9 13.7 21.3 -5.4 14.1 Yarns & fabrics * 46.1 13.2 20.5 -5.2 13.6
Articles of wood 48.8 8.2 46.4 7.7 43.8
Articles of wood * 36.6 6.8 24.8 6.3 27.2
Basic timber 18.5 3.6 5.0 2.9 7.5
Basic timber * 16.4 3.2 4.6 2.5 6.9
Joinery 37.5 7.7 -5.1 7.6 43.3
Notes : 1) "*" means that enterprises with negative value added (at world or EAC prices) have been excluded. 2) "-VAw" means that sector value added is negative at world prices. 3) "-VAp" means that sector value added is negative at EAC prices. 4) "Tariff Protection" includes the excises and VAT payable upon import duties, but not on the values of the goods. 5) Listed tariffs are import duty plus suspended duty. 6) Ex-post tariffs are average tariffs (i.e. customs receipts divided by cif import values).
The sectors producing textiles and leather, and machinery and equipment display the strongest export orientation in terms of the share of domestic output that is sold abroad (Table 5). Given the high effective rates of protection for textiles and the resulting anti-export bias, the prominence of textiles exports might seem surprising, but a large share of these exports is sold in industrialized country markets under preferential access conditions. Moreover, exports are very volatile over time, so that the export to output ratios and export growth rates for particular manufacturing branches can change significantly from one year to the next. The indicators should, hence, be treated with care. Concerning import substitution, the sectors for non-metallic minerals, and food, beverages and tobacco have the largest domestic market shares, although import growth of non-metallic mineral has been strong since the late 1990s.
Table 5: Indicators of Trade Performance in the Manufacturing Sector
(in per cent) Ratio of imports
to apparent consumption, 2002
Ratio of exports to domestic output,
2002
Average annual growth of imports,
1997-03
Average annual growth of exports,
1997-03 Food, Beverages
and Tobacco 32 13 0.8 3.0
Textiles and
Leather 52 21 9.0 11.3
Wood and
Furniture 40 9 12.9 -1.7
Paper and
Publishing 40 1 6.4 11.3
Chemicals, Rubber
& Plastic 72 11 27.2 40.1
Non-Metallic
Minerals 24 10 14.2 5.9
Machinery and
Equipment 98 19 7.9 16.9
Source: World Bank Staff based on National Bureau of Statistics (2003) and UN COMTRADE database accessed through WITS.
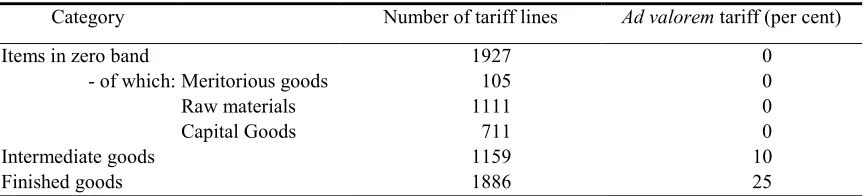
The agreed common external tariff has an escalatory three-band structure, with a zero rate for raw materials, capital goods, and meritorious goods, such as medical, pharmaceutical and educational supplies; a 10 per cent rate for intermediate goods, and a 25 per cent maximum rate for finished goods. The customs union protocol provides for a revision of the top rate five years after the customs union entered into force, and it is expected that the top rate will at that point be reduced to 20 per cent. Almost 40 per cent of all tariff lines are subject to the maximum rate (Table 6).
Table 6: The EAC Common External Tariff
Category Number of tariff lines Ad valorem tariff (per cent)
Items in zero band 1927 0
- of which: Meritorious goods 105 0
Raw materials 1111 0
Capital Goods 711 0
Intermediate goods 1159 10
Finished goods 1886 25
Source: World Bank Staff.
In the negotiations on the formation of the customs union, the three EAC partners agreed
on a list of 56 sensitive products to which “special tariffs” apply. For about a third of the
sensitive products, the special tariff rates are the same across the three countries, while for the other two-thirds different duty levels apply, representing a departure from the principle of a common external tariff. In Tanzania, special tariffs range from zero to 105 per cent, with the top rate applying to imports of sugar, which was up to the end of 2004 subject to minimum dutiable values.
As a result of the adoption of the common external tariff, the listed average duty rate fell from 13.8 per cent to 12.3 per cent. This reduction is due to lower industrial tariffs, while duties on agricultural imports actually increased on average. The tariff changes are modest in magnitude for most products and sectors, but estimates of ERPs under the customs union regime indicate that the dispersion of protection levels increased (Table 3), further augmenting the risk of resource misallocation.
2.2 Export Policies
Possible misdirection of resources could also become an issue with some measures that are applied to exports. By 1998, trade liberalization had resulted in the removal of requirements for export registration, licensing, and surrender of proceeds, as well as the elimination of most commodity export taxes. However, some non-governmental crop boards, such as the Cotton Development Fund and the Cashew Nuts Development Fund, continue to levy fees on their members‟ exports to finance research, extension services, and training (Baffes, 2004; Mitchell, 2004). Exporters of cotton and raw cashew nuts are required to pay a 3 per cent export charge, while processed cashews are subject to a 1 per cent levy.
Similarly, the Fisheries Department collects royalties on fish exports. Rates are set at
what is estimated to be 6 per cent of fob-value, but charged per kilogram rather than on an ad
Moreover, in 2003 the government introduced an export tax of 15 per cent on raw hides and skins, and established a Livestock Development Fund to administer the revenues from the duty. The principal aim of the measure is to assist the struggling domestic tanning and leather industry by discouraging exports of raw hides and skins and making a larger number of domestically produced hides and skins available for local processing. However, the success of this strategy is uncertain. A study on Tanzania‟s leather and footwear sectors found that one of the main reasons for the insufficient capacity utilization of domestic processing facilities was the poor quality of locally produced hides and skins (Kiruthu, 1999). More than half of total supply was considered to be unsuitable for processing. This deficiency is related to inadequate animal husbandry practices, prevalent livestock diseases, inappropriate slaughtering facilities, poor slaughtering practices, and deficient preservation techniques. Depressing the domestic price level through the imposition of export taxes will further reduce the value that farmers and slaughterhouse operators attribute to hides and skins and, hence, their incentives to produce high-quality raw materials for the tanning and leather industries.
Also, it is unclear to what extent the export taxes will succeed in discouraging exports of raw hides and skins rather than just enticing producers to trade informally. Tanzania has long land-borders that traders and their livestock can relatively easily cross. Indeed, the value of informal trade between Tanzania and its neighbors is significant (World Food Programme, 2004) and according to some estimates even exceeds the value of formal transactions (Ackello-Ogutu and Echessah, 1998). One indication that a large part of the trade in raw hides and skins might indeed have turned informal is that revenues from the export tax during July to December 2003
have amounted to less than 40 per cent of the government‟s target (Mramba, 2004).
Informal trade had also been undermining quantitative restrictions on trade in tea. Until March 2004, Tanzania operated a “special trading arrangement” for tea that involved an export ban on green leaf tea and import bans on black and packed tea in order to support the domestic
blending and packing industry. Yet despite the bans, “illegal” trade with neighboring countries
was estimated to reach a magnitude corresponding to about a third of the domestically consumed tea (Baffes, 2003).
Local taxes constitute another, although unintentional, policy impediment to exports (Booth and Kweka, 2004). Despite a directive form the Prime Minister‟s Office that district taxes should not exceed 5 per cent of the goods value, local authorities continue to levy charges at points of transit as well as original sale. For producers that are distant from export locations, the cumulative burden of the local taxes can be considerable and will, in combination with the high transport costs due to the poor state of freight infrastructure, tend to discourage export operations.
In general, export restrictions introduce costly distortions into the domestic economy and do most often fail to achieve their industrial development objectives. Similar to import restrictions, export bans and taxes encourage inefficient production and consumption patterns and an suboptimal resource allocation (Piermartini, 2004). Moreover, there are frequently adverse distributional impacts. If the export restrictions concern primary commodities, as in Tanzania, it is often poor smallholders that have to bear the bulk of the economic costs as prices for their produce are depressed.
2.3 Revenues from Trade Taxes
almost 40 per cent of the total tax revenue collected by the government (Figure 3), but the bulk of these import-related revenues came from non-discriminatory value-added and excise taxes, while the share of tariff revenues in total receipts amounted to less than 10 per cent. The ratio of duty revenues to total governmental receipts has thereby become one of the lowest among Eastern and Southern African countries (Khandelwal, 2004)
Figure 3: Share of Trade Taxes in Government Revenue, 2003/2004
Source: Ministry of Finance.
Comparing government revenues from import duties with the value of imports makes it
possible to determine the ex-post average tariff rate, which takes into account the reduced duties
on imports under preferential agreements, duty exemptions, and “leakage” due to weak customs control. If the average of the import duty revenues for 2002/03 and 2003/04 is related to the value of imports in 2003, the ex-post average tariff rate comes to 5.5 per cent. The corresponding average total ex-post burden of trade taxes on imports, including value-added and excise taxes, amounted to 23.3 per cent.
The formation of the customs union with Kenya and Uganda with the adoption of the common external tariff, the phase-out of intra-EAC tariffs and the abolishment of suspended duties will have an impact of fiscal revenues. The government expects that the overall effect will be positive and that additional revenues of TZS 1 138 million (USD 1.1 million, or 0.8 per cent of import duty revenues in 2003/04) will be generated during the fiscal year 2004/05 (Mramba, 2004). Other studies project modest revenue losses of 4.2 per cent of import duty revenues in Tanzania, with most of the revenue shortfalls being associated with imports of machinery and transport equipment, as well as food and live animals (Castro, Kraus and de la Rocha, 2004).
Import duties 9.4%
VAT on imports 21.7%
Excises on imports 8.4%
Income tax 25.1% VAT, domestic
15.9% Excises, domestic
6.4%
The implications for tariff revenues and the potential need to establish a compensation fund to stabilize government income in partner countries have been discussed extensively in the run-up to the formation of the customs union. Related concerns were particularly prominent in the public debate in Tanzania and Uganda. However, analysis of the likely impact of the implementation of the customs union showed that the short-term revenue losses were relatively evenly spread across partner countries, eliminating the need for a compensatory mechanism (Busse and Shams, 2003).
In case revenue losses occur, the fiscal shortfalls would best be addressed by improving
customs administration, border controls, and transit arrangements in order to reduce “unofficial
exemptions” and smuggling. If these measures are not sufficient, revenues from non -discriminatory excise taxes levied at equal rates on imports and domestic products and improvements in the yield of existing value-added taxes should be used to replace the forgone tariff revenues. A restructuring of the indirect tax system is, in any case, desirable, as deeper integration into the world trading system will tend to further reduce tariff revenues over time.
3. REGIONAL TRADE AGREEMENTS
Tanzania is committed to the process of regional integration and is pursuing closer ties with neighboring African nations. The country is engaged in two regional trade agreements (RTAs), namely the East African Community (EAC) and the Southern African Development Community (SADC), and is considering to re-enter the Common Market for Eastern and Southern Africa (COMESA), from which it withdrew in 2000. Moreover, Tanzania participates in the Regional Integration Facilitation Forum, and has a considerable number of bilateral trade agreements, even though the latter are not always thoroughly implemented (Kweka and Leyaro, 2004).
While the regional integration efforts are intended to harmonize economic policy and promote trade, their underlying motivation seems to have been mostly political rather than economic. SADC, in particular, has for a long time had a development approach to regional integration, stemming from the economic independence desires and political security needs of the Front Line States (Kritzinger-van Niekerk and Moreira, 2002). Similarly, the EAC has an agenda that spans far beyond trade and economic integration. Yet, given the low per capita incomes in Tanzania and the country‟s development needs, the economic impacts of the regional initiatives deserve the greatest attention of policy makers and international donors.
3.1 History of Regional Integration
East Africa has a long history of regional integration. Kenya and Uganda first formed a customs union in 1917, which the then Tanganyika joined in 1927. Subsequently, the three countries had close economic relationships in the East African High Commission (1948-1961), the East African Common Services Organisation (1961-1967), the East African Community (1967-1977), and the East African Co-operation (1993-1999). In November 1999, the Treaty for the establishment of the (new) East African Community was signed, and entered into force in July 2000.
completed, the EAC partners envisage further integration steps with the creation of a common market, a monetary union, and ultimately a political federation, although no time table has been established yet.
Tanzania is also an active member in SADC, which in 1992 grew out of the Southern
African Development Co-ordination Conference. SADC‟s Trade Protocol, which was signed in
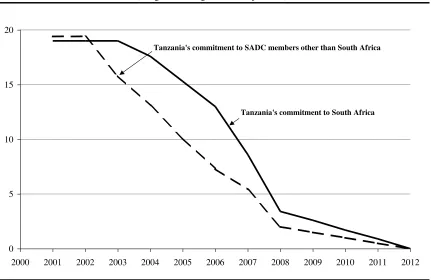
1996 and came into effect in October 2000, aims to remove intra-regional trade barriers and turn the Community into a free trade area for 85 per cent of goods by 2008, and for all goods by 2012.
Tariff reductions are asymmetrical, with domestic market protection vis-à-vis South Africa (and
indirectly the entire Southern African Customs Union area) staying in place for longer than
vis-à-vis other SADC countries (Figure 4). Plans for the formation of a customs union and a common
[image:18.612.94.525.265.545.2]market have been under discussion.
Figure 4: Tanzania’s Tariff Liberalization Commitments in SADC
(weighted average tariffs, in per cent)
Source: World Bank Staff based on Mushiri (2002).
Moreover, Tanzania used to be a member of COMESA, which had been founded in 1994. One of the main objectives of this regional initiative was to establish a free trade area, which was (partly) achieved in October 2000, when nine of COMESA‟s members removed their intra -regional trade barriers. A further integration step in the form of the establishment of a customs union, which had been planned for 2004, has been postponed, as the final structure of the common external tariff has yet to be agreed upon.
Tanzania is no longer a member of COMESA after leaving the Agreement in 2000. The withdrawal decision was based on an assessment that multiple RTA-membership was too resource-consuming and that Tanzania's regional integration interests were better served by its membership in SADC. Moreover, concerns about revenue losses as a result of ongoing
0 5 10 15 20
2000 2001 2002 2003 2004 2005 2006 2007 2008 2009 2010 2011 2012
COMESA tariff liberalization are also believed to have contributed to the decision (WTO, 2000). Yet, Tanzania continues to be influenced by trade policy developments in COMESA, not least because Kenya and Uganda, Tanzania‟s two partners in the EAC customs union, are both members of COMESA.
3.2 Importance of Regional Trade
Tanzania‟s trade relationships with other countries in the region have intensified in recent years, both in terms of the volume of trade and the scope of traded goods (Kweka and Mboya, 2004). However, according to official statistics, regional trade remains only of modest overall importance for the country. The eight countries with which Tanzania has land-borders have a combined population and gross domestic product that is five and four times, respectively, the size of Tanzania‟s. Yet, in 2003 these neighbors absorbed less than 14 per cent of Tanzanian exports and were the origin of less than eight per cent of the country‟s imports. The value of trade with
all African countries accounts for less than a quarter of Tanzania‟s total exports and imports
(Table 7). It should be noted, though, that these figures do not reflect underreported or informal trade.
Tanzania‟s most important regional export markets in 2003 were Kenya, Uganda, and South Africa, and the regional trading partners with the largest import share in the Tanzanian
market were South Africa, Kenya, and Swaziland. More than 90 per cent of Tanzania‟s regional
trade was undertaken with members of EAC or SADC, that is under terms of preferential market access. Tanzania lost preferential access to Burundi, Comoros, Djibouti, Egypt, Eritrea, Ethiopia, Madagascar, Rwanda, and Sudan when it left COMESA in 2000.
The Tanzanian authorities tried to negotiate bilateral agreements with the countries that are members of COMESA but not SADC in order to maintain the tariff preferences that had been achieved through earlier liberalization steps within COMESA. This attempt did succeed only with Tanzania‟s EAC partners, Kenya and Uganda, with whom the achieved preference margins were frozen. Preferential trade relations with the other COMESA-but-not-SADC members were discontinued. While trade with the “COMESA only” group of countries accounts for less than two per cent of Tanzania‟s total exports and imports (Table 7), Tanzania has consistently had a merchandise trade surplus with the group since 1997. Also, a relatively large share of the trade with “COMESA only” is in industrial goods, which motivates interest of industrial producers in
Tanzania in re-entering COMESA and obtaining better access to “COMESA only” markets
(Matambalya, 2004).
Table 7: Structure of Tanzania’s Merchandise Trade within the Region
(per cent of gross domestic product)
Total trade Exports Imports Net-Exports 1997 2000 2003 1997 2000 2003 1997 2000 2003 1997 2000 2003
All Goods
World 22.2 21.5 33.1 7.5 7.2 11.8 14.7 14.3 21.3 -7.2 -7.1 -9.5 - Africa 4.0 3.7 7.3 1.1 0.9 2.7 2.9 2.8 4.6 -1.8 -1.9 -1.8 - Members of EAC 1.7 1.1 2.5 0.4 0.4 1.3 1.3 0.7 1.2 -0.9 -0.3 0.1 SADC only 1.5 1.8 3.4 0.1 0.1 0.4 1.4 1.7 3.0 -1.3 -1.6 -2.6 SADC & COMESA 0.6 0.5 1.0 0.4 0.2 0.8 0.2 0.3 0.2 0.3 -0.1 0.6 COMESA only 0.2 0.2 0.3 0.2 0.1 0.2 0.0 0.1 0.1 0.1 0.0 0.1 - Other Africa 0.0 0.1 0.2 0.0 0.1 0.1 0.0 0.0 0.1 -0.0 0.0 0.0 - Rest of World 18.2 17.8 25.8 6.4 6.3 9.1 11.8 11.5 16.7 -3.6 -3.2 -5.8
Agriculture, and Food, Beverages and Tobacco
World 9.5 7.3 8.1 6.6 4.7 5.2 2.9 2.6 2.9 3.6 2.1 2.3 - Africa 1.4 1.1 1.9 0.8 0.5 1.5 0.6 0.6 0.4 0.2 -0.1 1.1 - Members of EAC 0.5 0.4 1.1 0.3 0.3 1.0 0.2 0.1 0.1 0.1 0.1 0.9 SADC only 0.4 0.3 0.3 0.1 0.0 0.1 0.3 0.3 0.2 -0.2 -0.2 -0.1 SADC & COMESA 0.3 0.3 0.3 0.3 0.1 0.3 0.0 0.2 0.0 0.3 -0.1 0.3 COMESA only 0.1 0.0 0.1 0.1 0.0 0.1 0.0 0.0 0.0 0.1 0.0 0.1 - Other Africa 0.0 0.1 0.1 0.0 0.1 0.1 0.0 0.0 0.0 0.0 0.1 0.1 - Rest of World 8.1 6.2 6.2 5.8 4.2 3.7 2.3 2 2.5 2.1 3.2 2.2
Minerals, and Base Metals
World 1.0 2.2 6.1 0.0 1.3 5.0 1.0 0.9 1.1 -1.0 0.4 3.9 - Africa 0.4 0.3 0.8 0.0 0.1 0.3 0.4 0.2 0.5 -0.3 -0.1 -0.1 - Members of EAC 0.2 0.1 0.2 0.0 0.0 0.1 0.2 0.1 0.1 -0.2 -0.1 0.0 SADC only 0.1 0.2 0.6 0.0 0.1 0.2 0.1 0.1 0.4 -0.1 -0.1 -0.1 SADC & COMESA 0.0 0.0 0.0 0.0 0.0 0.0 0.0 0.0 0.0 0.0 0.0 0.0 COMESA only 0.0 0.0 0.0 0.0 0.0 0.0 0.0 0.0 0.0 0.0 0.0 0.0 - Other Africa 0.0 0.0 0.0 0.0 0.0 0.0 0.0 0.0 0.0 0.0 0.0 0.0 - Rest of World 0.6 1.9 5.3 0 1.2 4.7 0.6 0.7 0.6 0.2 -0.3 0.7
Industrial Manufacturing *
World 11.6 12.1 18.9 0.9 1.3 1.6 10.7 10.8 17.3 -9.8 -9.6 -15.7 - Africa 2.3 2.4 4.6 0.3 0.4 0.9 2.0 2.0 3.7 -1.7 -1.7 -2.9 - Members of EAC 0.9 0.7 1.2 0.1 0.2 0.2 0.8 0.5 1.0 -0.7 -0.4 -0.7 SADC only 0.9 1.3 2.5 0.0 0.0 0.1 0.9 1.3 2.4 -0.9 -1.3 -2.3 SADC & COMESA 0.2 0.2 0.5 0.1 0.1 0.4 0.1 0.1 0.1 0.0 0.0 0.3 COMESA only 0.1 0.0 0.2 0.1 0.0 0.1 0.0 0.0 0.1 0.0 0.0 0.0 - Other Africa 0.0 0.0 0.1 0.0 0.0 0.0 0.0 0.0 0.1 0.0 0.0 0.0 - Rest of World 9.3 9.7 14.3 0.6 0.9 0.7 8.7 8.8 13.6 -6.5 -6.2 -10.0
Note: EAC trading partners are Kenya and Uganda; “SADC only” refers to Botswana, Lesotho, Mozambique, and South Africa; “SADC & COMESA” is the group comprising Angola, Democratic Republic of Congo, Namibia, Malawi, Mauritius, Seychelles, Swaziland, Zambia, and Zimbabwe; and “COMESA only” consists of Burundi, Comoros, Djibouti, Egypt, Eritrea, Ethiopia, Madagascar, Rwanda, and Sudan.
*) Industrial Manufacturing refers to all manufacturing sectors except Food, Beverages and Tobacco, and Basic Metals (ISIC rev. 2 codes 31 and 37).
[image:20.612.84.570.106.560.2]However, Tanzania‟s trade positions vis-à-vis its two EAC partners differ fundamentally. With regard to trade with Uganda, Tanzanian exports during 2003 exceeded the value of imports in all goods sectors, except for wood and chemical products (Table 8). The bilateral trade surplus amounted to almost 40 million USD. With Kenya, on the other hand, Tanzania had a trade deficit of almost similar size, as the value of its strong agricultural, fish and textiles exports was more than offset through Kenyan exports of industrial products into the Tanzanian market. In earlier years, Tanzania had a larger trade deficit with Kenya, while trade with Uganda was roughly in balance.
Table 8: Structure of Tanzania’s Trade with EAC Partners, 2003 („000 USD)
ISIC-2 Sector Kenya Uganda
Code Description Exports Imports Balance Exports Imports Balance 11 Agriculture and Hunting 18081 2719 15361 31599 1418 30181 12 Forestry and logging 87 3 84 31 0 31
13 Fishing 44532 8 44524 513 0 513
21 Coal Mining 2 5 -4 0 0 0
22 Crude Petroleum & Natural Gas 0 94 -94 0 0 0
23 Metal Ore Mining 0 1 -1 0 0 0
29 Other Mining 331 1152 -821 0 0 0
31 Food, Beverages and Tobacco 4554 7928 -3374 1094 278 815 32 Textiles and Leather 6575 2014 4561 775 80 695 33 Wood and Furniture 680 1540 -860 59 65 -6 34 Paper and Publishing 469 4377 -3908 288 123 165 35 Chemicals, Rubber and Plastic 3286 62795 -59509 4484 5814 -1330 36 Non-Metallic Minerals 137 3748 -3611 1024 50 974 37 Basic Metal Industries 801 8291 -7490 4373 31 4343 38 Machinery and Equipment 3409 20316 -16907 3819 349 3470
39-99 Other 421 1320 -899 47 2 44
0-99 Total 83363 116310 -32948 48104 8210 39895
Source: World Bank Staff based on UN COMTRADE database accessed through WITS.
3.3 Economic Effects of Regional Initiatives
Economic integration at the regional level can make it possible to reap benefits from international specialization, while tailoring the provisions of the agreement to the particular needs and adjustment capacities of the countries involved. In the short term, regional integration will entail adjustment needs, as prices on the domestic market change in response to tariff reforms.
Econometric analysis based on firm-level data suggests that the adoption of the EAC‟s common
[image:21.612.81.525.220.445.2]Table 9: Short-Term Impacts of the Adoption of the Common External Tariff in Tanzania
(in per cent)
Sector Price-Cost Margin Productivity Employment Wages
Agro-industry 0.31 0.65 -2.78 0.90
Chemicals and Paints 1.27 7.59 1.46 -0.72
Construction Materials 0.74 1.59 -0.88 2.87
Metals 0.33 -3.94 -5.69 4.33
Paper and Publishing 0.71 -10.49 -9.01 6.40
Textiles and Leather -0.21 -1.54 -1.91 0.47
Note: Calculations based on listed overall average tariffs.
Source: Rajhi and Webster (2004).
In the medium and longer term, there might be more pronounced impacts. If the reduction of intra-regional trade barriers fosters partner countries to expand output and exports of products for which they are internationally competitive, the price of final goods or production inputs on the importing country market falls to the benefit of consumers and input-purchasing producers. In this case, additional welfare-enhancing trade is created.
Moreover, regional trade initiatives can have beneficial indirect effects. Opening domestic markets to partner countries, for example, can increase competition in sectors with previously highly concentrated industrial structures and thereby reduce the monopolistic pricing power of incumbents. Such pro-competitive impacts are particularly important for countries like Tanzania that have only a nascent domestic competition policy, while showing significant concentration in some industrial sectors, such as cigarette manufacturing and beer brewing.
Also, regional cooperation can be effective in harmonizing customs procedures and domestic regulations. Adopting common rules on investment, for example, has the potential to encourage increased inflows of foreign direct investment (FDI) by enhancing the credibility of FDI-policies and providing a restraint on sudden policy reversals. However, so far the regional integration initiatives in Eastern and Southern Africa contain very few investment provisions (Te Velde and Fahnbulleh, 2003).
Some observers justify RTAs in political economy terms by seeing them as laboratories for international integration, training grounds for negotiations at a broader level, and strategic means of trade policy making. By teaming up with regional partners, countries may be able to increase the weight of their positions in international trade negotiations and possibly achieve more favorable negotiation outcomes. Also, regional trade agreements make it possible for countries to gain some control over the trade policy of their partner countries.
not be able to do so without violating the common external tariff, if one of its EAC partners faces a binding WTO commitment in the respective tariff lines.
Table 10: WTO Tariff Bindings of EAC Members
Country Number of bound tariff lines Minimum binding (%) Maximum binding (%)
Kenya 748 18 100
Tanzania 755 120 120
Uganda 815 40 80
Source: World Bank Staff based on WTO Consolidated Tariff Schedules database accessed through WITS.
More importantly, RTAs may result in losses of government revenues, as tariffs on intra-regional trade are phased out (see section 2.3 above), or promote costly trade diversion rather than welfare-enhancing trade creation, if trade is shifted from efficient producers outside the RTA to preferential trading partners that produce at higher costs. In this case, the government loses tariff revenue on imports from third countries, without domestic producers benefiting to a corresponding extent from lower import prices. The risk for trade diversion to occur is particularly high if MFN tariffs remain high and trade with partner countries accounts for only a small share of overall trade (World Bank, 2004), as in Tanzania.
A recent review of studies on the trade and welfare effects of customs unions concluded that the elimination of intra-regional trade barriers between small developing countries is likely to generate mostly trade diversion and little trade creation, unless significant reductions in MFN-tariffs accompany the regional integration efforts (Schiff and Winters, 2003). In the case of Tanzania, the formation of the EAC customs union and the adoption of the common external tariff led to modest average tariff reductions, while the top rate of 25 per cent was left unchanged. Analysis using a partial equilibrium model that takes into account the response of producers and consumers to tariff and price changes following customs union formation suggests that imports into Tanzania from EAC partners would grow by 3.1 per cent over 2002-levels following the complete phase-out of intra-regional tariffs, while imports from third countries would increase by 14.5 per cent (Castro, Kraus, and De la Rocha, 2004). If the top CET rate were to be reduced to 20 per cent, the study finds that imports from third countries would grow by 16.3 per cent compared to the 2002-baseline, while imports from EAC partners would increase by only 2.4 per cent. These results imply that a lowering of MFN-tariffs would result in a reduction (or slower growth compared with the baseline) of intra-regional trade. Hence, at least some of the new EAC trade seems to be merely the consequence of regional tariff preferences rather than comparative advantage. In other words, the EAC customs union is diverting trade away from third countries.
Another indication that the EAC customs union might have detrimental impacts on Tanzania is that the country sources very few products exclusively from EAC partners. Indeed, in nearly all tariff lines imports from third countries dominate imports from Kenya and Uganda (Castro, Kraus, and De la Rocha, 2004). Hence, there is a risk that the extension of EAC preferences leads to a substitution of regional for third country imports instead of creating new trade.
hundred, which implies a perfect match. The higher the index between two countries, the greater the product complementarity.
If the bilateral product complementarity index is calculated for 2003 from trade data at
the two-digit Harmonized System classification level, Tanzania‟s export and Kenya‟s imports
show an index value of 52.8 and Tanzania‟s imports and Kenya‟s exports a value of 42.0. The corresponding values for Tanzania‟s trade with Uganda are 49.7 and 31.0. These values for EAC partner complementarity fall short of those for well established, successful regional trade initiatives, such as the European Union (index value of 53.4) and the North American Free Trade Agreement (56.3), but exceed those of failed RTAs, such as the Latin American Free Trade Association (22.2) and the Andean Pact (7.4). In any case, the EAC index values are relatively large by regional standards and compare well with bilateral complementarity indices between COMESA and SADC partners, which only in a few cases exceed 25 (Khandelwal, 2004). Yet
despite the low intra-regional trade intensity and complementarity in Southern Africa, ex-ante
analysis using a computable general equilibrium model predicts that the formation of the SADC free trade area will be net welfare-improving, with Tanzania, however, reaping smaller benefits in relation to its GDP than other SADC members (Lewis, Robinson, and Thierfelder, 2003).
While further quantitative analysis of the economic effects of regional integration initiatives in Eastern and Southern Africa seems warranted, the available evidence suggests that there is considerable uncertainty about whether the existing regional agreements are in the best economic interest of Tanzania and its partner countries in the region. The authorities should try to maximize the benefits from Tanzania‟s RTAs by pursuing deeper integration through harmonization of trade standards and behind-the-border regulations. In parallel, the Government should follow a paradigm of open regionalisms by continuing to push for lower external trade barriers in order to counter the risk of trade diversion. RTAs should generally be seen as a means
of economic cooperation that can contribute to the achievement of the country‟s overall
development strategy, but that can not be a substitute for continuing domestic policy reform and multilateral trade liberalization.
3.4 Overlapping Membership in Regional Agreements
The simultaneous participation in several regional trade agreements poses a number of challenges for trade policy makers in Tanzania and in its EAC partners. As discussed earlier, Tanzania is a member of SADC, but not of COMESA, while Kenya and Uganda are members of COMESA, but not of SADC. This asymmetric configuration has the potential to create confusing and conflicting situations, which are bound to intensify over time as the respective integration agendas of EAC, SADC and COMESA are deepening.
Multiple membership of overlapping RTAs creates demanding requirements in several respects. In the private sector, traders have to operate within different trade regimes, each with its own tariff rates, regulations and procedures. In the public sector, negotiating and serving different regional initiatives can absorb large amounts of scarce administrative resources and occupy policymakers‟ attention to a considerable extent. In addition, budgetary contributions from member states towards the administration costs of the various RTAs can be a significant burden, as indicated by the cumulative (annual) arrears in membership contributions in SADC and COMESA (Kritzinger-van Niekerk and Moreira, 2002). Also, judicial conflicts might arise out of the existence of alternative legal frameworks and dispute settlement mechanisms.
specify a local value addition requirement of 35 per cent or a change in tariff heading, but for a number of tariff lines more complex, sector and product-specific rules of origin, as in SADC, were adopted. This situation with different rules of origin in EAC, SADC, and COMESA may pose problems for firms in EAC members that want to trade with neighboring countries and force them to adjust their production or trade operations. In particular, firms might be compelled to focus on only certain export destinations, given that they might need to produce differently in order to receive preferential access in foreign markets. Also, situations at the border may arise that are open to abuse or subject to excessive bureaucracy, thereby inflicting costs on traders in addition and beyond those related to compliance with the applicable rules of origin regulations (Hess, 2004).
Another type of problem from overlapping RTA-membership relates to conflicting liberalization commitments and requirements in different agreements (Bohanes, 2002). The SADC Trade Protocol (Article XXVIII, paragraph 2) states that member states cannot enter into a preferential trade agreement with third countries that may “impede or frustrate the objectives of this protocol and that any advantage, concession, privilege or power granted to a third country under such agreements is extended to other Member States.” A similar provision is included in
Article 56 of the COMESA Treaty. Since upon joining the EAC customs union, Tanzania granted market access preferences to Kenya and Uganda that exceed those given to its SADC partners, the literal reading of the provision implies the requirement to extend the EAC free intra-regional trade benefits also to all SADC countries. However, paragraph 3 of the same Article grants countries an exception from the obligation to extend preferences if the additional concessions are undertaken in the context of an agreement that preceded the Trade Protocol. As the EAC Treaty came into force three months before the SADC Trade Protocol, the waiver could apply.
Indeed, after deliberating on the matter, the EAC Council decided not to extend the EAC market access benefits to SADC and COMESA partners. However, the EAC members were allowed to continue with their existing obligations to SADC and COMESA and imports from the respective countries were exempted from the EAC‟s common external tariff. This continuation of member-specific preferences within the customs union could result in trade deflection, unless border controls are maintained for strict intra-EAC policing of trade, notably verification of rules of origin. Otherwise, Egyptian traders, for example, could export goods duty free to Kenya under the COMESA free trade arrangement and the local importers could then ship them to Tanzania duty-free under EAC preferences. Conversely, SADC members could use Tanzania as a transit route to Kenya and Uganda. Similar trade deflection could occur as a result of differences among EAC partners in tariff exemptions, providing a strong argument for their harmonization (Castro, Kraus, and de la Rocha, 2004). To counter any unintended extension of preferences, border controls will need to continue. Indeed, as long as the situation of overlapping membership remains, the EAC will not be able to become a fully functioning customs union and its members will not be able to reap the benefits of free internal movement of goods (Hess, 2004).
Some analysts have argued that Tanzania, Kenya and Uganda should resign, respectively, from SADC and COMESA, while retaining their political affiliation through an “Associate Membership.” The status of the latter would grant the right to attend meetings as observers, but would be free of tariff obligations and carry reduced membership fees. The EAC would then negotiate preferential agreements covering all of the partner countries within SADC and COMESA (Hope, Bhowon and Ruhindi, 2003). Others have suggested that the Cotonou Agreement and the Economic Partnership negotiations with the European Union could become the external driving force that would push the regional organizations to rationalize and harmonize their trade agreements (De la Rocha, 2003; Hinkle and Schiff, 2004). What seems important, in any case, is that policy makers are aware of the possibly emerging conflicts in integration and liberalization schedules between different RTAs and ensure sufficient flexibility in their integration commitments to avoid contradictory requirements.
4. RECOMMENDATIONS FOR POLICY REFORM AND TECHNICAL ASSISTANCE
Improvements in Tanzania‟s trade performance will depend on a number of factors. Important supply constraints have to be addressed (Amani, Nyange, Kweka, and Leyaro, 2003), including those concerning high transportation costs, inability to produce goods that meet quality standards in foreign markets, and high costs of doing business. Overcoming these impediments will require time and a considerable amount of resources. In contrast, improvements in core trade policy can be undertaken relatively quickly and without the need for large-scale financial funds. Indeed, an effective trade policy can contribute to mobilizing resources for growth and development.
Tanzania has made considerable progress over the past two decades in liberalizing its economy and integrating it into the regional and global market. The phasing-out of trade restrictions has played a key role in the revival of the Tanzanian export sector and the rationalization of imports (Kanaan, 2000), even though vested interests, such as those represented in the export crop boards, have in some sectors undermined the reform efforts (Cooksey, 2003). Moreover, the country was played an active role at the regional level and in the WTO.
This study described and assessed Tanzania‟s trade policy situation at a critical point in time, i.e. just after joining the EAC customs union. It thereby identified a number of issues that
need to be addressed in order to make better use of Tanzania‟s trade potential. A set of policy
Table 11: Policy Reform and Technical Assistance Matrix
Policy issue Action recommended
Requirements
Agency
involved Time frame
Imp le ment ex is ting po licy Cha ng e po licy / leg is la tio n Seek tec hn ica l a ss is ta nce Import policy
Reduce tariff escalation by pushing for a
reduction in the top rate within EAC. X MIT, MoF Longer term Establish a time-table for the phase-out of
special tariffs on “sensitive products”. X MIT, MoF Medium term
Reduce reliance on tariff revenue by reducing
“leakage” and strengthening the tax system. X MoF, TRA Longer term Improve awareness of trade policy issues
through better communication/internet site. X MIT Short term Strengthen analytical skills of public officials
for policy reform and trade negotiations. X MIT Medium term
Export policy
Critically assess existing export restrictions
with a view to phasing them out. X X MIT, MCM Medium term Finance sector development funds from the
budget rather than through export levies. X MoF, MNRT Longer term Expedite duty drawback refunds in order to
reduce anti-export bias. X TRA Short term
Regional integration
Increase professional staff in the EAC
Secretariat to deal with enhanced tasks. X MoF Medium term Harmonize exemptions within EAC to reduce
the risk of trade deflection. X MIT, TRA Short term Push for simple, non-restrictive rules of
origin specifications in regional agreements. X MIT Longer term Aim for flexibility within RTAs in order to
avoid contradictory requirements. X MIT Longer term Carefully assess the advantages and
drawbacks of re-entering COMESA. X MIT Medium term
Note: Agency abbreviations: MIT – Ministry of Industry and Trade; MoF – Ministry of Finance; TRA – Tanzania Revenue Authority; MCM – Ministry of Cooperatives and Marketing; MNRT – Ministry of Natural Resources and Tourism.
Time frame specifications: Short term – within 12 months, Medium term – within 2 years, Longer term – 2 to 5 years.