Support vector Approach by using Radial Kernel
Function for Prediction of Software Maintenance Effort
on the basis of Multivariate approach
Dimple Chandra
University School of Information Technology, GGSIPU, Delhi
ABSTRACT
The connection among object oriented metrics and software maintenance effort is complex and non-linear. Therefore, there is wide research area in development and application of sophisticated techniques which can be used to construct models for predicting software maintenance effort. The aim of this paper is to evaluate Support Vector Machine for Regression in software maintainability prediction using object-oriented metrics to construct models for prediction of Software Maintenance Effort. Support Vector Machine has already proved its importance in Banking Sector and in other areas also. I am using SVR with Radial kernel function. It is observed that Support Vector Machine can be used for constructing accurate models for prediction of software maintenance effort which gives most accurate models for prediction. We are using maintenance effort data of two commercial software products QUES (Quality Evaluation System) and UIMS (User Interface System) Data is used in this study. The dependent variable in our study is maintenance effort. The independent variables are eight Object Oriented metrics. I will verify the dataset by Multivariate performance basis.
Keywords: Support Vector Machine, Regression, Kernels
function, Object-Oriented Metric.1. INTRODUCTION
Currently software quality is a major factor of concern. The growing research activity in software quality leads to innovation of novel practice, to predict its attributes. There are several empirical studies which show that there is a strong relationship between Object Oriented (OO) metrics and OO software quality attributes such fault proneness (V.Basili, L.Briand, W.Melo), maintenance effort (W.Li and S.Henry) and testability (S. R. Chidamber and C. F. Kemerer). Maintainability is an important quality attribute and a difficult concept as it involves a number of measurements. OO metrics are used in quality estimation. However quality estimation means estimating maintainability or Reliability of software. Software reliability is a valuable ingredient to make the system work properly without a fail (M. R. Lyu). As the OO system uses a huge amount of small methods, it is time consuming, error prone and has a distinctive maintenance problem (R. E. Johnson and B. Foote).
In my knowledge there is no significant research study showing application Support Vector Machine with Kernel functions on Multivariate performance basis. As the traditional computers are not excellent to interact because of the noised data, immense parallelism, fault tolerant, and failure to adapt to certain circumstance, so
Support Vector Machine provides a better option for handling software quality. The application of Support Vector Machine for software quality prediction using object-oriented metrics is focused in this paper.
1.1 Support Vector Machine
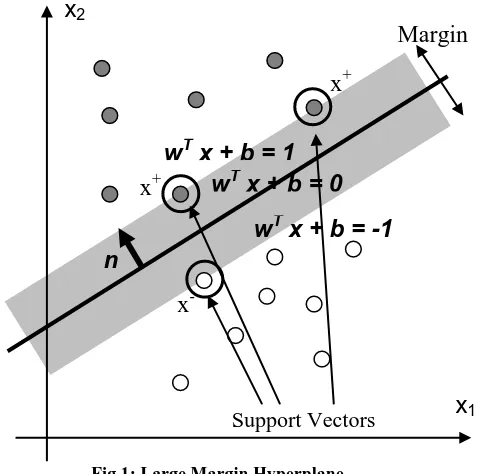
SVM (Support Vector Machines) are a useful technique for data classification and regression. SVM is a learning system using a high dimensional feature space. It yields prediction functions that are expanded on a subset of support vectors. SVM can generalize complicated gray level structures with only a very few support vectors. SVM is a large margin linear classifier.
One interesting property of support vector machines and other kernel-based systems is that, once a valid kernel function has been selected, one can practically work in spaces of any dimension without any significant additional computational cost, since feature mapping is never effectively performed. In fact, one does not even need to know which features are being used.
Another advantage of SVMs and kernel methods is that one can design and use a kernel for a particular problem that could be applied directly to the data without the need for a feature extraction process.
Given a set of data points:
Where
With a scale transformation on both w and b, the above is equivalent to
We know that
1
1
TT
b
b
w x
w x
For
1,
1
For
1,
1
T
i i
T
i i
y
b
y
b
w x
w x
{( ,
x
iy
i)},
i
1, 2,
L
,
n
For
1,
1
For
1,
1
T
i i
T
i i
y
b
y
b
The margin width is:
[image:2.595.58.298.191.428.2]The kernel trick can be applied to any algorithm that solely depends on the dot product between two vectors. Wherever a dot product is used, it is replaced by a kernel function.
Fig 1: Large Margin Hyperplane
1.2 Support Vector Regression
SVMs can also be applied to regression problems by the introduction of an alternative loss function (Nello Cristianini and John Shawe-Taylor), (A. J. Smola). The loss function must be modified to include a distance measure. The regression can be linear and non linear. Linear models mainly consist of the following loss functions, e-intensive loss functions, quadratic and Huber loss function.
Instead of minimizing the observed training error, Support Vector Regression (SVR) attempts to minimize the generalization error bound so as to achieve generalized performance. The idea of SVR is based on the computation of a linear regression function in a high dimensional feature space where the input data are mapped via a nonlinear function (Debasish Basak, Srimanta Pal and Dipak Chandra Patranabis).
By using different loss function called the ε-insensitive loss function,
0
},
)
(
,
0
max{
)
(
f
x
y
f
x
y
This loss function ignores errors that are smaller than a certain threshold ε > 0 thus creating a tube around the true output. The primal becomes:
We can estimate the accuracy of SVM regression by computing the scale parameter of a Laplacian distribution on the residuals ζ = y − f(x), where f(x) is the estimated decision function (Lin and Weng 2004).
2. THE KERNEL TRICK
The kernel trick can be applied to any algorithm that solely depends on the dot product between two vectors. Wherever a dot product is used, it is replaced by a kernel function. When done, linear algorithms are transformed into a non-linear algorithm.
The RBF kernel is one of the most popular kernel functions. It adds a ”bump” around each data point:
is the kernel parameter. The choice of best
value is an important factor for the performance of the SVM.I have chosen RBF kernel for my research in this paper because in many studies RBF kernel found to be best kernel among all kenels (Jae H. Min, Young-Chan Lee).
2.1 Gaussian Kernel
The Gaussian kernel is an example of radial basis function kernel.
)
2
exp(
)
,
(
2 2
y
x
y
x
k
Alternatively, it could also be implemented using
)
exp(
)
,
(
x
y
x
y
2k
The adjustable parameter sigma plays a major role in the performance of the kernel, and should be carefully tuned to the problem at hand. If overestimated, the exponential will behave almost linearly and the higher-dimensional projection will start to lose its non-linear power. In the other hand, if underestimated, the function will lack regularization and the decision boundary will be highly sensitive to noise in training data.
x
1x
2w
Tx + b = 0
w
Tx + b = -1
w
Tx + b = 1
n
Support Vectors
Margin
x
-x
+x
+(
)
2
(
)
M
x
x
n
w
x
x
w
w
0
)
),
(
(
)
),
(
(
)
(
2
1
)
,
(
* * 0 * 2
i i i i i i i m i i ib
w
x
y
y
b
w
x
m
c
w
w
t
n i ii
x
x
b
3. EMPIRICAL DATA
The commercial software products UIMS and QUES data are used in this research paper, which is presented in Li and Henry Paper (W.Li and S.Henry). The number of lines changed per class is termed as Maintenance Effort. Addition or a deletion could be a line change. A change of the content of a line is counted as a deletion followed by an addition. This measurement is used in this study to estimate the maintenance effort of the Object Oriented systems. UIMS Dataset contains 39 classes and QUES contains 71 classes.
4. METRIC SET
The object oriented metrics used by Li-Henry in their research paper are abbreviated as follows (W.Li and S.Henry):
4.1 DIT
Depth in the Inheritance Tree
The DIT metric measures the position of a class in the inheritance hierarchy. One may hypothesize that the larger the DIT metric, the harder it is to maintain the class. The calculation of the DIT metric is the level number for a class in the inheritance hierarchy. The root class DIT is zero, DIT ranges from 0 to N; where N is a positive integer.
4.2 NOC
Number of ChildrenThe NOC metric measures the number of direct children a class has. One may intuit that the larger the NOC metric, the harder it is to maintain the class. The calculation of NOC is number of direct sub-classes; ranging from 0 to N; where N is a positive integer.
4.3 MPC
Message Passing Coupling
MPC is used to measure the complexity of message passing among classes in the research. MPC is number of send-statements defined in a class. The number of messages sent out from a class may indicate how dependent the implementation of the local methods is upon the methods in other classes.
4.5 RFC
Response for ClassThe RFC metric measures the cardinality of the response set of a class. One may intuit that the larger the RFC metric, the harder it is to maintain the class since calling a large number of methods in response to a message makes tracing an error difficult. The calculation of RFC is number of local methods and number of methods called by local methods; ranging from 0 to N; where N is a positive integer.
4.6 LCOM
Lack of Cohesion of Methods
The LCOM metric measures the lack of cohesion of a class. One may intuit that the larger the metric, the harder it is to maintain the class. The calculation of LCOM is number of disjoint sets of local methods; no two sets intersect; any two methods in the same set share at least one local instance variable; ranging from 0 to N; where N is a positive integer.
4.7 DAC
Data Abstraction Coupling
A class can be viewed as an implementation of an ADT (Abstract Data Type). The metric which measures the coupling complexity caused by ADTs is DAC (Data Abstraction Coupling) and is the number of ADTs defined in a class.
4.8 WMC
Weighted Method Complexity
WMC metric measures the static complexity of all the methods. The more control flows a class’ methods have, the harder it is to understand them, thus the harder it is to maintain them. The WMC is calculated as the sum of McCabe’s Cyclomatic complexity of each local method; ranging from 0 to N; where N is a positive integer.
4.8 NOM
Number of MethodsNOM in a class, since the local methods in a class constitute the interface increment of the class, NOM serves the best as an interface metric. NOM is the number of local methods. The more methods a class has, the more complex the class’ interface has incremented.
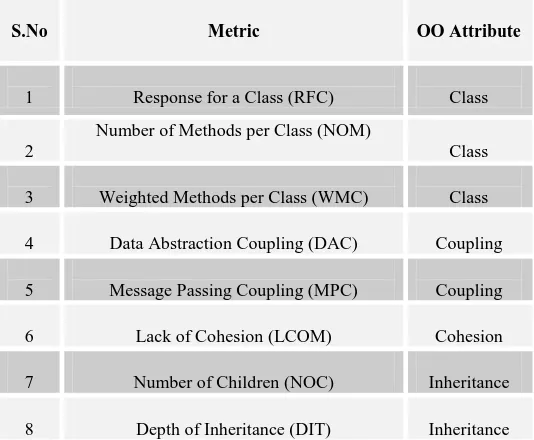
The various Metrics and their sources are defined in Table1.
4.9 Change
The maintenance effort used in the study is (collected for each class maintained):
Change = number of lines changed per class in its maintenance history.
[image:3.595.287.554.530.750.2]The maintenance effort “change” is measured as “the number of lines changed per class. The “change” is used as a dependent variable in this study. A line change could be an addition or a deletion. A change of the content of a line is counted as a deletion and an addition (W.Li and S.Henry).
Table 1. OO Metrics
S.No Metric OO Attribute
1 Response for a Class (RFC) Class
2
Number of Methods per Class (NOM)
Class
3 Weighted Methods per Class (WMC) Class
4 Data Abstraction Coupling (DAC) Coupling
5 Message Passing Coupling (MPC) Coupling
6 Lack of Cohesion (LCOM) Cohesion
7 Number of Children (NOC) Inheritance
5. DEPENDENT AND INDEPENDENT
VARIABLES
The continuous dependent variable in our study is testing effort. The goal of our study is to empirically explore the relationship between OO metrics and testing effort at the class level. We use SVM with Gaussian kernel to predict testing effort per class. Testing effort is defined as lines of code changed or added throughput the life cycle of the defect per class. The independent variables are OO metrics chosen for this study. The metrics selected in this study are summarized in Table 1.There are eight independent variables i.e. rfc, nom, wmc, dac, mpc, lcom, noc, dit and one independent variable i.e change in the W.Li and S.Henry Dataset.
6. EXPERIMENTAL METHODOLOGY
The performance is calculated on the basis of Multivariate performance of all software metrics together. This is because, the effect of all software metric can be observed and the cumulative behaviour of all metric in prediction process can be undertaken. The prediction of software maintenance effort is calculated by SVM. Here in this paper we are using two commercial datasets UIMS and QUES. We are using SVM with Radial kernel function for the regression value calculation of each metric.7.
MAINTENANCE
EFFORT
MODELING USING SVM
For maintenance effort we are calculating MARE, MRE, R-Value and P-R-Value.
7.1 Mean Absolute relative error (MARE)
(G.Finnie and G. Witting) - This is the preferred measure used by software engineering researchers and is given asWhere predicted is predicted output which is calculated by using SVM, actual is the actual values available in the Dataset and N is the no. of observations.
7.2 Mean Relative Error (MRE) (G.Finnie and
G. Witting) – This measure is used to estimate whether models are biased and tend to overestimate or underestimate and is calculated as follows:
A large positive MRE would suggest that the model over estimates the number of lines changed per class, whereas a large negative value will indicate the reverse.
7.3 R-value
Correlation-“Correlation coefficient (R-value) (www.mathworks.com) between the outputs and targets. It is a measure of how well the variation in the output is explained by the targets. If this number is equal to 1, then there is perfect correlation between targets and outputs”.
7.4 P-values
P-values (www.mathworks.com) –“p-values are used for testing the hypothesis of no correlation. Each p-value is the probability of getting a correlation as large as the observed value by random chance, when the true correlation is zero. If p is small, say less than 0.05, then the correlation R is significant”.
8. MULTIVARIATE ANALYSIS
It is based on the statistical principle of multivariate statistics, which involves observation and analysis of more than one statistical variable at a time. In design and analysis, the technique is used to perform trade studies across multiple dimensions while taking into account the effects of all variables on the responses of interest.
8.1 Multivariate Results:
Here to observe the impact of object oriented metrics in Maintenance measurement, we have chosen all metrics at one time to calculate its parameters and observe the impact of all metric in prediction process for calculating Maintenance measurement of the software.
Here in this paper for each metric I have calculated MARE, MRE, R-Value and P-Values. And on the basis of these results we can observe the multivariate results for Maintenance effort measurement of the software.
Table2. QUES Dataset
Multivariate Response of all OO Metric by Using Support Vector Machine with Radial Kernel Function of UIMS Dataset.
MARE MRE R-Value P-Value
Radial
Kernel 1.636 28.382 0.6398 0
Table3. UIMS Dataset
Multivariate Response of all OO Metric by Using Support Vector Machine with Radial Kernel Function of QUES Dataset.
MARE MRE R-Value P-Value
Radial
Kernel 0.360 19.333 0.7742 0
9. OBSERVATIONS
MARE and MRE are calculated on the SVR values of the actual dataset by using some Statistical Software. And Correlation function R-Value and P-Value are calculated by using MATLAB.
In QUES Dataset the NOC Metric is completely zero so we are leaving this metric for the calculation. In UIMS dataset all metric are have values, so MARE, MRE, R-Value and P-Values are calculated for all eight metrics.
For Multivariate we will take all metrics together for the calculation of all four parameters.
N
actual
actual
predicted
abs
MARE
N i
1)
(
N
actual
predicted
abs
MRE
N i
110. CONCLUSION
In this work we evaluate and compare different Object Oriented Metrics for prediction of software maintenance effort of commercial software systems. The Tables 2 and 3 shows the MARE obtained with different Object Oriented Metrics to compare their accuracy for prediction of software maintenance effort. The results show that the MARE of QUES Dataset is 1.636 and the MARE of UIMS dataset is 0.360. It is concluded that the results of Multivariate are the best followed by other approaches. Hence it is concluded that the Multivariate approach can be successfully used for the prediction of software maintenance effort. However, our results need to be generalized by conducting similar studies on maintenance data of software system.
11.REFERENCES
[1] V.Basili, L.Briand, W.Melo, “A Validation of Object- Oriented Design Metrics as Quality Indicators”, IEEE Transactions on Software Engineering, vol. 22 no.10, pp. 751-761, 1996
[2] W.Li and S.Henry, “Object Oriented Metrics that Predict Maintainability”, Journal of Systems and Software, vol 23 no.2, pp.111-122, 1993.
[3] S. R. Chidamber and C. F. Kemerer, “A Metrics Suite for Object Oriented Design,” IEEE Transactions on Software Engineering, vol. 20, pp 476- 493, 1994. [4] M. R. Lyu, “Handbook of software Reliability
Engineering”, IEEE Computer Society Press, McGraw Hill, 1996.
[5] R. E. Johnson and B. Foote, “Designing Reusable Classes. Journal of Object-Oriented Programming”, vol. 1, no. 2, pp. 22-35, 1988.
[6] Debasish Basak, Srimanta Pal and Dipak Chandra Patranabis, “Support Vector Regression”, Neural Information Processing – Letters and Reviews, Vol. 11, No. 10, October 2007.
[7] Lin CJ, Weng RC (2004). “Probabilistic Predictions for Support Vector Regression.”
[8] G.Finnie and G. Witting, “AI Tools for Software Development Effort Estimation”, International Conference on Software Engineering: Education and practice, 1996.
[9] B.Henderson-sellers, “Object-Oriented Metrics, Measures of Complexity”. Prentice Hall, 1996.
[10]www.mathworks.com.
[11]Nello Cristianini and John Shawe-Taylor, “An Introduction to Support Vector Machines and Other Kernel-based Learning Methods”, Cambridge University Press, 2000.
[12]A. J. Smola. “Regression estimation with support vector learning machines”. Master’s thesis, Technische Universit¨at M¨unchen, 1996.