Optimization Generation Expansion
Planning by HBMO
Zakariya Hejrati
Department of ElectricEngineering, Science and Research
Branch,
Islamic Azad University, Sari, Iran
Ebrahim Hejrati
Department of ElectricEngineering, Science and Research
Branch,
Islamic Azad University, Sari, Iran
Atefeh Taheri
Moghadam
Department of ElectricEngineering, Science and Research
Branch,
Islamic Azad University, Sari, Iran
ABSTRACT
The generation expansion planning (GEP) problem is a large-scale mixed integer nonlinear programming (MINLP) problem cited as one of the most complex optimization problems. In this paper, an application of honey bee mating optimization for solving the generation expansion planning problem is presented. In the formulation, the objective is to minimize investment cost. The GEP problem considered is a test system for a six-year planning horizon having five types of candidate units. The results are compared and validated.
Keywords
generation expansion planning, honey bee mating optimization, Investments.
1.
INTRODUCTION
We ask that authors follow some simple strategy. In real meaning, we ask you to make your paper look precisely like this article. The easiest way to do this is simply to download the template, and replace the substance with your own matter. Generation expansion planning (GEP) is clear as the problem of determining which, where, and when new generation units should be constructed over a long range planning horizon, to gratify the expected energy demand. The GEP problem is considered difficult to solve for some reasons resulted from the vagueness associated with the input data, such as forecasts of demand for electricity, economic and technical
characteristics of new developing generating technologies, construction lead times, and governmental regulations[1].The generation expansion planning (GEP) problemseeks to make out which generating units should be custom-made and when they should become existing over the long-term planning horizon [1], [2]. This GEP model is valid for developing countries, where planning is matched by central or state government owned utilities for capacity addition. It is also applicable in a market-based industry for companies intending to serve load from multiple generation facilities[2,3]. The mean of a traditional power generation planning has been to give an enough supply of electrical energy at minimum cost [4]. because non-linearity and complexity of GEP problem, a various approaches has been offered to solve and optimization that in traditional location [5].
The main objectives of GEP are to minimize the sum investment and the operating cost of the generating units, and to meet the demand criteria, fuel-mix ratio, and the reliability criteria. planning the expansion of electric systems, is the high insecurity in fossil fuel prices and their rising trend (IEA,
2004). Despite the attractiveness of generation units that use gas to produce electricity, since they are cleaner and cheaper than the other fossil fuel technologies (oil and coal), the risks of high and undecided costs of this fuel type have to be considered in the planning process. The traditional approach is to formulate this problem as a single-objective optimization problem with constraints. this approach just results in a single optimal result where tradeoffs between different components of the objective function have to be fixed in advance of result.
Contrary to the reality that there are various algorithms that are based on the foraging performance of the bees, the main algorithm proposed based on the marriage behavior is the Honey Bees Mating Optimization algorithm (HBMO), so as to was existing [7,8].This paper studies the GEP problem which is a multipart problem. Honey bee mating optimization (HBMO) algorithm is used as an optimization means for solving this difficult and non-linear problem. at last kind and capacity of generation units for each stage are determined. The Honey Bees Mating Optimization algorithm simulates the mating practice of the queen of the hive. The mating practice of the queen begins when the queen flights away from the nest performing the mating flight during which the drones follow the queen and mate with her in the space.
2.
GENERATION EXPANSION
PLANNING PROBLEM
FORMULATION
GEP problem is equivalent to finding a set of best decision vectors over a planning horizon that minimizes the investment and operating costs less than related constraints. It is assumed the first feasible availability date of new generation is two years past the existing date. 2.1 The cost objective is represented by the following expression:
1
min C= [ ( ) ( ) ( )]
T
t t t
t
I U M X S U
(1)Where
1 (t=1,2,...,T)
t t t
X X U (2)
2
, 1
(
)
(1
)
(
)
N t
t i t i
i
I U
d
CI
U
2( 1)
1
2( 1)
,
(
)
(1
)
(
(
))
N T t i i T ti t i
S U
d
CI
U
(4) 1(2.5 ' ')
' 0
, ,
1
(
)
(1
)
(
)
t s t
s N
t i i i t i
i
M X
d
X
FC
MC
EES
(5)'
2(
1) and T'=2 T - t'
t
t
(6), 1
(
)
N
t t i
i
U
U
(7), 1
(
)
N
t t i
i
X
X
(8)C total cost, $;
Ut N-dimensional vector of newly introduced units in the stage (1stag=2years)
Ut,i the number of newly introduced units of type i in stage t;
Xt cumulative capacity vector of existing units in stage ,(MW);
Xt,i cumulative capacity of existing units of type in stage ,(MW);
I(Ut) present value of investment cost of the newly introduced unit at the t-th stage, $;
M(Xt) present value of total operation and
maintenance cost of existing and the newly introduced units, $;
S‟ variable used to indicate that the maintenance cost is calculated at the middle of each year; S(Ut) present value of salvage value of the newly
added unit at t-th interval, $; d discount rate;
CIi capital investment cost of ith unit, $; δi salvage factor of ith unit;
T length of the planning horizon (in stages); N total number of different types of units; FC fixed operation and maintenance cost of the
units, $/MW;
MC variable operation and maintenance cost of the units (energy), $/MWh;
EES expected energy served, MWh;
2.2 Constraint Objective:
2.2.1 Reserve margin: The selected units must satisfy the minimum and maximum reserve margin.
min , max
1
(1 ) (1 )
N
t t i t
i
R D X R D
(9)Where
Rmin minimum reserve margin; Rmax maximum reserve margin; Dt demand at the t-th stage in MW;
2.2.2 Fuel mix ratio: The GEP has different types of generating units: for example coal, liquefied natural gas (LNG), oil, and nuclear. The selected units along with the obtainable units of all type must satisfy the fuel mix ratio.
,
min max
, 1
j=1,2,...N
j t j j
N t i i
X
FM
FM
X
(10) whereFMjmin minimum fuel mix ratio of jth type; FMjmax maximum fuel mix ratio of jth type;
j type of the unit (e.g., oil, LNG, coal, nuclear). 2.2.3 Reliability criterion: The selected units along with the existing units must satisfy a reliability criterion on loss of load probability (LOLP).
LOLP
(11)Where ε is the reliability criterion for maximum allowable LOLP.
2.2.4 Operating Constraints: The upper construction limit and the demand constraint are hard constraints.
max,
0
U
t
U
t (12)Where Umax,t is the maximum construction capacity of the units at stage t.
Demand: The selected units must satisfy the demand
Where
Dt demand at the jth stage, MW.
3.
HONEY BEE MATING
OPTIMIZATION ALGORITHM
A honey bee colony typically consists of a
single
egg-laying long-lived queen, where from zero to a number of thousand drones (depending on the season) and frequently 10,000 to 60,000 workers [9]. Queens are specialized in egg laying [10]. A colony may include one queen or more during its life-cycle, which are named monogynous and/or polygynous colonies, in that order. Only the queen bee is fed „„royal jelly,‟‟ which is a milky-white colored, jelly-like substance. „„Nurse bees‟‟ secrete this nourishing food from their glands, and feed it to their queen. The diet of royal jelly makes the queen bee larger than any other bee in the hive. A queen bee may live up to 5 or 6 years, while worker bees and drones never live more than 6 months. There are frequently a number of hundred drones that live with the queen and worker bees. Mother nature has given the drones just one task, which is to provide the queen with various sperm. After the mating process, the drones die.Drones are the fathers of the colony. They are haploid and act to intensify their mothers‟ genome without altering their genetic composition, except through mutation. as a result, drones are considered as agents that promulgate one of their mother‟s gametes and function to allow females to act genetically as males. Workers are particular in brood care and at times lay eggs. Broods come up either from fertilized or unfertilized eggs. The former represent potential queens or workers, while the last represent prospective drones.
, 1 N
t i t i
X D
In the marriage process, the queen(s) mate during their mating flights far from the nest. A mating flight starts with a dance performed by the queen who then starts a mating flight during which the drones follow the queen and mate with her in the space. In every mating, sperm reaches the spermatheca and accumulates there to form the genetic pool of the colony. all time a queen lays fertilized eggs, she by chance retrieves a mixture of the sperm accumulated in the spermatheca to fertilize the egg [11].
The queen is pursued by a large swarm of drones (drone comets), when copulation occurs. Insemination ends with the eventual death of the drone, and the queen getting the „„mating sign.‟‟ The queen mates several times but the drone, inevitably, only once. These features create bee mating the most spectacular mating among insects.
The mating flight may be considered as a set of transitions in a status-space where the queen moves between the dissimilar states in some speed and mates with the drone encountered at every status probabilistically. At the start of the flight, the queen is initialized with various energy content and returns to her nest when the energy is within some threshold from zero to full spermatheca.
In rising the algorithm, the functionality of workers is restricted to brood care and so, every worker may be represented like a heuristic which acts to get better and/or take care of a set of broods (i.e., as feeding the future queen with royal jelly). A drone mates with a queen probabilistically using an annealing function as follows [12]:
[ ( )/ ( )]
Pr
( )
f S tob D
e
(14)where Prob (D) is the probability of adding the sperm of drone D to the spermatheca of the queen (that is, the probability of a successful mating), D(f) is the absolute difference between the fitness of D and the fitness of the queen (for complete description of the calculation of the fitness function see below) and Speed(t) is the speed of the queen at time t. The probability of mating is high when the queen is at the beginning of her mating flight, therefore her speed is high, or when the fitness of the drone is as good as the queen‟s. After each transition in space, the queen‟s speed and energy decays as said by the following equations:
Speed(t+1)=
Speed(t)
(15)energy(t+1)=energy(t)
(16)where α is a factor
[0,1] and γ is the quantity of energy reduction after each transition.The queens play the most main role in the mating process in nature over and above in the HBMO algorithm. every queen is characterized with a genotype, speed, energy, and a spermatheca with clear capacity. The spermatheca is the repository for the drone‟s sperm after the mating process with the queen. Thus, for a queen‟s defined spermatheca size, speed and energy are initialized before each mating flight, with random realization in the range of (0.5, 1).
In the algorithm, a drone is represented by a genotype and a genotype indicator. for the reason that all drones are naturally haploid, a genotype marker may be employed to randomly mark half of the genes, exit the other half unmarked. In this case, only the unmarked genes are those that form a sperm to be by chance used in the mating process [12].
Workers that are used to get better the brood‟s genotype may represent a set of unlike heuristics. The rate of development in
the brood‟s genotype, as a result of a heuristic application to that brood, defines the heuristic fitness value.
from the time when the drones are assumed to be haploid, after a successful mating, the drone‟s sperm is stored in queen‟s spermatheca. Later in procreation process, a brood is constructed by copying some of the drone‟s genes into the brood genotype and carrying out the rest of the genes from the queen‟s genome. The fitness of the resulting genotype is resolute by evaluating the value of the objective function of the brood genotype and/or its normalized value. It is important to note that a brood has just one genotype.
Thus, an HBMO algorithm may be constructed with the following five main stages:
• The algorithm starts with the mating flight, where a queen (best solution) selects drones
probabilistically to form the spermatheca (list of drones). A drone then selected from the list by chance for the making of broods.
• Making of new broods by crossover the drone„s genotypes with the queens.
• Use of workers (heuristics) to conduct local search on broods (trial solutions).
• Adjustment of worker„s fitness, based on the amount of improvement achieved on broods.
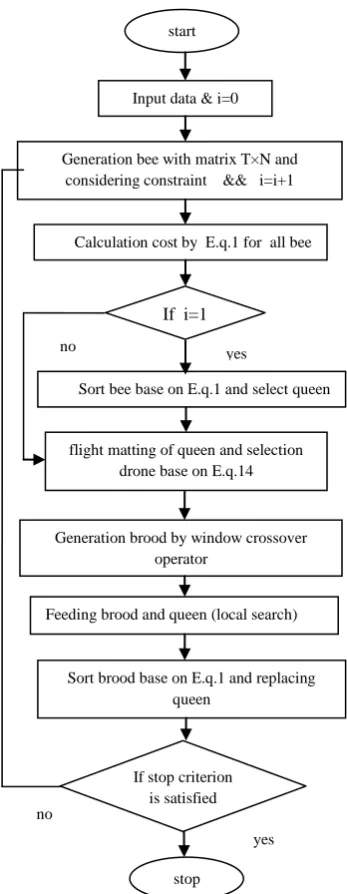
[image:3.595.312.540.419.574.2]• Replacement of weaker queens by fitter broods. The main steps in the HBMO algorithm are presented in Fig. 1.
Fig. 1. The HBMO algorithm [12]
frequently a good bee. A number of mating flights are then undertaken. In all mating flight, all queens fly based on the energy and speed of each, where both energy and speed are generated at random for every queen before every mating flight commences. At the start of a mating flight, a drone is generated randomly and the queen is positioned over that drone. The transition made by the queen in space is based on her speed which represents the chance of flipping every gene in the drone‟s genome. At the start of a mating flight, the speed may be elevated and the queen may make very large steps in space. though the energy of the queen decreases, her speed decreases, and as a result, the neighborhood covered by the queen, decreases. At all step in the gap, the queen mates with the drone encountered at that step using the probabilistic law in Eq. (14). If the mating is doing well (i.e., the drone passes the probabilistic decision rule), the drone‟s sperm is stored in the queen‟s spermatheca. briefly, the algorithm starts with a mating flight where a queen selects a drone with a predefined probabilistic rule. By cross-overing the drone‟s genotypes with the queen‟s, a new brood is formed which later can be better, employing workers to conduct local search.
while every queens complete their mating flight, they start breeding. For a necessary number of broods, a queen is chosen in proportion to her fitness and mated with a randomly selected sperm from her spermatheca. A worker is chosen in proportion to its fitness to get better the resultant brood. After all broods have been generated, they are sorted along with their fitness. The top brood replaces the worst queen awaiting there is no brood that is better than any of the queens. left over broods are then killed and a new mating flight begins until all assigned mating flights are finished or convergence criterion are met.
4.
HBMO implementation to GEP
We selected HBMO to solve the GEP problem because it has been demonstrated to be among the most efficient algorithms for optimization problem. The details of our method include five stages show as follows.
Stage 1: Generate the initial drone sets
Generate m drones with matrix N×T and consider all constraint.
Where N: total number of different types of units. T: length of the planning horizon (in stages).
Di=[matrix]N,T (17)
D=[D1 D2 D3 … Dm] (18)
Stage 2: determine queen
Among all drones, the drone Di with the minimum value of f(Di) for all i is assigned as the queen Q.
Stage 3: Flight matting
The stage3 do the flight matting of queen Q. The best drone Dk with the largest Prob(Q,Di) among the drone set D is selected the object of matting for the queen Q. After the flight matting the queen‟s speed and energy decay is reduced by Eq.(16). The flight matting is continues until the speed S(t) is less than a threshold d or the number of sperms of the queen‟s spermatcheca is less than the threshold nsperm .
Stage 4: Breeding process
In this step, a population of broods is generated based on matting between the queen and the drones stored in the
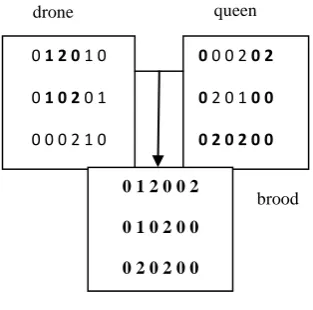
[image:4.595.333.490.191.346.2]queen‟s spermatheca. each brood is generated by window crossover operator. This crossover operator works by randomly choosing a window size. If the window size is smaller than the remaining portion of the matrix, a brood is created with the window portion from the drone and the remaining portion from the queen. This is reversed if the window is larger than the remaining matrix entries, i.e., the child has more material from the queen, a version of parameterized uniform crossover.
Fig. 2 shows an example of the crossover operator.
Fig. 2: Window Crossover Operator
Stage 5: feeding selected broods and queen with the royal jelly by workers
Improve the newly generated set of solutions employing different heuristic functions and mutation operators according to their fitness values. There are three worker for feeding selected broods and queen.
For matrix brood=[T×N]
Worker1: searching and changing randomly some matrix elements.
Worker2: shifting and changing randomly the columns. Worker3: removing the constraint violated.
Stage 6: replacing queen
First, sorting broods based on their cost function. If the best brood is better than queen, algorithm replaces queen by the best Brood.
Stage 7: Check the termination criterion
If the termination criterion is satisfied then finish the algorithm, else discard the all previous trial solutions (brood set). Then algorithm generates new drone and go to step3 until the assigned iteration completed.
Fig.3 depicts the HBMO algorithm used to solve this GEP problem.
0 1 2 0 1 0
0 1 0 2 0 1
0 0 0 2 1 0
0 0 0 2 0 2
0 2 0 1 0 0
0 2 0 2 0 0
0 1 2 0 0 2
0 1 0 2 0 0
0 2 0 2 0 0
5.
TEST RESULTS
The implementation was done using MATLAB version 9.2, on a Vaio PC with Pentium dual processor having 2.1 GHz speed and 4 GB RAM.
The forecasted load and other data are taken from [13]. The test system with 15 existing power plants and five types of candidate options is considered for a six-year planning horizon. The planning horizon is divided into three stages (two-year intervals). The forecasted peak demand is given in Table 1.
Table I: Forecasted peak demand [13].
Stage(years) 2007 2009 2011 2013
Peak(MW) 5000 7000 9000 10000
[image:5.595.66.240.74.522.2]Economic and technical data of existing plants are provided in Table II and candidate plant types for future additions is given in Table III.
Table 2: Technical and economic data of existing plants [13].
Name(fuel type)
No. of unit
s
Unit capaci ty (MW)
FO R %
Operati ng cost ($/KWh
)
Fixed O&M cost ($/K W-mon)
Oil#1(heavy oil) 1 200 7.0 0.024 2.25
Oil#2(heavy oil) 1 200 6.8 0.027 2.25
Oil#3(heavy oil) 1 150 6.0 0.030 2.13
LNG
G/T#1(LNG) 3 50 3.0 0.043 4.52
LNG
C/C#1(LNG) 1 400
10.
0 0.038 1.63
LNG
C/C#2(LNG) 1 400
10.
0 0.040 1.63
LNG
C/C#3(LNG) 1 450
11.
0 0.035 2.00
Caol#1(Anthera
cite) 2 250
15.
0 0.023 6.65
Caol#2(bitumin
ous) 1 500 9.0 0.019 2.81
Caol#3(bitumin
ous) 1 500 8.5 0.015 2.81
Nuclear#1
(PWR) 1 1000 9.0 0.005 4.94
Nuclear#2
(PWR) 1 1000 8.8 0.005 4.63
Table 3: Technical and economic data of candidate plants [13]
Candidat e type
Cons t-racti
on uppe
r limit
ed Capa
c-ity (MW )
Operat ing cost
($/KW h)
FO R %
Fixed O&
M cost ($/K W-mon)
Cop it-al cost
Lif e tim
e (Yr
s)
Oil 5 200 0.021 7.0 2.20 812.
5 25
LNG C/C 4 450 0.035 10.
0
0.90 500.
0 20
COAL(bit um)
3 500 0.014 9.5 2.75 1062
.5 25
Nuc.(PW R)
3 1000 0.004 9.0 4.60 1625
.0 25
Nuc.(PH WR)
3 700 0.003 7.0 5.50 1750
.0 25
The second column in Table III denotes an upper limit on the number of units of each candidate option per stage which reflects the construction capabilities by plant type. The last column in Table III is associated with the evaluation of salvage value of a plant that operates beyond the planning horizon.
The lower and upper bounds for reserve margin are set at 20% and 40% respectively. The salvage factor is assumed to be 0.1, 0.1, 0.15, 0.2 and 0.2 for oil, LNG, coal, PWR, and PHWR, respectively. The discount rate is 8.5%. It is assumed the first possible availability date of new generation is two years beyond the current date. The year investment cost is assumed to occur in the beginning of year ; the year maintenance cost is assumed to occur in the
start
Input data & i=0
Generation bee with matrix T×N and considering constraint && i=i+1
If i=1
Calculation cost by E.q.1 for all bee
Sort bee base on E.q.1 and select queen
flight matting of queen and selection drone base on E.q.14
Generation brood by window crossover operator
Feeding brood and queen (local search)
Sort brood base on E.q.1 and replacing queen
If stop criterion is satisfied
stop yes
yes no
no
[image:5.595.303.529.129.394.2]middle of year and is calculated by the equivalent energy function
method [3]. The year salvage cost is assumed to occur at the end of the planning horizon.
[image:6.595.52.272.199.259.2]The results are sensitive to algorithm parameters, typical of heuristic techniques. Hence, it is required to perform repeated simulations to find suitable values for the parameters. The best parameters for the HBMO, selected through fifteen test simulation runs, are given in table 4.
Table 4: The parameters used in the MEHB-GEP algorithm.
Numbe r of drones
Numbe r of worker
s
numbe r of queen
β α λ Capacity of spermathec
a
70 10 1 0.9 3
0.9 6
0.0
6 20
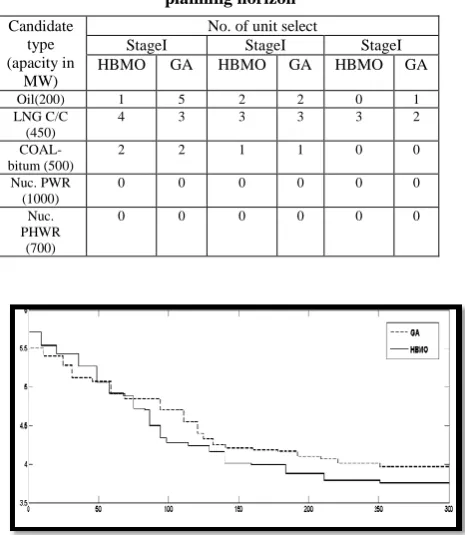
[image:6.595.51.284.359.627.2]Also, we apply GA to solve this GEP problem for comparison between HBMO algorithm and the GA. Number of new units for addition presented in table V in planning periods. The convergence characteristics comparison between HBMO algorithm and the GA used to solve this GEP problem is presented in Fig.5.
Table 5: constrained minimum solution for six-year planning horizon
Candidate type (apacity in
MW)
No. of unit select
StageI StageI StageI
HBMO GA HBMO GA HBMO GA
Oil(200) 1 5 2 2 0 1 LNG C/C
(450)
4 3 3 3 3 2
COAL-bitum (500)
2 2 1 1 0 0
Nuc. PWR (1000)
0 0 0 0 0 0
Nuc. PHWR
(700)
0 0 0 0 0 0
Fig.3: The comparison between HBMO algorithm and the GA used to solve this GEP problem.
Fig.3 shows the improvement of the HBMO over the GA. The results– best, average and worst– of the 20 different runs with their execution times are presented in Table VI. The HBMO method was stopped when the procedure completed 300 iterations.
Table V: investment costs and CPU time for GEP solution
metho d
best average worse CPU time(S ) HBM
O
3.9686e00 9
4.1654e00 9
4.3866e00 9
109
GA 3.7588e00 9
3.9588e00 9
4.1417e00 9
145
As shown in Table II, the investment costs value of HBMO is better than GA but CPU time of GA is better than HBMO.
6.
CONCLUSION
This paper demonstrates the effectiveness of genetic algorithm as an intelligent method to solve non-linear and complex problems such as GEP. Generation Expansion Planning Honey-bee mating may also be considered as a typical swarm-based approach to optimization, in which the search algorithm is inspired by the process of mating in real honey-bee. Generation expansion planning is formulated in this paper by considering some limitations. Obtained results show that HBMO is able to solve expanding generation planning better than GA.
7.
REFERENCES
[1] Kagiannas, A.G., D.T. Askounis and J. Psarras, 2004. “Power generation planning:A survey from monopoly to competition,” Int. J. Elect. Power Energy Syst., 26(6): 413-421.
[2] “Introduction to the WASP IV Model, User‟s Manual,” International Atomic Energy Agency, Vienna, Austria, Nov. 2001.
[3] X. Wang and J. R. McDonald, Modern Power System Planning. London, U.K.: McGraw-Hill, 1994, pp. 208–229.
[4] Swisher, J.N., G. de Martino Januzzi, R.I. Redlinger, 1997. “Tools and Methods for Integrated Resource Planning: Improving Energy Efficiency and Protecting the Environment”, Working Paper No. 7, UNEP Collaborating Center on Energy and Environment, Rise National Laboratory, Roskilde, Denmark.
[5] Zhu, J. and M.Y. Chow, 1997. “A review of emerging techniques on generation expansion planning”, IEEE Trans. on Power Systems, 12(4): 1722-1728.
[6] World Energy Outlook International Energy Agency: IEA, 2004.
[8] H.A. Abbass, Marriage in honey-bee optimization (MBO): a haplometrosis polygynous swarming approach, in: The Congress on Evolutionary Computation (CEC2001), Seoul, Korea, May, (2001), pp. 207–214.
[9] R.F.A. Moritz, E.E. Southwick, Bees as Superorganisms, Springer, Berlin, Germany, 1992.
[10]H.H. Laidlaw, R.E. Page, Mating designs, in: T.E. Rinderer (Ed.), Bee Genetics and Breeding, Academic Press Inc., New York, NY, 1986, pp. 323–341.
[11]R.E. Page, The evolution of multiple mating behavior by honey bee queens (Apis mellifera L.), J. Genet. 96 (1980) 263–273.
[12]H.A. Abbass, Marriage in honey-bee optimization (MBO): a haplometrosis polygynous swarming approach, in: The Congress on Evolutionary Computation (CEC2001), Seoul, Korea, May 2001, 2001, pp. 207–214.
![Fig. 1. The HBMO algorithm [12]](https://thumb-us.123doks.com/thumbv2/123dok_us/8126621.795684/3.595.312.540.419.574/fig-the-hbmo-algorithm.webp)