© 2018, IRJET | Impact Factor value: 7.211 | ISO 9001:2008 Certified Journal | Page 2833
Comparative Study of Artificial Neural Networks and Convolutional
Neural Network for Crop Disease Detection
Shantanu Kumbhar
1, Amita Nilawar
2, Manasi Nipane
3, Shruti Patil
4, Prof. B. Mahalakshmi
51,2,3,4,Student, Department of Computer Engineering, PCCOE, Pune, India
5Assistant Professor, Department of Computer Engineering, PCCOE, Pune, India
---***---Abstract -
Majority of India’s population depends on farming for the livelihood. Thus crops cultivated are of great importance for everyone. The major problem faced monitoring the health of the crops and detecting the diseases. The system studied is about detecting the diseases in an efficient and cost-effective way at an early stage. Managing quality of all agricultural plants requires keen and accurate monitoring. The emphasis is mainly on detecting the diseases through the leaves of the crops as they indicate the crop conditions more accurately.Key Words: Gaussian, HSI, GLCM, K-means, LVQ, RBF,
SOM
1. INTRODUCTION
India has great production of both fruits and vegetables. Plant diseases cause major economic and production losses and curtailment in both quantity and quality of agricultural production. Modern agriculture is now producing the maximum amount of yield with minimum expenditure of resources, energy and time to meet the needs of a massive and growing population [3].
The study focuses on early disease detection and classification in crops. The crop disease detection and classification will be done using image processing techniques of image segmentation, feature extraction, feature selection using convolutional neural network and classification using artificial neural network technique. The input images to the device are not of the satisfactory quality despite of whatever image acquisition devices are adopted. The captured image may contain noise, may be distorted depending upon the camera capturing the image which may result in interference of other object in the required image or the region of interest not being clear. Image preprocessing is the process of removing the distortion from the image. It enhances the image thus improving its accuracy for the further processing of the same. Various filtering techniques are used to remove noise and distortion from the image. Feature extraction is building a set of features for an image which will efficiently represent the information that is important for analysis and classification. When the input data i.e. the initial set to an algorithm is too large to be processed then the data is transformed into a smaller set of features which is known as feature selection. Because of the diseases, there is a change in color and texture of the affected regions of the. Thus these features can further
be used for analyzing the diseases that affect the crop. Artificial neural networks are the very versatile tools and have been widely used to tackle many issues. Artificial neural networks (ANNs) are biologically inspired computer programs designed to simulate the way in which the human brain processes information. ANNs gather their knowledge by detecting the patterns and relationships in data and learn (or are trained) through experience, not from programming. Types of learning methods: Reinforcement, Supervised and Unsupervised.
Now-a-days, convolution neural networks have achieved impressive results in the field of image classification. [5]Convolutional layers are responsible for detecting certain local features in all locations of their input images. CNN is an effective algorithm basically used for the recognition feature. The pattern recognition feature of CNN makes its efficient use in image processing and pattern recognition techniques. CNN supports some unique features like the structure is simple it has adaptability and also less training parameters.
2. Literature Survey
2.1 Image Pre-processing
[image:1.595.355.508.345.479.2]The images that are clicked with the devices may not be of good quality in spite of the device used to click image. The image that we capture using our device may be distorted or may not be clear depending on the pixel quality of the camera and even overlapping occurs sometimes resulting in area of interest not being clear. Using Image preprocessing we remove the distortion and improve the quality of the image. Image enhancement is done to improve the accuracy of the image for further processing.
© 2018, IRJET | Impact Factor value: 7.211 | ISO 9001:2008 Certified Journal | Page 2834 Filtering techniques used to remove noise from the image
are discussed below..
2.1.1 Mean or Average Filter
Mean filter is used to improve the image quality and contrast. This filter replaces each pixel of the image with the average value of the intensities of neighboring pixels. Images are smoothened by reducing the amount of intensity variation between neighboring pixels.
2.1.2 Median Filter
A median filter is used to remove salt and pepper noise. It helps to sharpen the edges of the images and also removes noise. Each pixel is replaced by the median value of its surrounding pixel. Image enhancement is done for increasing the contrast. The RGB images are converted into gray images. Then the histogram equalization is applied on the image which distributed the intensities of the images to enhance plant disease images [1].
2.2 Image Segmentation
K-means Clustering method is used to get the segmented image. K-means clustering method uses a set of features to form the clusters for getting the segmented image. ‘K’ in K-means clustering stands for the number of clusters the input image is divided into. This algorithm works as follows:
1. Initially choose ‘K’ cluster centers randomly.
2. Evaluate the distance between the randomly chosen cluster centers (in 1st step) and all the data points.
3. Assign the data point to that cluster center whose distance from the cluster center is average of all the cluster centers.
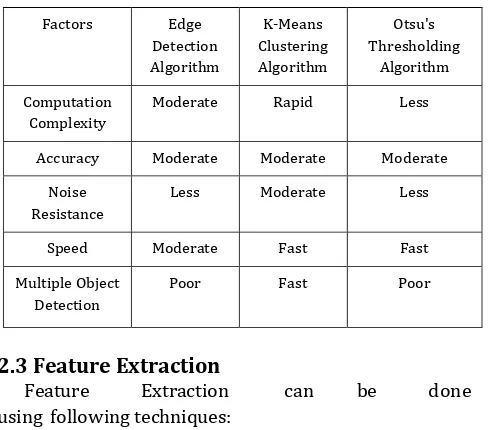
Other segmentation algorithms include Boundary detection algorithm and Otsu’s Thresholding algorithm. Boundary Detection Algorithm works by detecting the discontinuities in the brightness of the input image. In Otsu’s Thresholding algorithm, binary images are created from grey-level images. This is done by setting pixels below the computed threshold value to zero and pixels above the threshold value to one. If the leaf is infected then it will show the symptoms of the disease which can be seen by the changing color of the leaf. R, G, B components of the image are extracted. If the intensity of the green pixels is less than the threshold (computed by Otsu method) then that green pixel is removed. Reasons for choosing K-means algorithm for segmentation of the captured image are given in Table 1.
Table -1: Comparison between different segmentation algorithms
2.3 Feature Extraction
Feature Extraction can be done
using following techniques:
2.3.1 Color Feature Extraction using RGB to HSV Conversion
The RGB (red, green, blue) components are converted into HSV (hue, saturation, value) components which have a range of [0, 1]. This is used as HSV color model gives more distinguishable information than RGB color model.
The commonly used color models are RGB (red, green, blue), HSV (hue, saturation, value) and Y, Cb, Cr (luminance and chrominance). The color feature extraction based on HSI (Hue Saturation Intensity) color model is discussed in this paper. Hue color attribute describes a pure color. The Saturation component signals how much white color pollution is present in the main color or image. Intensity describes the color sensation. The Algorithm is given below:
1. The RGB image obtained from the image segmentation process in further converted into its HSI model.
2. The features Hue (H), Saturation (S) and Intensity (I) are extracted from the RGB components. 3. HSI components are used to formulate mean and
variance for the image samples.
2.3.2 Texture Feature Extraction
Every plant has a different texture. Thus texture feature analysis can be developed to detect diseases in a wide range of plants. This can be implemented using Gray-Level Co-occurrence Matrix (GLCM) to obtain textural features. It is also known as the Gray-Level Spatial Dependence Matrix.
Factors Edge
Detection Algorithm
K-Means Clustering Algorithm
Otsu's Thresholding
Algorithm
Computation Complexity
Moderate Rapid Less
Accuracy Moderate Moderate Moderate
Noise Resistance
Less Moderate Less
Speed Moderate Fast Fast
Multiple Object Detection
[image:2.595.310.554.133.348.2]© 2018, IRJET | Impact Factor value: 7.211 | ISO 9001:2008 Certified Journal | Page 2835 Then a co- occurrence matrix is developed which counts
the co-occurrence of pixels with gray values at a given distance. Various features like energy, entropy, homogeneity, correlation and inertia are extracted from the co-occurrence matrix to reduce the dimensionality of the feature set. Energy represents the sum of squared elements of GLCM. Homogeneity represents closeness among the distribution of elements [2]. The algorithm is given below:
1. The RGB image is converted into its gray-scale image.
2. A Gray-level co-occurrence matrix is developed from the gray-scale image.
3. Features like energy, entropy, homogeneity, correlation and inertia are extracted from the co-occurrence matrix.
Above mentioned techniques when compared it is observed that among color and texture feature extraction, texture feature extraction is more accurate and feasible. The computation complexity in texture feature extraction is more than color feature extraction. The accuracy of computation in color feature extraction is 70-80% while in texture feature extraction it is 80-90% [4].
Using color-texture method together more accurate results are obtained. Thus first conversion of RGB values to gray-scale image and then performing texture feature extraction can be considered as the best method for processing the image. Thus classifying the diseases can be made easier using these features.
2.4 Artificial Neural Network
2.4.1 FFNN
Feed-forward neural networks (FFNN) is one of the popular architecture among artificial neural networks. FFNN solves complex problems by modeling complex input-output relationships. A feed forward neural network is an artificial neural network wherein connections between the units do not form a cycle. The artificial neuron in FFNN transmits information in forward direction without forming a loop. In this network, the information moves in forward direction only, from the input nodes, through the hidden nodes and to the output nodes.
Three types of functions can be used as activation function in FFNN:
1. Threshold function 2. Piecewise Linear function 3. Sigmoid function
Advantages of FFNN:
1. Fixed computation time 2. Computation Speed is very high 3. Fault tolerant
4. Learns general solutions
5. Can learn from noisy and incomplete data 6. Can be taught to compensate for system changes
2.4.2 LVQ
It can be used when we have labeled input data. It is a supervised version of vector quantization.
LVQ is a special case of an ANN; it makes use of winner-take-all Hebbian learning-based approach. In this training algorithms one determines the prototype which is closest to the input according to a given distance measure and it is chosen for each data point. The winner is moved closer if it correctly classifies the data point or it is moved away if it classifies the data point incorrectly.
2.4.3 RBF
A radial basis function (RBF) is a real valued function used for activation whose value depends only on the distance from the origin. In RBF, the activation of hidden units is based on the distance between the input vector and a prototype vector. This distance is determined generally by Euclidean distance. Then it fits a linear model with Coefficients to the hidden layer outputs with respect to some objective function.
Performance Analysis:
To measure the quality of the classified diseased leaf images the performance is analyzed by using following parameters:
1. Accuracy: The accuracy (AC) is the proportion of the total number of predictions that were correct.
2. Precision: Precision (P) is the proportion of the predicted positive cases that were correct.
3. Recall ratio:
The recall or true positive rate (TP) is the proportion of positive cases that were correctly identified.
© 2018, IRJET | Impact Factor value: 7.211 | ISO 9001:2008 Certified Journal | Page 2836
[image:4.595.35.293.156.371.2]2.5 Convolutional Neural Networks
Table -2: Comparison between FFNN, RBF and LVQ
The convolutional network has three layers. These three layers are:
1. Input Layer: The input image of the crop is captured in this layer for the further processing and detection.
2. Feature extraction layer: The feature extraction layer in the CNN extracts the local features. After they a r e extracted the relationship between the other features is determined.
3. Feature map: In this layer each unit which is to be computed in the network is composed to multiple feature maps. Every feature map is a plane in which the weights of all neurons are equal. The structure of feature map uses the sigmoid function as activation function.
The features are extracted from the image of the leaf captured and the gradient of the neurons are calculated i.e. the square of their differences.
The CNN contains the convolutional layers.
The main role of CNN is to detect the particular local features found in all the locations of the input image. In the channels
of the input image a small subset of connected neurons which are s p a t i a l , are connected to each node in the convolutional layer.
For searching the similar local feature throughout the complete input channels, there are some connection weights present which are shared amongst the nodes in the convolutional layers.
There are some shared weights present in the convolutional layers. These shared weights are known as kernel or a convolutional kernel.
CNN Algorithm is given below:
1. The CNN is composed of combining these two steps of Algorithm of Artificial neural Network followed Set of operations known as convolutions. 2. There are set of elements and these elements are
represented by a set of inputs X=(x1, x2, x3…xn).
3. The inputs and the activation function are connected with the help of set of weights.
Ω = (w1, w2, w3…wn)
Besides this set of weights we have letter b as bias. After these steps applying the output of the activation function the equation obtained is:
[image:4.595.306.558.482.695.2]Z = f (∑ xi * wi + b)
Table -3: Comparison between ANN and CNN
Parameter ANN CNN
Type Traditional method
of performing ANN Consists of some advance layers in the traditional Neural Network
Success Rate High comparatively more
than ANN
Scalability Lower Higher
Neuron Connectivity Fully connected Partially connected
Layers Has two basic layers
as Input & Output
Along with the two basic layer it consists of Convolution & Pooling layers Dimensional
Structure of neurons 1D to 3D 3D Neuron Volume
Computational Cost Low High
Amount of training
data required Depends upon problem statement complexity
Large
3. CONCLUSIONS
Thus plant disease detection by means of image processing has been presented in the literature survey. Initial steps of the process include crop image preprocessing which consists
Parameter FFNN RBF LVQ
Accuracy Higher Intermediate Lower
Recall Ratio Slightly lower than LVQ
Higher than FFNN and LVQ
Intermediate
Precision Highest Intermediate Slightly lower
than RBF
F_measure Higher Intermediate Slightly lower
than RBF Computation
Speed
Very High Fast Not much high
Fault Tolerant
Yes Not that good Better
Noise Tolerant
Less precise solution
Strong input noise tolerance
With a noise tolerance injection Generalizatio
n Ability
Good Good Good
Design Simplicity
Very simple Easy design Simple
[image:4.595.47.275.614.691.2]© 2018, IRJET | Impact Factor value: 7.211 | ISO 9001:2008 Certified Journal | Page 2837 of image filtering and segmentation which can be achieved
using various algorithms but K-means clustering is most preferred over the others due to its advantages over other algorithms. The segmented leaf texture is retrieved by color and texture features which are locally invariant in nature and therefore provide a good module. The extracted pattern is then classified into healthy or diseased classes respectively. By comparative study of various mentioned parameters, it is concluded that CNN is most efficient than other techniques for disease classification and thus above study can be used to build a system for efficient disease detection of crops.
REFERENCES
[1] Dr.K.Thangadurai, K.Padmavathi, “Computer
Visionimage Enhancement For Plant Leaves Disease Detection”, 2014 World Congress on Computing and Communication Technologies.
[2] Bhumika S.Prajapati, Vipul K.Dabhi, Harshadkumar
B.Prajapati - “A Survey on Detection and Classification of Cotton Leaf Diseases”, International Conference on Electrical, Electronics, and Optimization Techniques (ICEEOT) - 2016.
[3] Harshal Waghmare, Radha Kokare, Yogesh Dandawate -
“Detection and Classification of Diseases of Grape Plant Using Opposite Color Local Binary Pattern Feature and Machine Learning for Automated Decision Support System”.
[4] Jagadeesh D. Pujari, Rajesh Yakkundimath, Abdulmunaf
S.Byadgi - “Identification and Classification of Fungal disease Affected on Agriculture/Horticulture Crops using Image Processing Techniques”, 2014 IEEE International Conference on Computational Intelligence and Computing Research.
[5] Ossama Abdel-Hamid, Abdel-rahman Mohamed, Hui
Jiang, Li Deng, Gerald Penn, and Dong Yu.” Convolutional Neural Networks for Speech Recognition”, IEEE/ACM TRANSACTIONS ON AUDIO, SPEECH, AND LANGUAGE PROCESSING, VOL. 22.
[6] NimaTajbakhsh, Member, IEEE, Jae Y. Shin, Suryakanth
R. Gurudu, R. Todd Hurst, Christopher B. Kendall, Michael B. Gotway, and Jianming Liang*, Senior Member, IEEE,” Convolutional Neural Networks for Medical Image Analysis: Full Training or Fine Tuning?”, IEEE TRANSACTIONS ON MEDICAL IMAGING, VOL. 35.
[7] K. Muthukannan 1, P. Latha 2, R. Ponselvi 1 and P.