Journal of Chemical and Pharmaceutical Research, 2015, 7(9):88-99
Research Article
CODEN(USA) : JCPRC5
ISSN : 0975-7384
Formulation development and optimization of controlled release
microspheres of Aceclofenac using response surface methodology
Ketan J. Patel
1* and Abhay Dharamsi
21Department of Pharmaceutical Technology, Shree Krishna Institute of Pharmacy, Shankhalpur, Gujarat-India
2Parul Institute of Pharmacy, Vadodara, Gujarat-India
_____________________________________________________________________________________________
ABSTRACT
The purpose of present study was to develop controlled release microspheres for oral delivery of Aceclofenac. The microspheres were prepared by Oil-in-Oil (O/O) emulsion solvent evaporation technique using polymer blend of HPMCP and ethyl cellulose. D-Optimal response surface design was used to statistically optimize the effect of drug polymer ratio and stirrer speed on selected variables of microspheres. The results showed that size of microspheres were from 81.08 to 192.5µ depending on the experimental condition. The encapsulation efficiency was achieved as high as 89.71%. The SEM study indicated that the microspheres from the optimized batch were of rough surface. The in-vitro release study showed that the microspheres gave biphasic release where microspheres showed negligible release in 0.1N HCl and gave extend release up to 24h in phosphate buffer pH 6.8. The accelerate stability study indicated that the formulation was stable.
Keywords: Microspheres, Controlled release, Aceclofenac, Surface plot.
_____________________________________________________________________________________________
INTRODUCTION
The treatment of disorders like Osteoarthritis, Rheumatoid arthritis and Ankylosing spondylitis require chronic usage of Non-steroidal Anti Inflammatory Drug (NSAID) resulting in a high risk of gastrointestinal toxicity and injury. NSAID treatment has been an absolute requirement for patients with these disorders requiring pain relief. The only possible management includes a prophylactic therapy with a proton pump inhibitors to reduce symptoms. Therefore novel drug delivery systems with less or no side effects should be selected for a safer treatment. [1]
Aceclofenac, 2-{2-[2-(2,6-dichlorophenyl)aminophenyl]-acetyl}oxyacetic acid, is a novel Non-steroidal Anti Inflammatory Drug(NSAID). It is well tolerated NSAID and has lower incidence of gastrointestinal adverse effects as compared to diclofenac It is widely used for the treatment of Osteoarthritis, Rheumatoid arthritis and Ankylosing spondylitis. The usual dose of Aceclofenac is 100 mg twice daily. It exhibit plasma-elimination half-life of 4 hours. Aceclofenac is rapidly and completely absorbed following oral administration.[2-3]
The short biological half-life and dosing frequency of more than one time a day make it an ideal candidate for modified release formulation.
The solvent evaporation method is popularly used for microsphere preparation because of its simplicity, reproducibility, and fast processing with minimum controllable process variables that can be easily implemented at the industrial level. [5]
Statistical Models are extensively used in the diversified area to strength the art of the drug formulation. Response surface methodology (RSM) is used to develop, to improve, or to optimize a product or process. [6]
Hence the objective of present study was to develop controlled release microspheres loaded with Aceclofenac and optimized the same using Response surface methodology.
A D-Optimal Response surface design was employed to statistically optimize the formulation of microspheres loaded with Aceclofenac. In the present investigation the Polymer: Drug ratio (X1) and the stirrer speed(X2) were selected as independent variables and % entrapment efficiency(Y1), mean diameter of microspheres (µ)(Y2) and Q16h(Y3)i.e. % drug releases at 16 hours from microspheres were chosen as dependent variables. The levels of these
two parameters were determined from the preliminary trials.
EXPERIMENTAL SECTION
Aceclofenac was obtained as gift sample from Spansule Pharmaceutical Hyderabad. Hydroxy Propyl Methyl Cellulose Phthalate, HP 55 grade (HPMCP) was received as gift sample from Deepak Cellulose PVT Ltd.,Vapi Gujarat, India. Ethyl cellulose was obtained from Colorcon Asia Pvt. Ltd., Goa, India. All other ingredients used in the preparation and evaluation of microspheres were of either reagent grade or analytical grade.
METHOD OF PREPARATION[7]:
The Aceclofenac loaded controlled release microspheres were prepared by O/O emulsion solvent evaporation method. The microspheres were prepared by dissolving drug in polymers solution which was prepared previously by dissolving ethyl cellulose and HPMCP 55 in solvent mixture of Acetone: Methanol (80:20). This solution was added to continuous phase – light liquid paraffin containing Span 80 as an emulsifying agent. The mixture was then agitated with mechanical stirrer (Remi, India) with the different stirring speed for 3-4 hours. Then add n-Hexane to the above content to harden the microspheres formed. The harden microspheres were allowed to settle at bottom and decant supernant leaving the microspheres into the beaker. Wash the microspheres thoroughly with n-hexane to remove oil from the microspheres. Wash the microspheres thoroughly with water to remove any solvent from the microspheres. The microspheres were dry at room temperature (250C & 60 % RH) for 72 hours. The microspheres
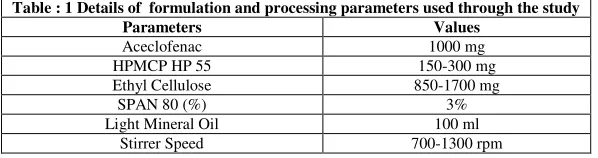
[image:2.612.158.457.508.587.2]thus obtained was subjected to different evaluation parameters like particle size distribution, morphology, entrapment efficiency, in vitro dissolution study and stability study. The details of formulation along with variables are summarized in table 1.The trials for preparation of Aceclofenac were performed in random order. The full factorial design and layout with coded and actual values of variables for each batch are shown in table 2.
Table : 1 Details of formulation and processing parameters used through the study
Parameters Values
Aceclofenac 1000 mg
HPMCP HP 55 150-300 mg
Ethyl Cellulose 850-1700 mg
SPAN 80 (%) 3%
Light Mineral Oil 100 ml
Stirrer Speed 700-1300 rpm
RESPONSE SURFACE METHODOLOGY:
Data collected for the responses in each run were analyzed using the Design Expert software (STAT-EASE, design expert, 7.0.3.) and fitted into second order polynomial model to correlate relationship between independent variables and responses. The results are expressed as second order polynomial equation of the following form
Yi= b0+b1X1+ b2X2+b12X1X2+b11X12+ b22X22 (1)
Where, bi is the estimated coefficient for the factor Xi, while Yi is the measured response. The b0 is the arithmetic
the b11& b22are quadratic effects. A comparison between the experimental and predicted values of response is
present in term of %biasto assess the reliability of the model. Bias was calculated by equation 2
% Bias = (2)
EVALUATION OF MICROSPHERES:
PERCENTAGE YIELD[8] :
The percentage yield was calculated using the formula as shown in equation 3:
% Yield = ! !
" ! !× 100 (3)
The practical weight microspheres is the weight of microspheres observed after its complete drying and the theoretical weight of microspheres is the expected weight of microspheres i.e. total weight of polymers and drug.
DRUG ENTRAPMENT EFFICIENCY[9] :
The amount of Aceclofenac entrapped within the microspheres was determined by suspending powdered microspheres in phosphate buffer pH 6.8. After 24 hours the solution was filtered and the filtrate was analyzed spectrophotometrically(UV 1800, Shimadzu, Japan) at 276 nm for Aceclofenac content. The % Entrapment Efficiency (%E.E.) were calculated using equation 4:
%E.E.= ! !
" & ! !×100 (4)
Theoretical drug loading is theoretical amount of drug in the microsphere calculated from quantity added during the fabrication process.
MORPHOLOGY AND PARTICLE SIZE[10-11] :
The morphology of microspheres was observed visually under microspheres and photomicrograph (Olympus, India) was taken. Particle size analysis of Aceclofenac loaded microspheres was performed by optical microscopy (Labomed, Vision 2000, USA). The particle size of approximately 300 microspheres was measured randomly using a calibrated ocular micrometer (ERMA, Japan).The average particle size was determined by using the Edmondson's equation, DMean = Σnd/Σn,
Where n= number of microspheres observed and d= Mean size range. The process was repeated 3 times for each batch prepared.
SCANNING ELECTRON MICROSCOPY:
The shape and surface of Aceclofenac loaded microspheres from the optimized batch were examined by Scanning Electron Microscope (Philips XL 30 E). Scanning electron photomicrograph (SEM) was taken at the acceleration voltage of 10 KV, chamber pressure of 0.8 Torr, at different magnification.
Table : 2 32 Full factorial experimental design layout with actual levels and Coded levels of variables for Aceclofenac Microspheres
Formulation code Actual Level Coded Level Actual Level Coded Level Factors → Polymer : Drug Ratio X1 Stirrer Speed (RPM) X2
J1 1:1 -1 700 -1
J2 1:1 -1 1000 0
J3 1:1 -1 1300 +1
J4 1:1.5 0 700 -1
J5 1:1.5 0 1000 0
J6 1:1.5 0 1300 +1
J7 1:2 +1 700 -1
J8 1:2 +1 1000 0
FOURIER TRANSFORM INFRARED SPECTROSCOPY:
FTIR spectra of pure drug, pure polymers and formulations containing both drug and polymers were performed to study the drug polymer interaction. Infrared spectra of the samples were recorded using Fourier transformed infrared spectrophotometer(Shimadzu, Japan) at room temperature (25 0C) in the solid state by the KBr disc method over the
wavenumber range of 2,000–400 cm−1.
DIFFERENTIAL SCANNING CALORIMETRY (DSC)
The physical state of drug in the microspheres was analyzed by Differential Scanning Calorimeter. The pure drug and formulation were subjected to differential scanning calorimeter (DSC-60, Shimadzu, Japan). The thermo grams of the samples were obtained at a scanning rate of 10 °C/min conducted over a temperature range of 25-300 °C.
DRUG RELEASE STUDIES[12]:
The in vitro dissolution study was performed using USP type – II apparatus(DBK, India) rotated at constant speed of
100 rpm. The release study was examined for 24 hours in two different buffers namely pH 1.2 for first two hours and phosphate buffer pH 6.8 for the balance time. Amount of microspheres equivalent to 200 mg of Aceclofenac were transferred to dissolution media. The dissolution medium was maintained at 37 ºC ±0.5 ºC. Aliquots of samples were withdrawn at predetermined time interval and the same volume was replaced immediately by fresh medium. The sample withdrawn was filtered through 0.45µ Whatmann filter paper and the filtrate was diluted suitably if required &analyzed for Aceclofenac by UV- spectrophotometrically at 276 nm.(n=3)
RELEASE KINETICS[13]:
Data obtained from in vitro release studies were fitted to various kinetics models using DDSolver – an add-in program for Microsoft Excel to find out the mechanism of drug release from microspheres. The kinetics models used were zero order, first order, and Higuchi models. The rate constants were also calculated for the respective models.
STABILITY STUDY[14] :
Aceclofenac loaded microspheres from the optimized batch were filled into tightly closed glass vials and subjected to stability testing according to ICH guidelines. The packed container of the microspheres was kept under accelerated condition of 40±2°C/75±5% RH in a programmable stability chamber (Remi Instruments, India) for a period of six months. The samples (n=3) were analyzed at intervals of 0, 3 and 6 months and evaluated for physical appearance, particle size, drug content and drug release studies particularly Q16h. Physical appearance was evaluated
by visual observation. The other evaluations were performed as per procedure stated as above.
RESULTS AND DISCUSSION
It is observed in the preliminary trials(not shown) that non-spherical, non-uniform and bigger microspheres content obtained when speed of stirrer was less than 700 RPM. This might be due to insufficient shear force required to break the dispersed phase into desired size and shape of droplets. When stirrer speed was higher than 1300RPM the content from the container expelled out& also adhered to the container wall due to generation of high turbulence by the stirrer at that speed. This resulted in loss of content. Hence stirrer speed was selected in the range of 700-1300 rpm throughout experimental study. Combination of solvents was used as it facilitated rapid solubilization of polymers. Span 80 was selected as an emulsion stabilizer. Polymer: Drug ratio less than 1:1 may not give desired release rate microspheres. Hence polymer: drug ratio was selected 1:1 to 2:1 to optimize further. The combination of two polymers was used to prepare & obtained microspheres desired release rate.
The result from preliminary study (Not shown) indicated that the microspheres with higher concentration of HPMCP failed to achieve release up to 24 hours. This might be because of the structure integrity of microspheres matrix lost on removal of HPMCP by dissolution. This in turn cause breakdown of microspheres &released the encapsulated drug. Hence microspheres released drug quickly.
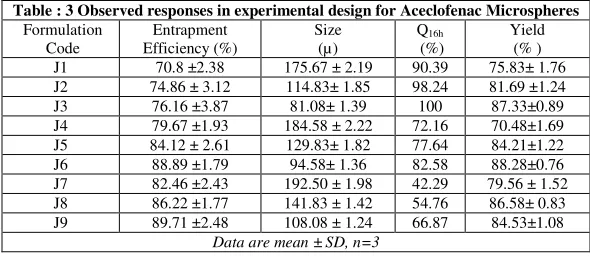
Table : 3 Observed responses in experimental design for Aceclofenac Microspheres Formulation
Code
Entrapment Efficiency (%)
Size (µ)
Q16h (%)
Yield (% ) J1 70.8 ±2.38 175.67 ± 2.19 90.39 75.83± 1.76 J2 74.86 ± 3.12 114.83± 1.85 98.24 81.69 ±1.24 J3 76.16 ±3.87 81.08± 1.39 100 87.33±0.89 J4 79.67 ±1.93 184.58 ± 2.22 72.16 70.48±1.69 J5 84.12 ± 2.61 129.83± 1.82 77.64 84.21±1.22 J6 88.89 ±1.79 94.58± 1.36 82.58 88.28±0.76 J7 82.46 ±2.43 192.50 ± 1.98 42.29 79.56 ± 1.52 J8 86.22 ±1.77 141.83 ± 1.42 54.76 86.58± 0.83 J9 89.71 ±2.48 108.08 ± 1.24 66.87 84.53±1.08
Data are mean ± SD, n=3
Response Surface Methodology:
The selected Response variables were used with the selected independent variables to generate predictor equation for Aceclofenac microspheres. The significant factors in the equations were selected using a Backward Elimination Regression for the calculation of regression analysis. The terms of full model having insignificant p value (p > 0.1) have negligible contribution hence they were neglected. The results of multiple regression analysis and analysis of variance for full as well as reduced model are summarized in table 3
The % entrapment efficiency, mean diameter and Q16h show R2 value of 0.9853, 0.9992 and 0.9929 respectively;
indicating good fit and it was concluded that the second-order model adequately approximated the true surface.
For entrapment efficiency, size and Q16h, the calculated F value of 111.94, 1278.60 and 234.01 respectively were
found to be greater than the critical F value of 5.41, 6.39 and 5.41 respectively and hence it may be concluded that the variables contribute significantly in the regression.
The interaction term for the % entrapment efficiency shows the insignificant value (P>0.05) of source of sum hence it was eliminated in reduced model. The calculated value of F for interaction term of mean diameter and Q16h was
found to be 10.06 &7.73 respectively. The critical value of F is 7.71 and 6.61 respectively. Since the calculated value of F is higher than the critical value, it was concluded that the interaction significantly contributed for prediction of mean diameter and Q16h in the Aceclofenac microspheres.
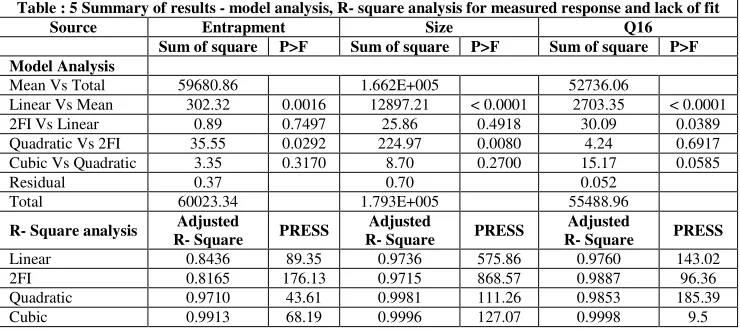
The calculation of various statistical parameters and selection of polynomial models for selected responses done on the basis of the statistical parameters were performed by the design expert software. The calculated statistical parameters are shown in table 4.
As presented in the table 5, based on the smallest vale of PRESS statistics, quadratic model was suitable statistical model for entrapment efficiency and size (PRESS value 43.61 for Y1 & 111.26 for Y2) while 2FI model was suitable statistical model for Q16h (PRESS value 96.36 for Y3).
The fitted model for the selected response variables are shown in eq. 5to Eq.7.
%Entrapment Efficiency(Y1) =84.23 +6.10 A + 3.64 B - 4.19 A2 (5)
Size(Y2) =128.83 +11.81 A – 44.84 B – 2.54 AB + 10.58 B2 (6)
Q16h (Y3) =77.79 - 20.12 A + 6.77 B + 2.74 AB (7)
The regression equation for % drug entrapment efficiency (Y1) and size (Y2) show positive effect while Q16h shows
negative effect of polymer: drug ratio(X1). This indicated that Y1 and Y2 increased as the X1 increased from 1:1 to 2:1, while Y3was decreased.
Table: 4 Regression analysis data for measured responses Coefficients Entrapment Size Q16h
Full Reduced Full Reduced Full Reduced b0 84.53 84.23 129.27 128.83 77.79 76.55 b1 6.10 6.10 11.81 11.81 -20.12 -20.12 b2 3.64 3.64 -44.84 -44.84 6.77 6.77 b12 0.47 -- 2.54 2.54 2.74 2.74 b12 -4.19 -4.19 -0.67 -- -1.37 -- b22 0.45 -- 10.58 10.58 -0.50 -- R2 0.9891 0.9853 0.9993 0.9992 0.9945 0.9929
F 54.59 111.94 839.42 1278.60 107.88 234.01
The regression equation for Y2 shows negative effect of interaction term while Y3 shows positive effect of interaction term. The interaction term was eliminated for response Y1.The quadratic term for X1 and X2 shows curvilinear relationship for response Y1 and Y2 respectively.
The contribution of each independent variable for the optimization of given dependent variables was identified by magnitude of co efficient. As indicated by the break-up of source of sum of squares in ANOVA for optimization of Y1, factor X1 was contributed higher than the factor X2(SSY1 = 222.89; SSY2 =79.42) while For optimization of Y2, the contribution of factor X2 was much higher than factor X1 (SSY1 = 836.15; SSY2 =12061.06) and for
optimization of response Y3 contribution of factor X1was much higher than the factor X2(SSY1 =2428.48; SSY2 =
274.86).However, It is apparent from magnitude of coefficients for X1 and X2 that both the factors have important contribution for optimization of term Y1.
Table : 5 Summary of results - model analysis, R- square analysis for measured response and lack of fit
Source Entrapment Size Q16
Sum of square P>F Sum of square P>F Sum of square P>F Model Analysis
Mean Vs Total 59680.86 1.662E+005 52736.06
Linear Vs Mean 302.32 0.0016 12897.21 < 0.0001 2703.35 < 0.0001 2FI Vs Linear 0.89 0.7497 25.86 0.4918 30.09 0.0389 Quadratic Vs 2FI 35.55 0.0292 224.97 0.0080 4.24 0.6917 Cubic Vs Quadratic 3.35 0.3170 8.70 0.2700 15.17 0.0585
Residual 0.37 0.70 0.052
Total 60023.34 1.793E+005 55488.96
R- Square analysis Adjusted
R- Square PRESS
Adjusted
R- Square PRESS
Adjusted
R- Square PRESS Linear 0.8436 89.35 0.9736 575.86 0.9760 143.02
2FI 0.8165 176.13 0.9715 868.57 0.9887 96.36
Quadratic 0.9710 43.61 0.9981 111.26 0.9853 185.39
Cubic 0.9913 68.19 0.9996 127.07 0.9998 9.5
Polymer: drug ratio at middle level (X1, 0) and higher level of stirrer speed (X2, +1) yielded microspheres which attained the release of 82.58% in 16 hours which was closed to expect value of release 80% and release the drug up to 24 hours. Also these microspheres with better entrapment efficiency (88.89%) and smaller size(94.58µ). When X1 was set at higher (+1) or lower level (-1) the microspheres showed lower or higher drug release than expected. The entrapment efficiency was found higher at higher level of factor X1 (X1 +1), but at this level the microspheres fails to attained 80% release in 16 hours. Moreover the size of microspheres also found higher. When X1 at lower level (X1, -1) it showed higher release of drug also it showed lower entrapment efficiency.
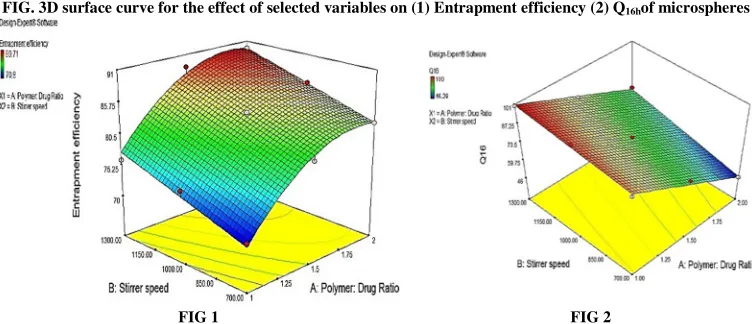
Contour plots show that various combinations of X1 and X2 may satisfy specific requirement of maximum entrapment efficiency, minimum size and expected Q16h for the Aceclofenac microspheres while taking into
[image:6.612.122.492.330.495.2]FIG. 3D surface curve for the effect of selected variables on (1) Entrapment efficiency (2) Q16hof microspheres
[image:7.612.118.494.73.235.2]FIG 1 FIG 2
FIG 3: 3D surface curve for the effect of selected variables on Size
Fig 1, 2 and 3 represents the response surface plot which shows the effect of X1 and X2 on entrapment efficiency, Q16h and size respectively.
To confirm the validity of the model, three batches of microspheres were prepared using these variables and entrapment efficiency, mean particle size and Q16hwas determined. The results (n=3) observed that drug entrapment
efficiency, mean particle size and Q16h were 88.24 ±1.03 %, 98.03 µ ±1.21 and 80.42 ± 0.92 respectively. The
predicted response was found to be 88.88%, 97.74 and 80 respectively validating the model in this study. The desirability value of predicted response was found 0.965.
EVALUATION OF MICROSPHERES:
The influence of different condition on yield of microspheres was evaluated. The yield obtained for batch J1 to J9 is shown in table 3. The yield was found more than 70% for all experimental batches. The yield of microspheres was improved as the polymer: Drug ratio increased from 1:1 to 1:2. The lower percentage yield of microspheres would be attributed to losses occurring during various steps of processing such as sticking of polymer solution to the glass container & loss of microspheres during washing.
The maximum Entrapment efficiency was achieved 89.71 % for experimental batches. The difference between theoretical and measured value is likely due to the loss of Aceclofenac during washing.
The entrapment efficiency was increased with increasing the concentration of polymer. This may due to increase in the viscosity of internal phase. This reduced the escaping of drug in the external phase and ultimately enhances the entrapment efficiency.[15]
[image:7.612.224.392.264.398.2]rapid phase inversion of nascent polymer droplets by rapid stirring minimize the redistribution of encapsulated drug. These may eventually enhanced the entrapment efficiency.[16-17]
The mean diameters was found in the range of 81.06 μ to 192.50 μ. As it is shown in the table 3that by increasing the rate of stirring from 700 rpm to 1300 rpm, the mean diameter of microspheres decreased. Also the microspheres obtained at higher speed have narrow size distribution. This may be due to fact that the higher speed of the stirrer may provide the shear force required to break down the polymeric phase into the smaller droplets.[18]
Increasing the concentration of polymer in the internal phase was resulted in the formation of bigger microspheres. This observation may be attributed to presence of the higher concentration of polymer produced higher viscosity of the internal phase. The higher viscosity makes coalescence of the emulsified droplets easier. Moreover, the higher the viscosity of internal phase the greater the amount of the energy required breaking down the droplets into smaller particles. Eventually it may produce larger droplets.[19]
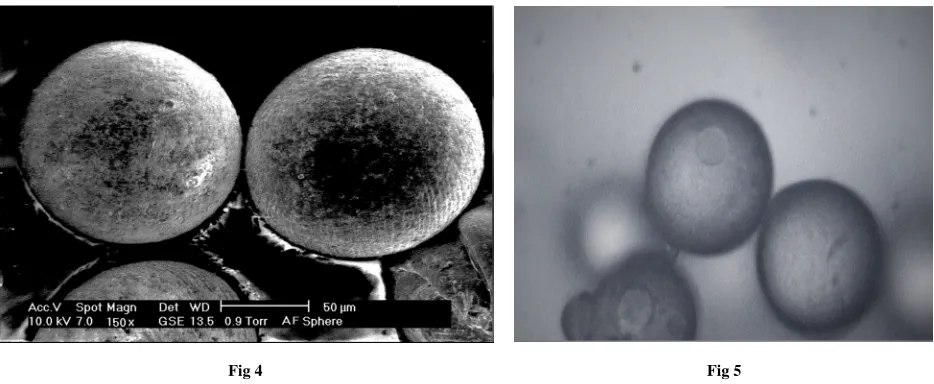
The photographs of the optimized formulation taken by Scanning Electron Microscope (Figure4.) and microphotograph (Fig 5) The SEM photographs revealed that the microspheres of Aceclofenac were discrete, regular, spherical, and a rough outer surface morphology. The Surface roughness might be due to high evaporation rate of the solvent during formation of microspheres.
Fig. Scanning electron microscope and Microphotograph of microspheres
Fig 4 Fig 5
[image:8.612.73.540.306.498.2]From the FTIR spectra (Fig. 6)of pure drug and the microspheres, it was observed that all characteristic peaks of Aceclofenac were present in the spectra of microspheres. The results of IR spectra indicated the absence of any well-defined interaction between drug and the carrier. Thus indicating the compatibility of the drug with the polymers.
[image:8.612.76.523.556.718.2]The characteristic peaks from the spectrum of Aceclofenac are given in table 6.
Table : 6 Characteristic peaks of Aceclofenac FTIR Spectra Characteristic group Peak (Cm-1)
-C=O 1771.69
-COOH 1714.79
C-Cl 750.34
C-O-C 1149.63
O-H bonding 1248
Substituted phenyl ring 860.29 & 760 C=C ring stretching 1589.41 and 1490
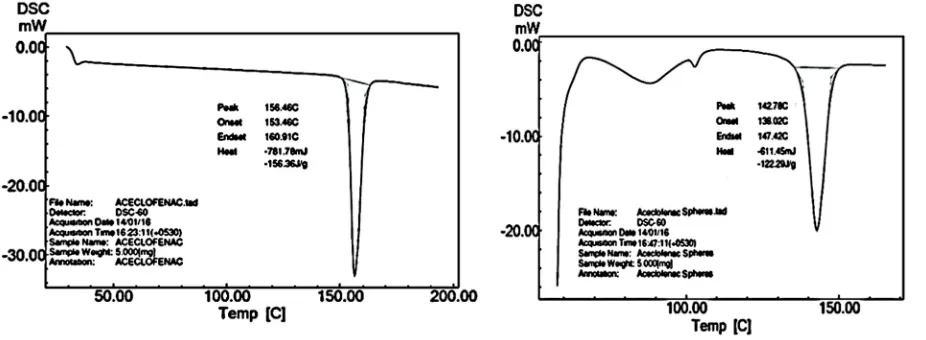
DSC pattern for Aceclofenac and its microspheres are shown in fig. 7a and 7b respectively. In the DSC study, pure Aceclofenac showed a sharp endotherm at 156.46 0c corresponding to its melting point. There was no appreciable
change in the melting endotherm of microspheres compared to that of pure drug (142.780C)The DSC results (Fig. 7a
[image:9.612.72.535.480.650.2]and 7b) also revealed little amorphization of Aceclofenac when prepared in the form of microspheres. This is evident by an increase, although little, in the enthalpy changes of microspheres when compared with that of pure drug (pure Aceclofenac= -156.36 J/g; Microspheres = -122.29 J/g).
Fig.7a and & 7b DSC of Aceclofenac and microspheres loaded with aceclofenac
.
.
.
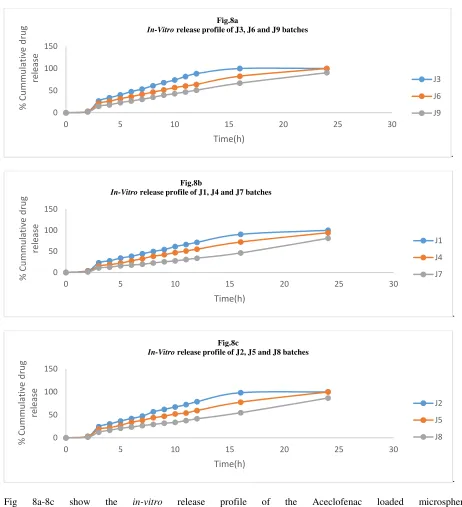
Fig 8a-8c show the in-vitro release profile of the Aceclofenac loaded microspheres drug from the microspheres. The fig shows that the microspheres from all the batches shows biphasic release
pattern. The microspheres showed burst release after 2 hours in 6.8 pH phosphate buffer and negligible release up to 2 hours. This was due to presence of pH-dependent HPMCP which dissolved above its threshold of pH 5.5.
The batches J4, J5, J7, J8 and J9 shows drug release 72.16%, 77.64%,46.29%,54.76% and 66.86% respectively in 16 hours which were unable to meet the criterion of 80% drug release in 16 hours. While batches J1, J2 &J3 shows drug release 90.39%, 98.24% and 100% respectively in 16 hours. In case of Batch J7, J8 and J9 the slower release was probably due to more weight gain of release retardant polymer Ethyl cellulose while in case of batches J1, J2 &J3 faster release was probably due to insufficient polymer level of release retardant polymer to achieve desired release rate.
0 50 100 150
0 5 10 15 20 25 30
% C u m m u la ti v e d ru g re le a se Time(h) Fig.8a
In-Vitro release profile of J3, J6 and J9 batches
J3 J6 J9 0 50 100 150
0 5 10 15 20 25 30
% C u m m u la ti v e d ru g re le a se Time(h) Fig.8b
In-Vitrorelease profile of J1, J4 and J7 batches
J1 J4 J7 0 50 100 150
0 5 10 15 20 25 30
% C u m m u la ti v e d ru g re le a se Time(h) Fig.8c
In-Vitro release profile of J2, J5 and J8 batches
J2
J5
[image:10.612.68.530.64.571.2]The batch J6 shows drug release 82.58% which meets the criterion of 80 % drug release in 16 hours. This batch showed desired release profile suitable for sustained release system. The batch J4 and J5 did not meet the criterion even though made of same composition as batch J6. This might be due to effect of their larger particle size than J6. Due to larger particle size the surface was decreased compared to smaller particle size and resulted into lower release of drug at same composition.
Mean Dissolution Time (MDT) is a measure of the rate of the dissolution process. The higher the MDT, the slower the release rate.[20] MDT The results depicted that MDT was higher as the polymer drug ratio increased from 1:1 to 2:1 this indicated that the in vitro release rate decreased. Further it was indicated that not only polymer level but size of the microspheres was important to achieve desired release rate 1.5:1. MDT for all batches is shown in table 7.
Table 7 Mean Dissolution Time of experimental Batches
Evaluation Parameters J1 J2 J3 J4 J5 J6 J7 J8 J9 MDT(h) 8.67 7.70 6.87 10.78 10.44 9.68 13.25 12.29 11.07
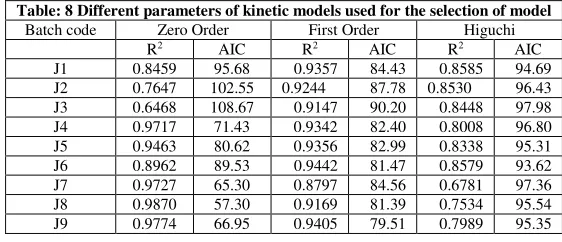
The dissolution data obtained were fitted to various kinetic models using DDSolver – an add-in program for Microsoft Excel. DDSolver was used for modeling and comparison of drug dissolution profiles. Amongst different criteria available in DD Solver, the coefficient of determination (R2) and the AIC (Akaike Information Criterion)
was selected for evaluating the goodness of fit of a model. When comparing two models with different numbers of parameters, the model with a lower AIC value can be considered to be the better model.[21]
The results indicated (table 7) that no batches were followed the highuchi model as shown in table by lowest R2 and
larger AIC for all the batches. The dissolution profile that does not follow the higuchi model is considered to exhibit drug release controlled not only by diffusion but also by erosion of matrix. Drug release probably occurs not only by diffusion from insoluble matrix but also by erosion of insoluble matrix.[22]
[image:11.612.164.445.412.533.2]The result depicted that Batch J6, J7, J8 and Batch J11 followed first order release kinetics, while Batch J9, J10 and Batch J12 to J14 followed zero order release kinetics. This observation is supported by the high value of correlation co efficient obtained in all cases where dissolution data were fitted to respective model.
Table: 8 Different parameters of kinetic models used for the selection of model Batch code Zero Order First Order Higuchi
R2 AIC R2 AIC R2 AIC
J1 0.8459 95.68 0.9357 84.43 0.8585 94.69 J2 0.7647 102.55 0.9244 87.78 0.8530 96.43 J3 0.6468 108.67 0.9147 90.20 0.8448 97.98 J4 0.9717 71.43 0.9342 82.40 0.8008 96.80 J5 0.9463 80.62 0.9356 82.99 0.8338 95.31 J6 0.8962 89.53 0.9442 81.47 0.8579 93.62 J7 0.9727 65.30 0.8797 84.56 0.6781 97.36 J8 0.9870 57.30 0.9169 81.39 0.7534 95.54 J9 0.9774 66.95 0.9405 79.51 0.7989 95.35
[image:11.612.173.440.562.623.2]The results obtained from stability study are shown in table 9.
Table: 9 Accelerated stability study of data for Aceclofenac microspheres Months Physical Appearance Particle size Drug content Q16 h
0 - 94.58 ± 1.36 100 ± 0.74 82.58±1.07 3 - 94.04 ± 1.14 98 ± 1.03 81.92± 1.28 6 + 93.21 ± 1.29 97.6 ± 0.93 81.27± 0.89
- Indicate no change + indicate slight change values are mean± SD (n=3)
The stability study of Aceclofenac loaded microspheres from optimized batch was conducted at accelerated condition for 6 months as per ICH guide line. The samples were evaluated for regular interval as per protocol for the period of six months.
The result of stability studies showed that no changes in physical appearance, drug content, Q16h and size for upto
The particle size was slight decrease at the test condition which may be attributed to evaporation of residual solvent at higher temperature. The drug content and drug release profile of microspheres was found that no remarkable changes observed.
The result of stability study indicated that the formulation was stable at accelerated condition. So the product may show good stability at room temperature.
CONCLUSION
Aceclofenac Microspheres can be successfully prepared by oil in oil emulsion solvent evaporation method. The method is simple and reproducible. Polymer drug ratio and stirrer speed influenced significantly to entrapment efficiency, size of microspheres and release of drug from the microspheres. Response surface method was used to optimize the selected variable formulation. The stability study of the optimized of the microspheres indicated that the microspheres were stable. The microspheres thus developed was better alternative to conventional dosage form for oral delivery of drug particularly for its chronic use and may enhance the patient compliance which is essential for the success of any therapy.
REFERENCES
[1]K Karthikeyan, L Rachita, R Rama. and S Purna, AAPS PharmSciTech,2012, 13(1), 143-149. [2]E Legrand, Expert Opin. Pharmacother,2004, 5(6), 1347-1357.
[3]Sweetman SC, Martindale: The Complete Drug Reference, 36thEdition, Pharmaceutical Press, London,2009, 14.
[4]P Venkatesan, R Manavalan and K Valliappan, J. Pharm. Sci. & Res.,2009, 1(4),26-35. [5]F Sergio, M Hans,G Bruno, J Controlled Release, 2005, 102, 313-332.
[6]WR Myers,'Response Surface Methodology', Encyclopedia of Biopharmaceutical Statistics,2003, 1:1, 858—869. [7]M Jelvehgari, M Maghsoodi and H Nemati, Research in Pharmaceutical Sciences,2010, 5(1), 29-39.
[8]R Kendall, M Alhnan, S Nilkumhang, S Murdanand A Basit., European Journal of Pharmaceutical Sciences,
2009 37, 284-290.
[9]S Sahoo, A Mallick, B Barik & P Senapati, Tropical Journal of Pharmaceutical Research, 2005, 4 (1), 369-375. [10]A Martin, J Swarbrick and A Cammratha Physical pharmacy: Physical and chemical principles in the
pharmaceutical sciences. 3rdEdition. Verghese Publishing House, Bombay,1991, 494-495.
[11]R Dhakar, S Maurya, S Aggarwal, G Kumar and V Tilak, Pharmacie Globale (IJCP), 2010, 1(7), 1-5.
[12]S Mutalik, K Manoj, M Reddy, P Kushtagi, A Nayak, P Anju, A Ranjith and N Udupa, AAPS Pharm
SciTech,2008, 9(2), 651-659.
[13]Y Zhang, M Huo, J Zhou, A Zhou, Li W, C Yao and S Xie, AAPS J.,2010, 12(3), 263–271.
[14]S Ahuja and S Scypinski, Ed. Handbook of Modern Pharmaceutical Analysis, 2nd Edition, Informa Healthcare,
London, Vol. 3, 2001, 445-483.
[15]S Bansode, VKasture, SPawar and SKasture Journal of Applied Pharmaceutical Science, 2012, 2 (10), 113-116. [16]RD Vijaya., Trends Biomater. Artif. Organs.,2009, 23(1), 21-33.
[17]B Mazumder, S Bhattacharya, B Mohanta, S Dey and A Maity, International Journal of PharmTech Research,
2009, 1(3):905-913.
[18]F Atyabi, A Mohammadi and R Dinarvand, Iran J Pharm Sci., 2005, 1(3), 143-152. [19]M Guyot and F Fawaz, International journal of pharmaceutics, 1998, 175, 61-74. [20]F Podczeck,.Int. J. Pharm.,1993,97, 93–100.
[21]P Costa and J Lobo, Eur J Pharm Sci.2001,13: 123–133.