77:17 (2015) 31–35 | www.jurnalteknologi.utm.my | eISSN 2180–3722 |
Jurnal
Teknologi
Full Paper
3D
MODELLING
OF
ELECTRICAL
CAPACITANCE
AND
ULTRASONIC
SENSOR
INTEGRATION
USING
FINITE
ELEMENT
METHOD
Jaysuman Pusppanathan
a, Ruzairi Abdul Rahim
a*, Fatin Aliah
Phang
b, Khairul Hamimah Abasa
a, Shafishuhaza Sahlan
a, Elmy
Johana Mohamad
ca
Process Tomography and Instrumentation Engineering Research
Group (PROTOM-i), Infocomm Research Alliance
b
Centre of Engineering Education (CEE), Universiti Teknologi
Malaysia, 81310 UTM Johor Bahru, Johor, Malaysia
c
Department of Mechatronics and Robotics Engineering, Faculty
of Electrical and Electronic Engineering, Universiti Tun Hussein Onn
Malaysia, 86400 Batu Pahat, Johor, Malaysia
Article history
Received
28 June 2015
Received in revised form
1 September 2015
Accepted
15 October 2015
*Corresponding author
[email protected]
Graphical abstract
Abstract
This paper presents a three dimensional (3D) modelling of a dual modality sensor composite which emerges electrical capacitance sensor (ES) and ultrasonic transducer (UT) for process tomography applications. The dual-modality tomography (DMT) setup has employed a customized ES electrodes along with UT on a single-plane. A finite element method is used to analyze the feasibility and the behavior of the DMT setup in 3D environment using COMSOL Multiphysics software. This simulation is performed both in a homogeneous and inhomogeneous conditions to investigate the wave distribution and its pattern thus the simulation results are presented in this paper.
Keywords: Tomography, electrical capacitance, comsol, finite element analysis, sensor guard
© 2015 Penerbit UTM Press. All rights reserved
1.0 INTRODUCTION
Electrical Capacitance Tomography (ECT) and Ultrasonic tomography (UT) has been extensively employed in the field of process tomography (PT) for flow monitoring applications such as oil and gas industries and others.
However, most tomography systems employ a single measurement techniques which often suffers from insufficient data to produce better results [1-4]. This problem is seen to be more critical in multiphase flow conditions whereby a mixture of oil, water and
gas components needs to be visualize. Due to the limitation of these sensors, a multisensory technique is necessarily needed to obtain complimentary data where a single-sensory approach could not achieve.
Multi-modal tomography system was developed as a part of the Technology Foresight Challenge (TFC) research project which began in United Kingdom (UK) in 1996 [4].
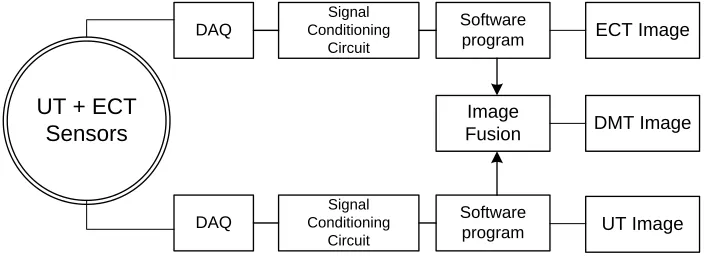
UT + ECT
Sensors
DAQ
Signal Conditioning
Circuit
Software program
DAQ
Signal Conditioning
Circuit
Software program
Image
Fusion DMT Image
ECT Image
[image:2.612.130.483.86.214.2]UT Image
Figure 1 Electrical capacitance tomography system
2.0 DMT FUNDAMENTAL
Basically, the DMT system incorporates the emergence of ECT and UT system composite which essentially bind to its respective sensing principle. Both ECT and UT is sensitive to different parameters and properties. Its sensing behavior depends on the soft-field and hard-field characteristic respectively.
2.1 ECT Principle
The principle of ECT sensor is to measure the capacitance changes within the cross sectional distributed field with different dielectric materials. This can be determined by equation 1 [3, 5, 6].
𝐶 =𝜀0𝜀𝑟𝐴
𝑑𝑝 (1)
Where C is the capacitance value, ε0 is the permittivity value in free space, εr is the permittivity value of the dielectric material, A is the sensing zone and dp is the distance between electrode sensors.
2.2 UT Principle
Unlike ECT whereby its detection principle is based on capacitance distribution within a particular area, UT relies upon detectable interactions between bulk mediums. Due to the difference in acoustic properties between these bulks, partial reflection and transmission of the acoustic pressure at the boundary interface will occur. This interaction can be estimated by determining the acoustic impedance as in equation 2 [7, 8].
±𝑍0= ±𝜌0𝑉0 (2)
Where Z0 is the acoustic impedance (kg/m2s), ρ0 is the density of the medium (kg/m3) and V0 is the sound velocity in the medium (m/s). Z0 carries a positive and negative sign indicating a forward or backward propagation of ultrasonic wave.
3.0 PREPARATION OF FINITE ELEMENT
ANALYSIS
A simulated experiment is carried out using electrostatic solver (ES) and pressure acoustic solver (PA) to evaluate the ECT and UT system respectively.
Since both types of sensor are configured on the same plane, the multiphysic solvers needs to be performed simultaneously to reflect to the real-time condition of the DMT system. Several steps of FEM are taken as follows:
Sensor geometry modelling
Material selection
Boundary settings
Meshing process
3.1 Sensor Geometry Modelling
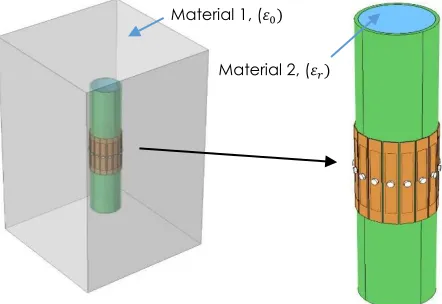
Figure 2 3D geometry model of DMT hardware for finite element analysis
A total of 16 units of customized FR4 copper ECT sensor is employed as explained in [9] along with 16 units of UT sensors on a 110 mm acrylic pipe. The customized ECT sensor has the flexibility to easily curve or bend to attach firmly on a curved pipe surface [9]. A 10 mm diameter is allocated in the middle of the sensing zone to allow UT sensor to be installed. Figure 3 further illustrate the sensor design.
Sensing zone Driven Guard
Bottom view
Top view
Earthed screen
20mm 110mm
20mm 15mm
20mm
To Signal Conditioning Circuit
[image:3.612.328.558.71.176.2]Ø 10mm
Figure 3 Customized ECT sensor from FR4 copper material
3.2 Material Selection
[image:3.612.57.278.72.224.2]A variety of material selection is available in the material browser inside COMSOL software. The FR4 copper material were applied on the ECT sensor whilst air (gas) material were applied to the surrounding area of the sensor to create a virtual empty air (gas) environment (see Figure 2). Following Table 1 provides the materials involved for the simulated experiment and its properties.
Table 1 Materials and properties of DMT model for FEM analysis
Properties / materials Acoustic Impedance x106 [kg/m2s] Relative Permittivity ε(r)
Copper 44.6 6.0
Water 1.5 80.4
Acrylic 3.25 1.9
Air 0.43 1.0
Crude oil 1.3 3.0
3.3 Boundary Setting
Since the geometry model settings involve several types of materials, the boundary conditions and interfaces between two or more of these materials need to be set accordingly. The boundary conditions for ECT setup is to solve the sensor electric potential φ(r) according to Poisson equation as follows [6].
∇ ∙ [ 𝜀(𝑟)∇ 𝜑(𝑟)] = 0 (1)
Where ε(r) is the spatial permittivity distribution and φ(r) is the potential distribution.
As for UT, The acoustic wave propagation will have to travel through several sound soft boundaries which creates a boundary condition at the domain interfaces of the acrylic wall and the inhomogeneous materials. The impedance boundary condition is specified according to the material properties which is governed by follows.
−𝑛 [(−1
𝜌 (∇𝑝𝑡− 𝑞)1− ( −1
𝜌 (∇𝑝𝑡− 𝑞)2] = 0 (3)
Where ρ is the density, pt is the total acoustic pressure.
3.4 Meshing Process
Finite element meshing technique is used for dividing a complex problem into small elements by breaking down the geometry model into nodes and then connecting these nodes to form triangle elements. The 3D geometry model is discretized and meshed at an extremely-fine quality ranging from a maximum and minimum size of 0.8 mm and 0.0016 mm respectively as in Figure 4.
Material 1, (𝜀0)
[image:3.612.128.482.397.470.2]Figure 4 Finite element 3D mesh model
After meshing process, the meshed model is solved using stationary domain solver over each meshed elements.
4.0 RESULTS AND DISCUSSION
[image:4.612.320.554.193.464.2]The computed simulation results are visualized in a 3D environment which could easily viewed in multiple angles for further analysis. Following Figure 5 shows the FEM result at time (t) = 65 μ second.
Figure 5 FEM result for DMT system (a) 3D view (b) zy-plane view
Figure 5 shows that both the ECT and UT sensors are able to incorporate with each other on a
single-plane. The streamline of electric field for a single excitation is in curved shape. Due to the soft-field effect, this curved shape lines dispersed over the 10 mm diameter hole in the middle of the ECT sensing zone as in Figure 5(b). This way, the electric field gap at the hole area is reconciled.
In the meantime, ultrasonic sensors mounted through these holes will anticipate any disclosed object such as air bubble. To further investigate the 3D results, the model is sliced into xy-plane in 2D view as in Figure 6.
Figure 6 Acoustic pressure field and streamline electric field on xy-plane view at t = 65 μs (a) homogeneous condition (b) inhomogeneous condition
The acoustic pressure field and the streamline electric field for ECT and UT respectively is seen to propagate evenly across the transmitting sensor towards the detecting sensors in homogeneous condition (Figure 6(a)).
While the electric field lines curves and sway away between two different dielectric materials in an inhomogeneous condition, the acoustic wave responded by reflecting or deflecting at interface boundaries between bulk mediums with different acoustic impedance. Therefore, a drop of sound pressure and potential distribution is anticipated on the neighboring detecting sensors [10].
The response of both ECT and UT on a single-plane has shown that the model is feasible for dual-modality sensor integration. Thus, the DMT system could provide complimentary sensor data for multiphase flow applications measuring oil, water and gas components on a single-plane.
(b)
Air bubble
UT ECT
(a)
UT ECT
[image:4.612.62.290.419.657.2]5.0 CONCLUSION
DMT system is basically the emergence of two single-modality system using ECT and UT technique. To further investigate the feasibility of such system, a 3D model of this DMT system is carried out using FEM with a 3D geometry model. The geometry model employs dimensions of the actual physical system which is constructed in COMSOL software. With this model, the pressure acoustic solver and electrostatic solver is used to solve the complex forward problem of the system.
The simulated result of the electric field distribution and wave propagation is successfully visualized by streamlines and surface view for ECT and UT respectively. Thus, the sensor response in both homogeneous and inhomogeneous condition satisfied the soft-field and hard-field characteristic. This further indicates that the customized ECT sensor incorporates well with the ultrasonic sensors on a single-plane simultaneous measurement.
Acknowledgement
This research is funded by the Research University Grant (GUP) no. 08H31 and no. 03H96. The author would like to thank the Process Tomography Research Group and Instrumentation (PROTOM-i), Faculty of Electrical Engineering and Centre of Engineering Education for their support in this research.
References
[1] J. Pusppanathan, N.M.N. Ayob, F.R. Yunus, S. Sahlan, K.H. Abas, H.A. Rahim, R.A. Rahim and F. A. Phang. 2013. Study on Single Plane Ultrasonic and Electrical Capacitance Sensor for Process Tomography System. Sensors &
Transducers. 150(3): 40-45.
[2] Nor Ayob, N. M., J. Pusppanathan, R. Abdul Rahim, M. H. Fazalul Rahiman, F. R. Mohd Yunus, S. Buyamin, I. M. Abd Rahim and Y. Md Yusri. 2013. Design Consideration For Front-End System In Ultrasonic Tomography. Jurnal
Teknologi (Sciences and Engineering). 64(5): 53-58.
[3] Pusppanathan, J., N. M. N. Ayob, F. R. Yunus, R. A. Rahim, F. A. Phang, H. A. Rahim, P. L. Leow and K. H. Abas. 2013. A Novel Electrical Capacitance Sensor Design For Dual Modality Tomography Multiphase Measurement. Jurnal
Teknologi. 64(5).
[4] Qiu, C., B. S. Hoyle and F. J. W. Podd. 2007. Engineering and Application Of A Dual-Modality Process Tomography System. Flow Measurement and Instrumentation. 18(5-6): 247-254.
[5] Rahiman, M. H. F., R. A. Rahim and M. Tajjudin. 2006. Ultrasonic Transmission-Mode Tomography Imaging for Liquid/Gas Two-Phase Flow. Sensors Journal, IEEE. 6(6): 1706-1715.
[6] Rahiman, M. H. F., R. A. Rahim and Z. Zakaria. 2008. Design and Modelling Of Ultrasonic Tomography For Two-Component High-Acoustic Impedance Mixture. Sensors
and Actuators A: Physical. 147(2): 409-414.
[7] Steiner, G., H. Wegleiter and D. Watzenig. 2005. A Dual Mode Ultrasound and Electrical Capacitance Process Tomography Sensor. Sensors. 2005 IEEE.
[8] Yang, W. 2010. Design of Electrical Capacitance
Tomography Sensors. Measurement Science &
Technology. 21(4).
[9] Yunus, F. R. M., R. A. Rahim, S. R. Aw, N. M. N. Ayob, C. L. Goh and M. J. Pusppanathan. 2014. Simulation Study of Electrode Size In Air-Bubble Detection For Dual-Mode Integrated Electrical Resistance and Ultrasonic Transmission Tomography. Powder Technology. 256(0): 224-232.
[10] Zimam, M. A., E. J. Mohamad, R. A. Rahim and L. P. Ling 2011. Sensor Modeling For An Electrical Capacitance Tomography System Using Comsol Multiphysics. Jurnal