i
THERMAL COMFORT STUDY ON TERRACED HOUSE OVERSEEING THE EFFECT ON RAINWATER HARVESTING SYSTEM
JULIUS APAT
A project report in partial
fulfillmentof the requirement for the award of the Degree of Master of Mechanical Engneering
Faculty of Mechanical and Manufacturing Engineering Universiti Tun Hussein Onn Malaysia
v
ABSTRACT
vi
ABSTRAK
vii
TABLE OF CONTENTS
TITLE i
DECLARATION ii
DEDICATION iii
AKNOWLEDGEMENT iv
ABSTACT v
ABSTRAK vi
TABLE OF CONTENTS vii
LIST OF TABLES x
LIST OF FIGURES xi
LIST OF CHARTS xii
LIST OF APPENDICES xiii
CHAPTER 1: INTRODUCTION 1
1.1 Introduction 1
1.2 Theoretical background 4
1.3 Problem statement 5
1.4 Objective of the study 5
CHAPTER 2: LITERATURE REVIEW 7
2.1 Introduction 7
2.2 Rudoy and Duran (1975) – work lead to GRP manual 8
2.2.1 Walls and roofs 8
2.2.2 Fenestration/ Opening 10
2.2.3 People 11
2.2.4 Equipment 12
2.2.5 Light 13
2.3 Harris and McQuiston (1988) – methods for grouping walls and roofs
14
2.4 Sowell (1988a,b&c) – zone classification & weighting factor development
15
2.5 Thermal Comfort 17
viii
2.6.1 Orientation and Spatial Organization 19
2.6.2 Shading 20
2.6.3 Material, Colour and Texture 21
2.6.4 Vegetation 23
2.7 Cooling Techniques 24
2.7.1 Ventilated Cooling 24
a. Ventilated Cooling by Wind 24 b. Ventilated Cooling by Buoyancy 25 c. Ventilated Cooling by Combined Wind &
Buoyancy
27
2.8 Thermal Mass 28
2.8.1 Radiant Cooling 29
2.8.2 Indirect Evaporative Cooling 30
a. Roof Pond 31
b. Roof Spray 31
c. Roof Garden 32
2.8.3 Dehumidification Techniques 32
CHAPTER 3: METHODOLOGY 34
3.1 Scope of study 34
3.2 Heat Load Calculation 35
3.3 Sites 37
3.4 Parameters and measurement 39
3.5 Research Planning and Schedule 42 3.6 Flow chart of research planning and schedule 43
CHAPTER 4: HEAT LOAD CALCULATION AT THE RESIDENTIAL 44
4.1 Introduction 44
4.2 Heating Loss Estimation 44
4.3 Heat Load Calculation 45
4.3.1 Heat calculation table 46
4.3.2 Heat load calculation detail 47
a. Living Room 47
b. Dining Room 49
ix
d. Bathroom 52
e. Master Bedroom 53
f. Bedroom 1 55
g. Bedroom 2 57
h. Bathroom 1 59
i. Bathroom 2 60
CHAPTER 5: RESULT AND DISCUSSIONS 61
5.1 Data and analysis 61
5.1.1 Research summary 61
5.1.2 Result of temperature collected data on site 63 5.1.3 Result of the cooling load temperature
differ-ence (CLTD) again the energy uses in an air
conditioning units 65
5.2 Research completion 66
5.3 Limitation of the research 67
5.4 Benefit of the research 67
5.5 Suggestion for research 68
REFERENCES 69
x
LIST OF TABLES
Table No Page
1.1 Month Temperature for Malaysia 2
1.2 Mean Temperature and Monthly Rain Fall in Kuching 3 1.3 Latitude, Longitude and Altitude in Malaysia 36
1.4 Areas and lights used for the building. 36
1.5 Building Specification 37
1.6 Research Planning and schedule (Project Master 1) 42 1.7 Research Planning and schedule (Project Master 2) 42
1.8 Malaysia heat load design condition 45
1.9 Recommended Thermal Comfort for Human Comfort 45
2.0 Heat Load Calculation Table 46
2.1 Monthly Temperature for Malaysia Weather from August until
Novem-ber 62
xi
LIST OF FIGURES
Figure No Page
1.1 Bioclimatic chart modified for hot humid climates (adapted from Olgyay following Jitkhajornwanich). The new comfort zone is shown on the
right of the original one 18
1.2 The orientation and spatial organisation of a traditional Thai house 19 1.3 A schematic of a roof section showing an example of a combined use of
insulation, a ventilation space and reflective lining to minimize thermal
impact from solar radiation on the interior environment. 22 1.4 Examples of opening design to encourage interior air movement 25 1.5 Examples of solar chimney configurations: vertical (a) and inclined (b) 26 1.6 Wind-assisted ventilation (a); buoyancy dominated, wind-opposed
Ventilation(b); and wind dominated, wind-opposed ventilation (c). 27 1.7 A schematic of a radiant cooling system which involves cooling the roof
by nocturnal radiation and introducing cooled night air into the occupied
space. 30
1.8 A schematic of the cool radiant panel system tested in Thailand. 30
1.9 A schematic of the Cool Roof 32
1.10 Room heat gain components 35
1.11 Double Storey Terrace House 38
1.12 Site Double Storey Terrace House 39
1.13 Water Tank & Pump with pipe connection on site 40
1.14 Infrared Thermometer Temperature Laser 41
xii
LIST OF CHARTS
Chart No Page
1.1 Malaysia Weather Chart 3
1.2 Comfort zone of indoor air temperature and relative humidity. These zones apply to person clothed in typical summer or winter clothing
en-gaged in sedentary activity. 4
1.3 Comfort Zone of indoor air temperature and relative humidity. (Adapted
from the ASHRAE Handbook-Fundamental). 45
1.4 Showing the Malaysia Weather from August until November 62 1.5 The data showing that Malaysia weather out of the comfort zone. 63 1.6 Showing the difference of the temperature relative humidity 64 1.7 The result show that using the Rainwater Harvesting System is still
un-der the comfort zone. 64
1.8 Heat Load again the Required Energy 66
xiii
LIST OF APPENDICES
Appendix No
Appendix A Table 1.1: Cooling load temperature differences (CLTD) for calculating cooling load from flat roofs, o F.
Appendix B Table 1.2: Wall construction group description Appendix C Table 1.3: Rate of heat from occupants
Appendix D Table 1.4: Heat gain from equipment
Appendix E Table 1.5: CLTD values for single family detached residences Appendix F Table 1.6: Shade lines factors (SLF)
Appendix G Table 1.7: Air change rate as a function of outdoor design temperatures Appendix H Table 1.8: Window glass load factors (GLF) for single detached
resi-dences
Appendix I Table 1.9: Cooling load temperature differences (CLTD) for calculating cooling load sunlit walls, o F.
Appendix J Table A.1: Overall heat transfer coefficient U for building construction components, Btu/hr.ft2.oF.
CHAPTER 1
INTRODUCTION
1.1 Introduction
In hot and humid climates thermal comfort can become a problem to the occupants of many residential buildings especially when they are not equipped with air-conditioning system. Malaysia is one of the tropical country which very much like most of the conutry that have the temperature can be hot throughout the year and there is a large amount of rainfall.
In Malaysia there is no considerable difference between seasons, like summer and winter. Days are warm and usually humid but the nights are quite cool. The temperature also varies in different locations. At Penang, the temperatures stay close to 82oF (28oC) and at Labuan the average temperature is 80oF (27oC). The temperature in areas located above sea level is considerably cooler. The Cameron Highlands which are about 5000 feet (1500m) above sea level has a temperature of 64oF (18oC) which is very much a good thing for foreigners [1,7,8].
The main raining season runs between November and February, while August is considered the most humid and wettest period on the West Coast (Terengganu, Kelantan and Pahang). Sabah and Sarawak have heavy rains during November to February. Rainfall, however, is heavy all year round in the country. Rainfall is heavy in the mountain areas. In the Cameroon highlands, the total annual rainfallis over 100 inches (2540 mm). No single month has less than 5 inches or 125 mm of rainfall[7,8].
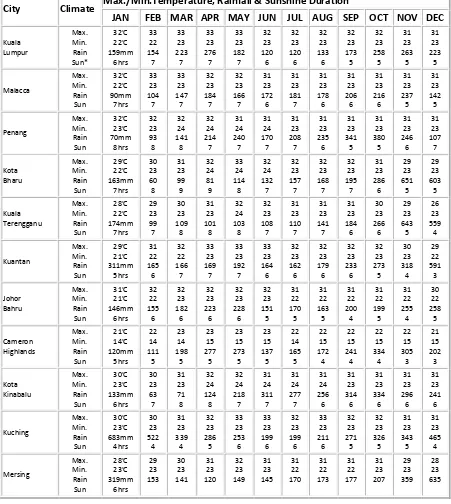
City Climate Max./Min.Temperature, Rainfall & Sunshine Duration
JAN FEB MAR APR MAY JUN JUL AUG SEP OCT NOV DEC
[image:12.595.69.520.83.587.2]Kuala Lumpur Max. Min. Rain Sun* 32'C 22'C 159mm 6hrs 33 22 154 7 33 23 223 7 33 23 276 7 33 23 182 7 32 23 120 6 32 23 120 6 32 23 133 6 32 23 173 5 32 23 258 5 31 23 263 5 31 23 223 5 Malacca Max. Min. Rain Sun 32'C 22'C 90mm 7hrs 33 23 104 7 33 23 147 7 32 23 184 7 32 23 166 7 31 23 172 6 31 23 181 7 31 23 178 6 31 23 206 6 31 23 216 6 31 23 237 5 31 23 142 5 Penang Max. Min. Rain Sun 32'C 23'C 70mm 8hrs 32 23 93 8 32 24 141 8 32 24 214 7 31 24 240 7 31 24 170 7 31 23 208 7 31 23 235 6 31 23 341 5 31 23 380 5 31 23 246 6 31 23 107 7 Kota Bharu Max. Min. Rain Sun 29'C 22'C 163mm 7hrs 30 23 60 8 31 23 99 9 32 24 81 9 33 24 114 8 32 24 132 7 32 23 157 7 32 23 168 7 32 23 195 7 31 23 286 6 29 23 651 5 29 23 603 5 Kuala Terengganu Max. Min. Rain Sun 28'C 22'C 174mm 7hrs 29 23 99 7 30 23 109 8 31 23 101 8 32 24 103 8 32 23 108 7 31 23 110 7 31 23 141 7 31 23 184 6 30 23 266 6 29 23 643 5 26 23 559 4 Kuantan Max. Min. Rain Sun 29'C 21'C 311mm 5hrs 31 22 165 6 32 22 166 7 33 23 169 7 33 23 192 7 33 23 164 6 32 23 162 6 32 23 179 6 32 23 233 6 32 23 273 5 30 23 318 4 29 22 591 3 Johor Bahru Max. Min. Rain Sun 31'C 21'C 146mm 6hrs 32 22 155 6 32 23 182 6 32 23 223 6 32 23 228 6 32 23 151 5 31 22 170 5 31 22 163 5 31 22 200 4 31 22 199 5 31 22 255 4 30 22 258 5 Cameron Highlands Max. Min. Rain Sun 21'C 14'C 120mm 5hrs 22 14 111 5 23 14 198 5 23 15 277 5 23 15 273 5 23 15 137 5 22 14 165 5 22 15 172 4 22 15 241 4 22 15 334 4 22 15 305 3 21 15 202 3 Kota Kinabalu Max. Min. Rain Sun 30'C 23'C 133mm 6hrs 30 23 63 7 31 23 71 8 32 24 124 8 32 24 218 7 31 24 311 7 31 24 277 7 31 24 256 6 31 23 314 6 31 23 334 6 31 23 296 6 31 23 241 6 Kuching Max. Min. Rain Sun 30'C 23'C 683mm 4hrs 30 23 522 4 31 23 339 4 32 23 286 5 33 23 253 6 33 23 199 6 32 23 199 6 33 23 211 6 32 23 271 5 32 23 326 5 31 23 343 5 31 23 465 4 Mersing Max. Min. Rain Sun 28'C 23'C 319mm 6hrs 29 23 153 30 23 141 31 23 120 32 23 149 31 23 145 31 22 170 31 22 173 31 22 177 31 23 207 29 23 359 28 23 635
Table 1.1:Monthly Temperature for Malaysia.
* Average sunshine duration. 1) Mean daily sunshine hour
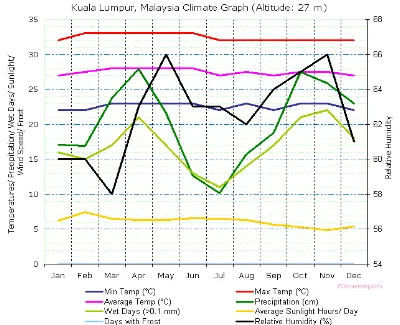
Chart 1.1:Malaysia Weather Chart
Month
Mean Temperature oC
Mean Total Rainfall (mm)
Mean Number of Rain Days Daily
Minimum
Daily Maximum
Jan 22.9 29.8 684.1 22
Feb 23.0 30.2 473.3 17
Mar 23.2 31.3 338.6 16
Apr 23.4 32.3 272.9 17
May 23.6 32.7 241.8 15
Jun 23.3 32.7 220.3 14
Jul 23.0 32.4 185.6 13
Aug 23.0 32.4 229.6 14
Sep 22.9 32.0 262.3 16
Oct 22.9 31.9 338.6 19
Nov 22.9 31.6 371.5 22
[image:13.595.78.478.75.400.2]Dec 22.9 30.6 498.1 22
1.2 Theoretical Background
Studies of the condition that effect human comfort have lead to the development of recommended indoor air conditions comfort, published in ASHRAE Standard 55-1992,
Thermal Envonmental Conditions for Human Occupancy. [1]
Chart 1.1: Comfort zone of indoor air temperature ans relative humidity. These zones apply to person clothed in
typical summer or winter clothing engaged in sedentary activity.
Some of the results of these studies are shown in Chart 1.1. The shaded regions in Chart 1.1are called the comfort zones. They show the regions of air temperature and relative humidity where at least 80% of the occupants will find the environment comfortable. The use of Chart 1.1 valid only for the following conditions:
1. The comfort zones apply only to sedentary or slightly active person.
2. The comfort zones apply only to summer clothing of light slack and a short sleeve shirt, or equivalent 0.5 clothing insulation (0.5clo) and winter clothing of heavy slack, long sleeve shirt and sweater of jacket, or equivalent (0.9clo)[2].
3. The comfort zones apply to air motion in the occupied zone not exceeding 30feet per minute (FPM) in winter and 50FPM in summer[2].
1.3 Problem Statement
As Malaysia strives for the status of developed nation, it propels associated environmental and energy security issues commonly encountered by other developed countries. Subsequently, Malaysia and the rest of the world are faced with challenges to seek equilibrium between environmental sustainability and intensifying development. Many studies showed that residential sector accounts for 30 percent of the total world’s energy demand. Per capita residential electricity demands projected to more than double on 2030 as more households are able to afford most modern electrical appliances, including air conditioning, to improve their lifestyles.
Anybody that has regularly tuned into the news over the last decade or so has probably become tired of all of the green initiatives that the government seem to conjure up. Most of these ideas have revolved around solar technology and insulation improvements although in the midst of all of this, many of the approaches seem to forget about rainwater harvesting as solution to bring near to thermal comfort and saving energy.
Kuching was one of the wettest places in Malaysia with an average rainfall of 4,128 mm (162.5 in) with 247 days of rain a year. With the roof is open to approximately 85,000 litres of water every year it will all going to waste. Therefore, a rainwater harvesting system will collect this water in a butt before supplying it to the house when it required. Unfortunately, this harvesting water cannot be used as drinking water, although it can be used for any sort of washing which doesn’t require pure water. In fact, people overseeing that rainwater harvesting can be used to reduce the energy in the house especially in terraced houses.
1.4 Objective of the Study
The mainobjective of this research is to investigate and compare the effectiveness of rainwater harvesting system to bring thermal comfort condition especially on the terraced house because it a waste for overseeing rainwater harvesting as a medium that can bring comfort condition of mind that expresses satisfaction to an user. This project has aimed some objectives regarding thermal comfort on the building as listed below;
b) To bring near to thermal comfort level to the occupants that not only satisfied the occupants but also to efficient energy consumption.
CHAPTER 2
LITERATURE REVIEW
2.1 Introduction
Located near the equator, Malaysia’s climate is categorized as equatorial, being hot and humid throughout the year. The average rainfall is 250 centimeter’s (98 in) a year[3]
and the average temperature is 27 °C (80.6 °F).[4]
Malaysia faces two monsoon winds seasons, the Southwest Monsoon from late May to September, and the Northeast Monsoon from November to March. The Northeast Monsoon brings in more rainfall compared to the Southwest Monsoon,[7] originating in China and the north Pacific. The southwest monsoon originates from the deserts of Australia. March and October form transitions between the two 6 monsoons.[3]
With the climate recorded data, Kuching was the wettest place in Malaysia and most people overseeing the effect of rainwater harvesting system as a medium to bring thermal comfort to the residences.
Rainwater collection is certainly nothing new to humans because have been doing it for thousands of years. However, with the advent of cheap, potable water delivered right to your doorstep, those who harvest rain have become somewhat of an anomaly where in can be an eco-friendly water supply.
Nevertheless it can be used as an energy reduction solution rather using air conditioning system which used more energy consumption.
2.2 Rudoy and Duran (1975) – work lead to GRP to comfort in the modern society
The current Cooling Load Temperature Difference (CLTD) method delineated in ASHRAE GRP 158 (1979) is based on work done by Rudy and Duran (1975). The cooling load due to external heat gain (roofs, walls and fenestrations) and internal heat gains lights, people and equipment) are calculated separately and added to heat gain due to infiltration to obtain the total zone cooling load.
2.2.1 Walls and roofs
[48].
The Transfer Function Method (TFM) was used to compute cooling loads for 36 types of roofs and 96 different wall constructions. These cooling loads correspond to the heat gain caused by outdoor air temperature and solar radiation under the following standard conditions.
40deg. North Latitude
95oF Maximum outdoor design dry bulb temperature 21oF Daily temperature range
75oF Inside design dry bulb temperature 3.0Btu/hr-ft2-oF Outside heat transfer coefficient 1.46Btu/hr-ft2-oF Inside transfer coefficient
CLTD A
U
q (1)
Where,
q = Cooling load, BTU/hr.
U = Overall heat transfer coefficient, BTU/hr-ft2-oF A = Area, ft2.
CLTD = Equivalent temperature difference, oF.
CLTDs were calculated for 96 types of walls for a medium type of zone construction. The CLTDs were analyzed for similarity in profile as well as the absolute value. Walls were then grouped in 7 different categories and CLTDs were calculated for 8 facing directions.
CLTDs were calculated for 36 types of roofs. The normalized profiles of these roof CLTDs were found to be quite similar. In the paper (1975), Rudoy suggested listing only the peak value, the hour of its occurrence and the range of values for each roofs into 13 categories with suspended ceilings, and 13 without suspended ceiling making 26 categories in all. It appears that the same technique was eventually applied to roofs as to walls. Both wall and roof CLTDs were published for the month of July only. The following equation was given to adjust for other latitudes and months and other indoor and outdoor design temperatures.
78
0 85
CLTD LM K T T
CLTDcorr R
(2)
Where,
LM = Latitude moth correction factor, found in a table
K = Color adjustment factor, applied after latitude moth correction TR = Room temperature, oF
T0 = Outdoor temperature, oF
It is not clear from either the paper or GRP 158 manual how this equation was derived. The drawbacks with the CLTD method for walls and roofs are;
1. The wall and roof groups don’t cover the range of possible constructions well. 2. Complicated and questionable adjustment are required if a wall of roof does not
match one of the group listed. (e.g. for each 7 increase in R-value above that of the wall structure in the listed group, move on one group if insulation is on interior of structure and two groups if on exterior.
2.2.2 Fenestration/ Opening
To find the cooling load due to fenestration the heat gain was divided into radiant and conductive portions. The Cooling load due to conduction was calculated using the same relation used for roof and walls, Eq. 1.
CLTDs for windows (which can also be applied to doors) were listed for standard condition and relation was provided to correct for outdoor daily average temperature other than 85oF and indoor temperature other than 78oF. The CLTDs are calculated for 40 deg. N. latitude which causes some error for other latitudes, but the conduction load from fenestration is such a small portion of the overall load that this was deemed negligible.
To find the radiant portion of the cooling load the solar heat gain for each hour through a reference glazing material (double strength (1/8 in.) sheet glass) was calculated for different fenestration orientation using the ASHRAE clear sky model. The heat gain was converted to cooling load using the room transfer function equation. Cooling loads corresponding to theses heat gain were calculated for light, medium and heavy zone construction without interior shading and for zones with interior shading. A cooling Load Factor (CLF) was derived for each hour of the day so that the cooling load for that hour could be found by multiplying the maximum solar heat gain for the day by the hourly CLF as follows:
CLF SHGF
qr m ax
(3)
Where,
qr = cooling load for reference glazing system, BTU/hr SHGFmax = Maximum solar heat gain factor BTU/hr
CLP = Cooling load factor, ratio cooling load to maximum solar heat gain
To account for glazing system other than the reference system a shading coefficient was developed.
SC = Solar heat gain of fenestration system (4)
Solar heat gain of reference glass
CLF SC SHGF
q m ax
(5)
CLFs were listed for July 21 at 40 deg north latitude. These CLFs were considered to be representative of all summer months (May through September) at all northen latitudes. The maximum solar heat gain (SHGFmax) was listed foe all directions, months and northen latitudes from 0 to 60 deg in 4 deg intervals. The cooling load at a particular latitude by the CLF calculated for July at 40deg north. This was the worst problem with the old manual since CLFs calculated for the month of July could be significantly different from those for other months and CLFs calculated at 40 deg north latitude could be significantly different from those corresponding to other latitudes. These error could well be additive when calculating cooling loads for other months and latitudes.
2.2.3 People
An energy balance for the human body was developed for the following range of conditions:
1. The skin temperature was varied between 100oF and 80oF.
2. The clothing type was varied from typical business suit to light summer clothing. 3. The temperature of the outer surface of the clothed body was varied between skin
temperature and air temperature.
4. The average height of the people was varied from 5.33 ft to 6 ft.
The room temperature was held constant at 75oF. The result of the energy balance yielded a convective fraction ranging from 24.58% to 33.58% with a mean average value of 29.65%.
Based on the previous calculations a convective fraction was of 30% was deemed to be a reasonable representative value. CLFs were derived for a medium weight zone for each hour of the day. These CLFs were derived by calculating the cooling load corresponding to a unit heat gain, in this zone type, using the room transfer function equation. The CLFs were tabulated for various occupancy profiles. The cooling load due to people is then calculated as follows:
) (qS CLF ql N
q
(6)
q = Cooling load, BTU/hr N = Number of people
qS = Sensible heat gain per person, BTU/hr ql = Latent heat gain per person, BTU/hr
2.2.4 Equipment
An energy balance was developed for many common appliances with several simplifying assumptions applied. The energy balances yielded convective fractions between 32% and 46% for the equipment. A convective fraction of 40% was deemed to be appropriate and the room transfer functions were applied to the heat gain to derive cooling loads corresponding to the appliance heat gain. CLFs were derived analogously to those for people. As with people, the latent portion was assumed to become instantaneous cooling load. The cooling load due to appliances then becomes:
l
S CLF q
q
q
(7)
Where,
q = Cooling load, BTU/hr
qS = Sensible heat gain per person, BTU/hr ql = Latent heat gain per person, BTU/hr CLF = Cooling load factor, ratio
One table was published to cover all zone constructions; this does not allow for variations in zone construction which somewhat limits accuracy in the case of extremely light or heavy zones.
2.2.5 Light
Mitalas (1973) described the cooling load corresponding to heat gain from lights by a transfer function of the following form:
1 2
2 1
1
t t t
t aW a W bq
q
(8)
Where,
Wt = Power input to lights at time = t
al = Coefficient dependant on light ficture and ventilation arrangements b = Coefficient dependant on circulation, type of return and floor weight a2 = 1 – b – a1
Cooling loads for lights, corresponding to unit heat gains or power inputs were calculated for lights on for 8 to 16 hours duration in two hour increment using this equation. These hourly cooling loads were calculated for a 24 hour period. The cooling load induced by a unit heat gain is defined as the Cooling Load Factor (CLF). These CLFs were grouped into 4 groups depending on the permutations of a1 and b coefficients tables were supplied to determine these coefficients for a given light system. The cooling load due to lights was then found with the following equation:
CLF F
F q
qS 3.41 i u S
(9)
Where,
qs = Sensible cooling load, BTU/hr 3.41 = Conversion factor BTU/hr per watt qi = Total lamp wattage, W
Fu = Fraction of qi in use
FS = Ballast allowance factor for fluorescent fixtures CLF = Cooling load factor
2.3 Harris and McQuiston (1988) – methods for grouping walls and roofs
To use the CLTD method for walls and roofs, one had to determine which wall or roof type a particular surface matched. To do this the overall conductance and the product of mass time specific heat was determined for the surface in question. If a surface did not exactly match a wall or roof listed, a complicated set of instructions were followed to pick the best match. This method was tendicious to apply and its accuracy was questionable under certain conditions.
The walls and roofs were classified on the basis of their thermal lag and amplitude characteristics. The thermal or time lag is defined as the time between peak input and peak output heat gains while the amplitude ratio is defined as the ratio of peak output to peak input heat gains. The reference heat input is defined as follows.
e o
ref Ah T
Q
(10)
Where,
A = area
ho = Outside coefficient of heat transfer Te = Sol air temperature
The output heat gain is found with the conduction heat function equation as follows:
0 1 0
) / ( )
(
n n n
n i n j i n n j e n j
i A b t d q A t C
q
(11)
Where,
qi-j = Heat gain inside the zone, Btu/hr A = Area, ft2
bndnCn = Conduction heat transfer coefficients te = Outside temperature, oF ti = Inside temperature, oF
The amplitude ratios and time lags were studied for 2,600 walls and 500roofs. The walls and roofs were grouped on the basis of these thermal characteristics in 41 groups of walls and 42 groups of roofs. The normalized amplitude ratios in each group were within +0% and 20% and the thermal lag within ± one hour in each group.
Correlation methods were used to find correlation between the amplitude ratio and time lag and the wall or roofs physical properties or geometry. Important grouping parameters for walls were found to be:
1. Principal wall material (the most massive material in the wall)
2. The material the principal material is combined with (such as gypsum etc.) 3. The R value of the wall
Important grouping parameters for roofs were found to be:
1. Principal roof material (the most massive material in the roof) 2. The R value of the roof
3. Mass placement or absence of a suspended ceiling
Using these parameters one can determine into which of the 40 plus groups a particular wall or roof will fall. Each group was assigned a unique set of conduction heat transfer coefficients so as to produce conservative results. These conduction heat transfer coefficient are to be used in the conduction transfer function equation to calculate a representative heat gain for any wall or roof in that particular group.
2.4 Sowell (1988a,b&c) – zone classification & weighting factor development
It has been found that the weighting factors developed by Mitalas and used by Rudoy in GRP 158 are not applicable to all zones. The problem is that these weighting factors do not reflect the effects of many design parameters now known to be important. Thus to insure accurate cooling load calculations for a wide range of zones further research became necessary.
Three papers published by Sowell detail the methods used to classify and group 200,640 parametric zones. The first paper (Sowell 1988a) defines the objectives of ASHRAE research project 472(RP-472) to be:
1. Validate the methodology for calculation of zone dynamic thermal responses to several heat gain components, and
2. To classify zones according to dynamic thermal response characteristics, accounting for full ranges of variation of: floor plan, zone height, number of exterior walls, per cent glass, partition type, interior shading, zone location, slab type, mid-floor construction, wall construction, roof construction, floor covering, ceiling type, and furnishings.
Weighting factors are used to calculate the zone cooling load at time t, Qtbased on past loads and current and past heat gains using the relation:
2 2 1 1 2 2 1 1
0
t t t t t
t V q V q V q WQ W Q
Q
(12)
Qt = cooling load at time t Vi and wi = weighting factors Qt = heat gain at time t
Previous cooling loads and heat gains are initially assumed to be zero and calculation are performed in an iterative manner until the results for a 24 hour cycle converage.
The weghting factors reported in RP-472 were normalized by dividing the Vi by a factor:
) 1
/( )
(V0 V V2 W W2
Fc l l
(13)
This has the effect of “insulting” the zone so that no input heat gain can conduct back to the
outside air. To normalize the Vi should be multiplied by the Fc appropriate for the zone being
analyzed.
2.5 Thermal comfort
Thermal comfort is complex and partly subjective. It depends on many factors, of which air temperature, humidity, air movement, thermal radiation, the metabolic rate and the level of clothing are fundamental. The impacts of these factors on the thermal balance of the human body irrespective of adaptation to the local climate form the basis on which theoretical comfort models/ standards, such as Fanger’s PMV [11]
Figure 1.1: Bioclimatic chart modified for hot humid climates (adapted from Olgyay[30]
followingJitkhajornwanich[15]). The new comfort zone is shown on the right of the original one.
2.6 Design for Minimizing Cooling Requirement
In hot humid climates, a significant amount of energy can be saved if cooling needs can be minimized. In general, to achieve this, solar and conductive heat gains should be contained,and natural ventilation promoted for cooling and humidity removal. Some of the key strategies for minimizing cooling needs involve appropriate orientation and spatial organization, shading, and appropriate use of materials, colors, textures and vegetation.
2.6.1 Orientation and Spatial Organization
Figure 1.2:The orientation and spatial organization of a traditional Thai house [30].
By orientating the longer sides of the buildings to intercept prevailing winds and theshorter sides to face the direction of the strongest solar radiation, effective ventilation can beachieved, while thermal impact from solar radiation is minimized [31]. Such strategy can also be applied effectively to modern buildings, both in smaller scales, such as houses [30,32] and larger scales, such as residential blocks [35,37] and campuses[38]. However, work is still required to overcome the challenge of applying such orientation and spatial organization to commercial buildings in high density areas, such as high-rise offices, so that a balance is struck between comfort, energy use and commercial feasibility.
2.6.2 Shading
Effective shading can be provided by various means, including dedicated shading devices, nearby structures, vegetation and special glasses. Generally, external shading devices are considered the most effective, since they intercept solar radiation before it passes through the building envelope into the interior space. An appropriately orientated high-pitched roof which affords self-shading and allows only one side of itself to received direct solar radiation at a time is another possible shading technique [46]. A key issue which should be considered in shading design is its tendency to conflict with day lighting. Reduced daylight penetration due to inappropriate shading design can increase the demand for artificial lighting, which then offsets the energy savings from reduced heat gains [47]. Such a conflict can be lessened, for example, by using interior surfaces of high reflectance values, such as those in light colors, or using light shelves to reflect daylight into the deeper part of the interior [47]. Movable shading devices, such as louvers, which allow the occupants to adjust their local lighting and thermal environment, are another solution. When shading is provided by a special glass, the choice of glass is essential for balancing the benefit of heat gain reductionwith that of day lighting. Work is still required to identify the appropriate types of glass for free running buildings in hot humid climates, although some suggestions have been made with regard to their air-conditioned counterparts. Overall, research opportunity is still open for developing quantitative principles of shading that will balance thermal and energy benefits with day lighting quality. Shading as provided by vegetation is discussed in Section 3.4.
2.6.3 Material, Color and Texture
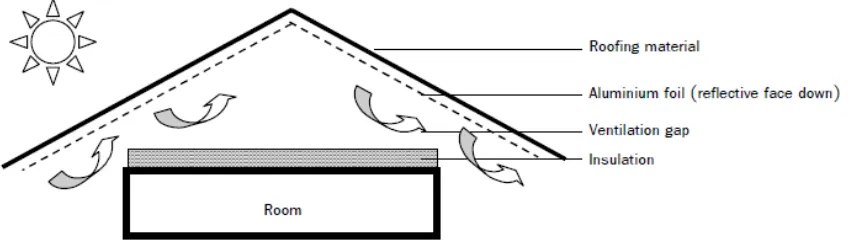
using technologies imported from colder and drier climates, such as plasterboards, lightweight concrete blocks and insulations have become prevalent. As more new materials enter the market, effort has been made to identify their properties, notably their thermal conductivities and water absorptions, in order to develop a database which will be useful for low-energy building design. However, information is still lacking with regard to the thermal capacities of many of these materials. To minimize thermal impact from solar radiation, multiple layers of materials may be required to make up a building envelope (Figure 1.3). A layer of insulation, such as foam or glass fiber, is probably required to cut effectively conductive heat transfer through opaque surfaces which receive strong solar radiation. In addition, a ventilation gap may be beneficially provided between the different layers of the envelope materials to vent excessive heat accumulated within. Such a gap may also be
Figure 1.3 A schematic of a roof section showing an example of a combined use of insulation, a ventilation
space and reflective lining to minimize thermal impact from solar radiation on the interior environment.
[image:31.595.84.508.320.443.2]have an average diurnal temperature which is a few degrees lower than that of the outside air, owing to its 24-hour long-wave radiant loss being greater than the net solar energy it absorbs. In addition to the use of traditional and imported materials, a number of new materials have been developed in hot humid climatesusually from local raw materials, such as agricultural wastes. Examples include particleboards from a mixture of rice straw and rice husks, and veliger grass; insulation boards from cassava and corncobs; a composite concrete from a combination of durian peel, coconut fiberand coconut coir; a brick from a combination of soil and coconut coir; a cement board from coconut coir; a concrete block from oil palm fibers and bagasseand sandwich walls from rice straw and rice husks. Some of these materials, such as the cement board from coconut coir, have lower thermal conductivities than those of conventional materials such as bricks and concrete, and in this regard are more appropriate for construction in hot climates. Work is required to identify more of such high-potential materials and develop them for wider commercial use. Attention should be given in particular to the ability of the materials to absorb and release accumulated moisture, given the high levels of humidity in hot humid climates.
2.6.4 Vegetation
quantitative planting principles should be developed which will help optimize the cooling effect of vegetation, especially when it is used in conjunction with/in place of conventional shading devices and insulation. Attention should be given to balancing the benefits from temperature reduction with the adverse effects from increased humidity due to the evaporate inspiration process, especially when plants are grown near ventilation inlets. Optimization of the use of local plants should also be explored.
2.7 Cooling Techniques
Even with the best effort to reduce heat gains, cooling requirement may not be eliminated. In such cases, a range of passive cooling techniques may be employed to help achieve thermalcomfort. Key cooling techniques for hot humid climates involve appropriate utilization of natural ventilation, thermal mass and heat dissipation by radiation and evaporation.
2.7.1 Ventilated Cooling
Ventilation provides cooling by enabling convective heat transfer from a warm building’s interior to a cool exterior. Also, sufficiently high indoor air velocities give the occupants direct physiological cooling. In a natural system, ventilation can be accomplished by either wind, buoyancy or a combination of wind and buoyancy.
a) Ventilated Cooling by Wind
al. [32-34] and Tantakitti and Jaturonglumlert) by allowing wind to induce sufficient indoor air movement. However, an indoor air velocity above 0.9 m/s may be considered excessive for a working environment [20], due to it being able to disturb loose paper [9]. Several investigations [32-34]
agree that, in general, to achieve effective ventilation in hot humid climates at least two large operable windows should be provided on different walls, preferably one opposite the other, with one of them intercepting the prevailing wind (Figure1.6a). When the windows cannot be orientated to face the wind, wind deflectors, which may be in the form of appropriately placed internal partitions, can be employed to channel air through the occupied zone (Figure 1.6b)[33-34]. Obstruction of the air path should be minimized (Figure 1.6c) [33-34]. Furthermore, windows should be at the body level (Figure 1.4).Examples of opening design to encourage interior air movement [34]. to increase potential for physiological cooling. To complement these qualitative guidelines, quantitative design principles for maximizing the cooling effect of wind in hot humid climates should be developed.
Figure 1.4: Examples of opening design to encourageinterior air movement [34].
This technique relies on temperature differences between the interior and exterior of a building to produce pressure gradients across the vents and drive the ventilation. Such temperature differences are usually a result of the heating by the occupants, lighting and other internal heat sources. While buoyancy-driven ventilation may be used to keep the interior temperature from rising excessively above the exterior and supply sufficient fresh air, the movement of indoor air achieved by this technique is usually insufficient to provide physiological cooling: computer simulations have shown houses fitted with ventilation chimneys being able to achieve a maximum indoor air velocity of only about 0.1 m/s, for instance [33-34].In general, to maximize the heat removal potential of buoyancy-driven ventilation, the vent area should be maximized, along with the vertical distance between the inlet and outlet. Additional buoyancy can be provided to increase the heat removal rate without raising the interior temperature by using solar radiation to heat a part of the ventilation path that is sufficiently separated from the occupied space. Such techniques may be implemented in the form of the so-called solar chimney (Figure 1.5), for example, which appears to have potential in hot humid climates where solar radiation is strong. Work on the solar chimney shows that the optimum width of a chimney is independent of solar intensity, but is dependent on the height of the chimney itself, the size of the room inlet and the size of the chimney inlet [89]. Furthermore, greater flow rates can be achieved when the chimney is inclined appropriately according to the latitude in which it is used or made of a low-emissivity material to minimize radiateheat loss through its walls.
Driven ventilation can be enhanced further by pre-cooling intake air, by means of thermal mass or a low-energy groundwater heat exchanger, for example. This will allow the interior to be cooled below the exterior, and achieve thermal comfort when the exterior temperature is uncomfortably high. Chenvidyakarn and Woods described the fluid mechanics of this technique; more work is required to develop the idea for use in hot humid climates. In addition, strategies should be explored to maximize the cooling potential of buoyancydrivensystems which exploit complex combinations of sources of heating and cooling often available in modern buildings, such as occupants, ingress solar radiation, heated envelopes, thermal mass, lighting and machinery. Attention should be given in particular to the resultant interior temperature structures which hold the key to the control of flow patterns and thermal comfort. Wind could also be introduced to a buoyancy-driven system to promote heat removal and physiological cooling; this is discussed in Section 4.1c below.
c) Ventilated Cooling by Combined Wind and Buoyancy
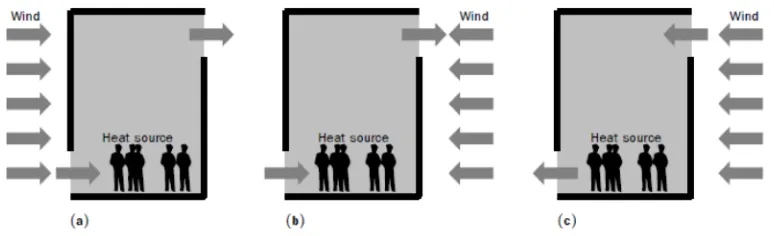
[image:36.595.116.503.537.655.2]The presence of wind can reduce or enhance the cooling potential of buoyancy-driven flows. Wind will assist buoyancy when the inlet is located on a windward side and the outlet is located on a leeward side (Figure 1.6a). The result is a greater indoor air velocity and greater cooling. In contrast, wind will oppose buoyancy if the inlet is placed on a leeward side while the outlet is on a windward side. In this case, if the magnitude of the wind-produced velocity is smaller than the buoyancy-wind-produced velocity, the net flow will be reduced along with the cooling effect (Figure 1.6b).
Figure 1.6: Wind-assisted ventilation (a); buoyancy dominated, wind-opposed ventilation (b); and wind
dominated, wind-opposed ventilation (c).
the wind (Figure 1.6c). Greater cooling may be expected as a consequence. Such interaction between wind and buoyancy highlights the need for locating the ventilation inlet and outlet appropriately to optimize the cooling potential of natural ventilation. This may be achieved by placing them according to the prevailing wind direction, for example. Alternative solutions include using ventilation terminals that incorporate weather vanes to allow automatic orientation of the inlet/outlet according to the wind direction, or ventilation terminals that have openings on all sides. Relatively little work has been done inhot humid climates to explore the cooling potential of ventilation driven by combined wind and buoyancy. Indeed, more investigation is required to develop generic design principles which will help optimize the cooling potential of this technique and complement the knowledge gained from specific case studies. Special attention should be given to the impact of the interaction between wind and buoyancy on the interior temperature structure and thermal comfort. Insights could be drawn from relevant fluid mechanics work.
2.8 Thermal Mass
uncomfortable temperature. To optimize the daytime cooling capacity of thermal mass, the mass should be ventilated at night to allow relatively cool night air to remove heat absorbed in the mass during the day. Such use of nocturnal ventilation in conjunction with thermal mass is more common in hot dry climates, which have relatively high diurnal temperature swings and low minimum night-time temperatures. Nevertheless, computer simulations suggest that this technique may also have potential in hot humid climates where night-time temperatures are generally higher and diurnal temperature swings smaller. A reduction in the indoor temperature of about 3-6๐C below the exterior air may be achievable, depending on the local climate, the amount of mass, its distribution and the ventilation details. More field and theoretical work are required to develop strategies to optimize the use of thermal mass and night ventilation in hot humid climates, particularly in institutional and commercial buildings which are occupied mainly during the day. Attention should also be given to the control of condensation in the structure or of the air that comes into contact with cool mass, given relatively high dew point temperatures in these climates.
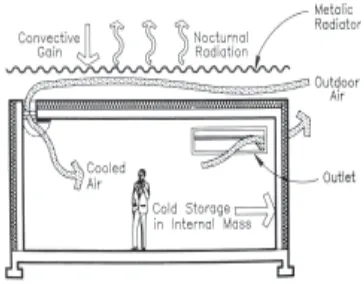
2.8.1 Radiant Cooling
Figure 1.7: A schematic of a radiant cooling system which involves cooling the roof by nocturnal radiation and
introducing cooled night air into the occupied space.
Another radiant cooling technique which has been tested in hot humid climates is one that circulates cool water behind panels attached to the envelope of a building and uses them as aheat sink for the interior space. A small system has been tested in Thailand which shows a promising performance (Figure 1.8). More field-testing is required on such a system, along with the development of generic design and control principles to optimize its performance.
Figure 1.8: A schematic of the cool radiant panel system tested in Thailand.
2.8.2 Indirect Evaporative Cooling
[image:39.595.81.489.420.541.2]roof garden. (This paper does not review direct evaporative cooling because the technique increases the indoor humidity level, and so is generally inappropriate for hot humid climates.)
a) Roof Pond
This system collects water on the roof of a building and lets it evaporate. The evaporation cools the roof which then serves as a heat sink for the interior. A roof pond system has been tested in the hot humid climate of Mexico, which has an insulation floating on the water surface to shield it from solar radiation during the day, and which circulates the water over the insulation at night to remove heat absorbed in the water by convection, evaporation and radiation (Figure 1.7). The performance of this so-called ‘cool roof’ is significant: it can cool the interior air by as much as 10-13oC below the outside air, depending on the ambient wet bulb temperature. To develop the roof pond technique in hot humid climates further, more work is required to test different types of pond, such as that which has embedded insulation or that which allows ventilation above the water surface. Furthermore, principles should be acquired for optimizing the design of the pond’s components, such as its depth and the roof’s mass, in order to maximize its cooling potential under different climatic and occupancy conditions. Insights could be drawn from work carried out in drier climates, in which a number of systems have been tested.
b) Roof Spray
REFERENCES
[1] "Kuching, Malaysia Weather History and Climate Data". WorldClimate.Retrieved 28 June 2008.
[2] de Dear, R. (2004). "Thermal comfort in practice".Indoor Air14 (Suppl 7): 32.
[3] Olesen, B. W. (2004). "International standards for the indoor environment". Indoor Air14 (Suppl 7): 18.
[4] Saw, Swee-Hock (2007). The population of Peninsular Malaysia. Singapore: Institute of Southeast Asian Studies. pp. 1–2. ISBN 978-981-230-730-9.
[5] "Malays Travel Guide:Climate of Malaysia". Circle of Asia. Retrieved 2008-07-28. [6] Marshall Cavendish Corporation (2008). World and Its Peoples: Malaysia,
Philippines, Singapore, and Brunei. New York: Marshall Cavendish Corporation. pp. 1156, 1158–1161, 1164, 1166–1171. ISBN 978-0-7614-7642-9.
[7] "Weather phenomena". Malaysian Meteorological Department.Archived from the original on 2008-03-20.Retrieved 2008-07-31.
[8] "General Climate Information". Malaysia Meteorological Department.Archived from the original on 2008-03-20.Retrieved 2008-07-28.
[9] Allard, F. (Ed.). (1998). Natural ventilation in buildings: A design handbook. London: James & James.
[10] Ghiaus, C., & Allard, F. (Eds.). (2005). Natural ventilation in the urban environment. London: Earthscan.
[11] Fanger, P. O. (1970). Thermal comfort, analysis and application in environment engineering.Copenhagen, Denmark: Danish Technical Press.
[12] Auliciems, A. (1981). Towards a psycho-physiological model of thermal perceptions. International Journal of Biochemistry, 25, 109-122.
[13] Humphreys, M. (1978). Outdoor temperatures and comfort indoors.Building Research & Practice, 6(2), 92-105.
[14] Szokolay, S. V. (2004). Introduction to architectural science: The basis of sustainable design. Oxford, UK: Architectural Press.
[16] Wong, N. H., Feriadi, H., Lim, P. Y., Tham, K. W., Sekhar, C., & Cheong, K. W. (2002). Thermal comfort evaluation of naturally ventilated public housing in Singapore. Building and Environment, 37, 1267-1277.
[17] Jitkhajornwanich, K. (2006). [Thermal comfort and adaptation for thermal comfort of local populations].The 2006 National Research Council of Thailand Award. Bangkok, Thailand, 117-120.
[18] Khedari, J., Yamtraipat, N., Pratintong, N., &Hirunlabh, J. (2000). Thailand ventilation comfort chart.Energy and Buildings, 32, 245-249.
[19] Mallick, F. H. (1996). Thermal comfort and building design in the tropical climates. Energy and Buildings, 23, 161-167.
[20] Srivajana, W. (2003). Effects of air velocity on thermal comfort in hot and humid climates.Thammasat International Journal of Science and Technology, 8(2), 45-54. [21] Hwang, R. L., Lin, T. P., &Kuo, N. J. (2006). Field experiments on thermal comfort
in campus classrooms in Taiwan. Energy and Buildings, 38, 53-62.
[22] de Dear, R. J., Leow, K. G., &Foo, S. C. (1991). Thermal comfort in the humid tropics: Field experiments in air conditioned and naturally ventilated buildings in Singapore. International Journal of Biometeorology, 34, 259-265.
[23] de Dear, R. J., &Brager, G. S. (1998).Developing an adaptive model of thermal comfort and preference.ASHRAE Transactions, 104(1a), 145-167.
[24] American Society of Heating, Refrigerating, and Air-Conditioning Engineers (ASHRAE). (1995). ASHRAEstandard 55-1992, addenda 1995: Thermal environmental conditions for human occupancy, includingANSI/ASHRAE addendum 55a-1995. Atlanta, GA: American Society of Heating, Refrigerating, and Air-Conditioning Engineers.
[25] Feriadi, H., & Wong, N. H. (2004). Thermal comfort for naturally ventilated houses in Indonesia.Energy and Buildings, 36, 614-626.
[26] International Standards Organisation (ISO). (2005). ISO 7730: 2005 Ergonomics of the thermal environment—Analytical determination and interpretation of thermal comfort using calculation of the PMV and PPD indices and local thermal comfort criteria. Geneva, Switzerland: International Standards Organisation.
[27] American Society of Heating, Refrigerating, and Air-Conditioning Engineers (ASHRAE). (2004). ANSI/ASHRAE standard 55-2004: Thermal environmental conditions for human occupancy. Atlanta, GA: American Society of Heating, Refrigerating, and Air-Conditioning Engineers.
[29] Olgyay, V. (1953). Bioclimatic approach to architecture (Building Research Advisory Board, Conference Report No. 5). Washington, DC: National Research Council. [30] Wongfun, S., Chindavanig, T., &Sreshthaputra, A. (2006). [Guidelines for utilization
of natural air flow pattern of traditional Thai house inresidence]. Journal of Energy Research, 3, 31-50.
[31] Leaurungreong, V., Oranratmanee, R., Sihalarth, P., &Insisiengmay, S. (2005). The local intelligence for a dwellings comfort living in Chiang Mai &LuangPrabang]. Journal of Energy Research, 2, 17-38.
[32] Tantasavasdi, C., Jareemit, D., Suwanchaiskul, A., &Naklada, T. (2007). Natural ventilation: Evaluation and design of houses in Thailand. Proceedings of the 3 Conference on Energy Network of Thailand [CD-ROM]. Bangkok, Thailand.
[33] Tantasavasdi, C. (2002). CFD approach towards natural ventilation design: Guidelines for houses in Thailand]. Journal of Architectural Research and Studies, 1, 45-63.
[34] Tantasavasdi, C., Srebric, J., & Chen, Q. (2001). Natural ventilation design for houses in Thailand. Energy and Buildings, 33, 815-824.
[35] Murakami, S., Kato, S., Ooka, R., &Shiraishi, Y. (2004). Design of a porous-type residential building model with low environmental load in hot and humid Asia. Energy and Buildings, 36, 1181-1189.
[36] Wang, L., & Wong, N. H. (2007). The impacts of ventilation strategies and facade on indoor thermal environment for naturally ventilated residential buildings in Singapore. Building and Environment, 42, 4006-4015.
[37] Tantasavasdi, C., &Jareemit, D. (2005). [Natural ventilation: Planning design
guidelines for residential high-rises]. Journal of Architectural/ Planning Research and Studies, 3, 23-36.
[38] Srisuwan, M. (2001). [Analysis of relationshipsbetween wind direction, building orientation and ventilation at green and clean university projectPhetchaburi Information Technology Campus].Sarasatr, 5, 145-158.
[39] Laopanitchakul, V., Sunakorn, P., &Srisutapan, A. (2007). Climbing-plants on solid wall reducingenergy in tropical climate. In S. W. Shin, & H. W. Lee (Eds.),
Proceedings of the InternationalConference on Sustainable Building Asia, SB07 Seoul (pp. 271-278). Seoul, Korea: Korean GreenBuilding Council (KGBC).
[40] Luxmoore, D. A., Jayasinghe, M. T. R., &Mahendran, M. (2005). Mitigating
temperature increasesin high lot density sub-tropical residential developments. Energy and Building, 37, 1212-1224.
[42] Mingozzi, A., &Bottiglioni, S. (2005). Logical use of traditional technologies for housing passivecooling in hot humid Italian climate areas. Proceedings of
International Conference: Passive and LowEnergy Cooling for the Built Environment. Santorini, Greece, 579-584.
[43] Wimolwattewee, A., Chindavanig, T., &Sreshthaputra, A. (2006). [Design guidelines for improving thermal comfortand energy efficiency of Baan Ua-Arthorn]. Journal of Energy Research, 3, 51-88.
[44] Suriyothin, P. (2002). Climatic design for energy efficient house in Thailand: Case study of a prototypehouse for four regions. Sarasatr, 5, 129-164.
[45] Garde, F., Mara, T., Lauret, A. P., Boyer, H., &Celaire, R. (2001). Bringing simulation to implementation:Presentation of a global approach in the design of passive solar buildings under humid tropicalclimates. Solar Energy, 71(2) 109-120. [46] Sumanon, R. (2004). [The uniqueangle of roof slope effecting thermal comfort in the
traditional Thai house].Sarasatr, 7, 193-218.
[47] Chukiatman, K. (1998). [Natural lighting for reducing energy consumption: Case study of buildings at Chulalongkorn University].Sarasatr, 2, 66-84.
[47] U-Sanno, K. (1997).[Appropriate shading devices forclassrooms]. Sarasatr, 1, 140-155.
![Figure 1.1: Bioclimatic chart modified for hot humid climates (adapted from Olgyay[30]followingJitkhajornwanich [15])](https://thumb-us.123doks.com/thumbv2/123dok_us/8767087.897011/28.595.136.464.74.287/figure-bioclimatic-chart-modified-climates-adapted-olgyay-followingjitkhajornwanich.webp)
![Figure 1.2:The orientation and spatial organization of a traditional Thai house [30].](https://thumb-us.123doks.com/thumbv2/123dok_us/8767087.897011/29.595.123.468.75.222/figure-orientation-spatial-organization-traditional-thai-house.webp)
![Figure 1.4: Examples of opening design to encourageinterior air movement [34].](https://thumb-us.123doks.com/thumbv2/123dok_us/8767087.897011/34.595.80.463.349.676/figure-examples-opening-design-encourageinterior-air-movement.webp)