Journal of Chemical and Pharmaceutical Research, 2016, 8(8):171-181
Research Article
CODEN(USA) : JCPRC5
ISSN : 0975-7384
171
Synthesis, characterization of vanadium complexes and evaluation their
anti-hyperglycemic effect
Fathy A. El-Saied
1, Samar A. Aly
2*and Tarek A. Salem
31Department of Chemistry, Faculty of Science, El-Menoufia University, Shebin El Kom, Egypt
2Department of Environmental Biotechnology, Genetic Engineering and Biotechnology Research Institute, Sadat
University
3
Department of Biochemistry, College of Medicine, Qassim University, Saudi Arabia
ABSTRACT
A series of new vanadyl complexes of ligands, N′-[(2-pyridine-2-yl-methylene)2-(phenylamino)] acetohydrazide
(HL1), N′-[(2-hydroxybenzyl-2-yl-methylene)2-(phenylamino)] acetohydrazide (HL2), 4-azocyanoacetamidoanlilne
antipyrine (HL3), 4-azocyanoacetamido-m-toludine (HL4), 4-azomalononitrile antipyrine (HL5) and
4-formylazohydrazoaniline antipyrine (HL6) have been prepared and physio-chemically characterized by using variety
of analytical, spectral, and magnetic measurements. The analytical and spectral data showed that the ligands HL1
and HL2 behave as neutral bidentate ligands, coordinating via the azomethine nitrogen atom and the hydrazo carbonyl group; whereas, HL3 forms binuclear VO(II) complex, the ligand linked to two VO(II) ions, one of ions coordinated to the pyrazolone carbonyl group and NH group and the second ion linked to the hydrazo carbonyl oxygen atom and azo (N=N) group. The rest of coordination number 5 is satisfied by bidentate sulfate group. The HL4 and HL5 behave as neutral bidentate ligands coordinating through the pyrazolone carbonyl group and NH group, in case of ligand HL5 in addition to the mentioned mode, (C=N) and (C≡N) group participated to bind a
second VO(II) ion to form binuclear complex. HL6 behaves as a neutral bidentate ligand reacted in its enol form via
the azomethine nitrogen atom and OH group. The magnetic and electronic spectral data showed that the VO(II) complexes exhibit a square pyramidal geometry. Results revealed that the oral administration of vanadium complexes significantly reduced the blood glucose level in diabetic rats. The normalization of altered biochemical parameters upon vanadium complexes treatment indicates the improved glucose homeostasis. The antidiabetic activity of vanadium complexes is structural-dependent where complexes 2, 4 and 6 exhibited potent antidiabetic activity while the other complexes have no antihyperglycemic activity. Further study is recommended to investigate the structural-activity relationship of vanadium complexes.
Key words: Vandyl complexes, IR, UV spectra and antidiabetic activity
INTRODUCTION
______________________________________________________________________________
172
Vanadium, an element from the transition metal group of the periodic table is proposed to be an essential trace element in animals and humans. Vanadium derivatives have been shown to possess insulin-mimetic and antidiabetic activities in animal models of type 1 and type 2 DM as well as in a small number of diabetic human subjects [4-7]. The coordination chemistry of vanadium has great versatility for adjustment of pharmacological characteristics [8]. However, most of the vanadium complexes so far investigated for their possible antidiabetic activity were poorly absorbed in their inorganic forms and required high doses which have been associated with undesirable side effects. In order to circumvent the toxicity, various organo vanadium complexes have been formulated and tested for their antidiabetic activity [9].
The modern era of studying the anti-diabetic properties of vanadium was initiated in 1985 by John McNeill, who monitored the cardiac function of rats with streptozotocin (STZ)-induced diabetes after treatment with vanadyl sulfate [10]. Previously, insulin-like effects of vanadium salts in cell systems such as adipocytes had been reported [11]. The STZ diabetic rat model is widely used to study the in vivo effects of vanadium compounds. STZ-induced diabetes is considered a type 1 diabetic model since it arises from destruction of some, but not all, of the insulin-producing pancreatic β-cells [12].
Having in view these aspects, an attempt has been made to synthesize novel vanadium complexes using antipyrine, hydrazone as an organic ligand. The metal complexes were characterized by different spectral studies. The antidiabetic activities of these complexes were evaluated in streptozotocin-induced experimental diabetes in rats.
EXPERIMENTAL SECTION
Materials
All the reagents and chemicals employed for the preparation of the ligands and their VO(II) complexes were of the best grade available (Merck) and used without further purification.
Synthesis of ligands
T he ethyl [(phenylamino)] acetate was prepared by refluxing equimolar amounts of a hot ethanolic solution of aniline, ethylchloroacetate and sodium acetate trihydrate for 6 hr. The mixture was poured on cold water and stirred for 30 min. The formed precipitate was filtered off, washed with ethanol and dried over anhydrous CaCl2,
M.P = 43°C [13].
The 2-[phenylamino]acetohydrazide was synthesized by adding ethanolic solution of hydrazine hydrate drop wise to an equimolar amount of ethyl[phenylamino]acetate, with stirring and heating. A white precipitate was formed after about 3h. The precipitate was filtered off, washed several times with ethanol and dried over anhydrous CaCl2 [14].
The Schiff bases ligands N′-[(2-pyridine-2-yl-methylene)2-(phenylamino)] acetohydrazide (HL1), and N′-[(2-hydroxybenzyl -2-yl-methylene)2-(phenylamino)] acetohydrazide (HL2) were prepared by refluxing equimolar amounts of 2-[phenylamino] acetohydrazide with, 2-pyridinealdehyde (HL1), 2-hydroxybezaldehyde (HL2) in 50 ml absolute ethanol for 3hr. The formed solid precipitate was filtered off and washed with ethanol. The product was recrystallized from ethanol and dried over anhydrous CaCl2 [15].
The ligands 4-azocyanoacetamidoanlilne antipyrine (HL3), 4-azocyanoacetamido-m-toludine (HL4) by coupling cyanoacetamido antipyrine with aniline or m-toludine respectively, in pyridine. The product was recrystallized several times from ethanol [16].
4-azomalononitrile antipyrine (HL5) was prepared by coupling the diazonium salt of 4-aminoantipyrine with malononitrile in sodium hydroxide [17]. 4-formylazohydrazoaniline antipyrine (HL6) was prepared by coupling the diazonium salt of aniline with 4-formylcyanoacetohydrazide antipyrine in sodium hydroxide solution [16].
Synthesis of VO (II) complexes
These complexes were prepared by refluxing a hot ethanolic solution of VOSO4.3H2O (in the presence of 2 ml
distilled H2O), with a suitable amount of a hot ethanolic solution of the ligand using (1L:1M) molar ratio. The
reaction mixtures were refluxed for 3hr with stirring. The products, which precipitated, were filtered off, washed several times with ethanol and dried in vacuum desiccators over anhydrous CaCl2.
Physical Measurements
173
by the Gouy method using mercuric tetrathiocyanatocobaltate (II) as the magnetic susceptibility standard. Diamagnetic corrections were estimated using Pascal’s constant [18]. The magnetic moments were calculated from the equation:
eff Mcorr
T
. 2 84. . .
Preparation of solutions of vanadium complexes
Seven newly synthesized vanadium complexes were freshly dissolved (w/v) in 60% DMSO immediately before use. Animals were orally received 1 mg/kg/day for 4 weeks.
Induction of experimental diabetes
Experimental diabetes was induced in male Wistar rats, weighing 160-180 g, by intraperitoneal injection of 60 mg/kg B.W. of streptozotocin dissolved in 0.1 M cold citrate buffer pH 4.5 [19]. On the third day, the development and aggravation of diabetes in rats was confirmed and rats with fasting blood glucose concentration more than 250 mg/dL were selected for the experiments [20]. The experiments were designed and conducted in strict accordance with the current ethical norms approved by Animal Ethical Committee guidelines. The rats were divided into six groups (comprising of six animals in each group) as follows: Group 1: Normal rats; Group 2: Streptozotocin-induced diabetic rats; Groups 3, 4, 5, 6, 7 and 8: Diabetic rats treated orally with 1 mg/kg B.W./day for 4 weeks of vanadium complexes 1, 2, 3, 4, 5, and 6; respectively.
Biochemical analysis
At the end of experiment, rats were fasted overnight, anaesthetized, using diethyl ether and sacrificed by cervical decapitation. Blood was collected with and without anticoagulant for plasma and serum separation, respectively. Fasting blood glucose, plasma insulin, plasma protein, blood urea and serum creatinine were estimated according to the manual instructions in the kits. The activities of ALT, AST and ALP in serum were assayed according to the kit procedure. Liver tissues were excised out, washed with ice cold saline and liver homogenate was prepared for glycogen estimation, reduced glutathione determination and lipid peroxidation estimation.
Determination of plasma insulin
Insulin levels in rat plasma were quantified by ELISA (Mercodia, Sweden). Briefly, Plasma insulin was captured by pre-titered amount of a monoclonal mouse anti-rat insulin antibodies and the binding of biotinylated polyclonal antibodies to the captured insulin. After washing, horseradish peroxidase (HRB) was titrated and washed for 5 times. The immobilized antibody-enzyme conjugates was quantified by monitoring HRB activities in the presence of the substrate 3,3',5,5'-tetramethylbenzidine. The enzyme activity was measured spectrophotometrically at 450 nm.
Determination of hepatic glycogen
Glycogen was isolated by digesting the liver slices with 1 ml of 30% (w/v) KOH in a boiling-water bath for 30 min. Then, 0.1 ml of 2% (w/v) Na2SO4 and 3 vol of ethanol were added to precipitate the glycogen. The isolated
glycogen was determined by the method of Roe and Daily [21].
Estimation of hepatic oxidative markers
Level of reduced glutathione (GSH) in liver homogenate was estimated by using the method mentioned by Beutler et al. [22]. Hepatic lipid peroxide was determined by the thiobarbituric acid (TBA) reaction described by Ohkawa et al.[23].
Estimation of hepatic glucokinase activity
One gram fresh liver tissue was homogenized with 9 ml Tris-KCl-EDTA buffer and centrifuged at 15000 rpm for 1 hr at 4oC. Twenty five microliters of the clear supernatant was used for glucokinase assay according to the method of Jamdar and Greengard [24].
Statistical analysis
All the data were grouped and statistically evaluated with MS Excel software. All values were presented as mean ± SD. Comparisons among groups were made by application of two-way analysis of variance ANOVA followed by one way ANOVA and post hoc analysis. Differences were considered statistically significant if p< 0.05.
RESULTS AND DISCUSSION
Elemental analysis and molar conductivity of the solid complexes
______________________________________________________________________________
174
antipyrine (HL6) with VOSO4 in (1:1) molar ratios, led to the formation of metal complexes shown in figure(2). All the compounds are brown or green, crystalline solids, and stable at room temperature. The complexes are insoluble in non-polar and polar solvents but soluble in polar coordinating solvents such as DMSO and DMF. Elemental analyses and physical data (Table 1), and spectral data (Tables 2 and 3) showed that the complexes have structures shown in Scheme (1). The elemental analyses showed that, the complexes 1-4 are mononuclear 1:1 metal complexes, whereas complex 5 is a binuclear complex and complex 6 is 2:1 metal complex (L:M). The molar conductivity of 110-3 M solution of the metal complexes 1-5 in N,N dimethylformamide (DMF) at room temperature are in the 6.8-17.1 -1cm2mol-1 range indicating the non-electrolytic nature of these complexes. These confirmed that the sulfate anion is coordinated to metal ion.
However, complex 6 has value 72.7 -1cm2mol-1, indicating the electrolytic nature of this complex. These data are agreeable with Greenwood et al. studies [25]. They have suggested 50-70 -1cm2mol-1 as the range for 1:1 electrolyte in DMF.
Table1: Analytical and some physical characteristics for VO(II) complexes
No. Complex Color Found (Calculated) % a M
C H N
1 [(VO)(HL1)(SO
4)] 5H2O Brown 37.9(37.8) 3.8(5.8) 13.2(12.9) --
2 [(VO)(HL2)(SO
4)] Green 41.3(41.7) 3.3(3.5) 9.8 (9.7) 14.0
3 [(VO)2(HL3)(SO4)2] Green 34.5(34.2) 3.1(2.7) 11.8(12.0) 6.8
4 [(VO)(HL4)(SO
4)] 4H2O Brown 40.2(40.5) 5.0(4.2) 13.6(13.5) 15.0
5 [(VO)2(HL5)(SO4)2] Brown 26.9(27.7) 2.1(2.0) 13.9(14.2) 16.5
6 [(VO)(HL6)
2(SO4)] Brown 51.9(52.2) 4.2(3.9) 20.3(20.9) 72.7 a Molar conductivity as 10-3 M solutions (ohm-1 cm2 mol-1)
Infrared spectra
The bonding mode of the ligands in the metal complexes has been deduced from the IR spectroscopy. The most diagnostic infrared spectral bands of the ligands and their VO(II) sulfate complexes were listed in table (2). The infrared spectra of ligands HL1 and HL2 reveal bands at 3390-3363, 3211-3185, 1698-1672, and 1603-1585 cm-1, the first two bands were assigned to ν(NH) and the other two bands were assigned to ν(C=O) and ν(C=N), respectively. The infrared spectra of complexes 1 and 2 show that the infrared bands corresponding to ν(C=O) and ν(C=N) appeared at lower wave-number compared to those of the free ligands, suggesting their coordination to the VO(II) ion.
The spectra of complexes also show that the bands corresponding to ν(NH) slightly shifted compared to those of the ligands as a result of coordination of neighboring groups. The spectrum of ligand HL2 shows a band at 3364 cm
-1
, assigned to ν(OH). This band appeared at the same position in the spectrum of complex 2 indicating that the OH group does not participate in coordination.
The infrared spectra of ligands HL3- HL6 show bands at 3397-3384 and 3250-3204, 2210-2205, the first two bands assignable to ν(NH) and the last band assigned to ν(C≡N); respectively. The spectrum of HL5
reveals another ν(C≡N) at 2362 cm-1 assignable to the second cyano group. Also, IR spectra of HL3- HL6 showed bands at
1645-1630 cm-1 assigned to ν(C=O) of pyrazolone ring.
The spectra of ligands HL3 and HL4 showed bands at 1687-1661 cm-1 assigned to ν(C=O) of hydrazone ring. The spectrum of HL6 does not show the band characteristic to ν(C=O) of hydrazone ring. In addition, two bands appeared at 1605cm-1 and 1585 cm-1 assigned to ν(-C=N-N=C), indicating that the ligand exists in the enol-form. The spectrum of ligand HL5 shows a band at 1587 cm-1 assigned to ν(C=N). The spectra of ligands HL3, HL4 and HL6 display a band at 1490- 1482 cm-1 attributed to ν(N=N).
The infrared spectrum of the binuclear complex 3 [(VO)2(HL4)(SO4)2] shows that the bands characteristic to ν(NH),
ν(C=O) of pyrazolone ring, ν(C=O) of hydrazone moiety and ν(N=N) appear at lower wave-numbers compared to those of the free ligand as a result of their participation in coordination to the vanadyl ion.
175
______________________________________________________________________________
176
The infrared spectrum of complex 4 [(VO)(HL4)SO4.4H2O] reveals that the bands corresponding to ν(NH) and
ν(C=O) of pyrazolone ring, appear at lower wave-numbers relative to those of the ligand, indicating that coordination took place via the NH and (C=O) of pyrazolone ring. The spectrum also shows that the bands due to ν(C≡N), ν(C=O) of hydrazone moiety and ν(N=N) appear at the same wave-numbers as those of the free ligand, indicating that these groups do not participate in coordination. The ligand in this complex behaved as a neutral bidentate ligand coordinated via the NH and carbonyl oxygen of pyrazolone ring.
The infrared spectrum of complex 5 [(VO)2(HL5)(SO4)2] shows that the bands corresponding to ν(C=O) of
hydrazone moiety and ν(NH) are shifted to higher wave-numbers as a result to their coordination whereas, the bands ascribed to one of the ν(C≡N) and ν(C=N) are shifted to lower wave-numbers compared to those of the free ligand, indicating that they participated in coordination to the vanadyl ion. Moreover, the second ν(C≡N) does not show any shift compared to that of the free ligand.
The infrared spectrum of complex 6 [(VO)(HL6)2(SO4)] shows that the band characteristic to ν(OH) is shifted to
lower wave-number as a result of its coordination .The band at 1603 cm-1 remains at the same position while, the band at 1585 cm-1 in the spectrum of the ligand is shifted to 1552 cm-1, indicating that the ligand coordinated in its enol form via the (C=N) and OH group. This is also supported by the disappearance of a band characteristic to to ν(C=O) of hydrazone moiety. The spectrum also shows that the bands corresponding to ν(C≡N), ν(C=O) and ν(N=N) do not show any shift, indicating that they do not participate in coordinandtion.
[image:6.595.141.473.390.619.2]The infrared spectra of vanadyl complexes exhibit two new bands at 1165-1124 cm-1 and 1041-1138 cm-1 assigned to coordinated sulfate group as a bidentate ligand. The spectra of all vanadyl complexes show three new bands at 989-971 cm-1, 623-602 cm-1 and 520-502 cm-1, assigned to ν(V=O) [26], ν(V-O) and ν(V-N), respectively [27]. The spectra of complexes 1 and 4 show broad band at 3435-3417 cm-1 assigned to stretching vibration of molecules of water of hydration.
Table 2: Infrared spectral bands and their assignments for ligands and their VO(II) complexes
ν(V-N) ν(V-O) ν(V=O) ν(SO4)
ν(N=N) ν(C=N) ν(C=O)b ν(C=O)a ν(C≡N) ν(NH) ν (OH)/H2O
-1603 1698 - - 3363, 3211 - HL1 510 605 977 1130, 1041 -1590 1660 -3270 3417 1 -1603 1691 -3187 3364 HL2 502 620 981 1139 1050 -1541 1611 -3280 3368 2 -1482 -1687 1644 2206 3397 -HL3 503 602 989 1149 1050 1475 -1661 1625 2207 3100 -3 -1488 -1661 1645 2210 3384 3204 -HL4 489 623 971 1165 1038 1488 -1660 1605 2209 3221 3435 4 -1587 -1630 2205 2362 3200 -HL5 510 607 976 1130 1045 -1568 -1638 1185 2360 3440 -5 -1490 1605 1585 -1645 2360 -3430 HL6 520 603 981 1152 1009 1494 1603 1552 -1645 2358 -3410 6
a=ν(CO)of pyrazolone ring, b=ν(CO) of hydrazine
Electronic spectra and magnetic moments
The electronic spectra of VO (II) complexes were recorded in Nujol mull. The characteristic spectral bands and magnetic moment values per metal ion measured at room temperature were listed in table (3).
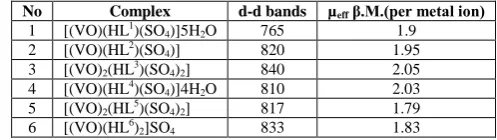
Table (3) reveals that the spectra of VO (II) complexes exhibit a band at 840-760 nm, assignable to 2B2→ 2E(ν1) in a
square pyramidal configuration [28]. The existence of the bands near 980 cm-1 in their infrared spectra of all complexes and the brown to green colors are good evidence for the proposed structure.
The magnetic moment values (µeff) per one metal ion in table (3) are consistent with the presence of one electron and
177
Table 3: Electronic spectral bands in the solid and room temperature magnetic moment values for VO (II) complexes
No Complex d-d bands µeff β.M.(per metal ion) 1 [(VO)(HL1)(SO
4)]5H2O 765 1.9
2 [(VO)(HL2)(SO
4)] 820 1.95
3 [(VO)2(HL3)(SO4)2] 840 2.05
4 [(VO)(HL4)(SO
4)]4H2O 810 2.03
5 [(VO)2(HL5)(SO4)2] 817 1.79
6 [(VO)(HL6)
2]SO4 833 1.83
Evaluation of anti-hyperglycemic activity of VO (II) complexes
STZ-induced diabetic rat model is widely used to study the in vivo effects of vanadium complexes. STZ-induced diabetes is considered a type 1 diabetic model since it arises from destruction of the insulin producing pancreatic β cells [29].
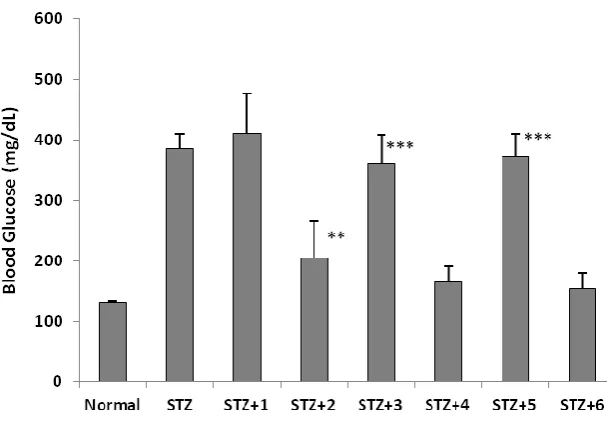
Figure (1) shows the blood glucose levels of control and experimental groups of rats. Streptozotocin-induced diabetic rats showed a marked increase (P<0.001) in glucose level as compared to that of the controls. Treatment of diabetic rats with different vanadium complexes showed varied effects on the blood glucose level.
Significant decreases in the blood glucose levels at fasting (P<0.001) were found when diabetic rats treated with complexes 2, 4 and 6 (as compared to diabetic group. There was no significant difference in blood glucose concentration in rats treated with vanadium complexes 1, 3 and 5. However, normal rats treated with the complexes did not show any significant alterations in the levels of fasting blood glucose (Data not mentioned).
Table (4) depicts the levels of activities of AST, ALT and ALP in serum of the control and experimental groups of rats. Results show that the activities of AST, ALT and ALP in serum of streptozotocin-induced diabetic rats were markedly elevated (P<0.001) as compared to that of the controls.
The elevated activities of AST, ALT and ALP were significantly decreased (P<0.001) in diabetic rats administered with vanadium complexes. The reduction in the levels of activities of AST (P<0.01), ALT (P<0.001) and ALP (P<0.01) was noted in the diabetic rats treated with complexes 2,4 and 6; while, there was no significant alteration in the levels of activities of these enzymes in diabetic rats treated with the other vanadium complexes when compared to diabetic rats.
Under normal physiological conditions, the activities of enzymes AST, ALT and ALP is low in serum and their activities are elevated during tissue damage. A rise in AST and ALT activity indicates the hepatocellular damage. Further, ALP is a marker of biliary function and cholestasis.
The observed increase in activities of these enzymes in the serum of diabetic rats may be due to the leakage of these enzymes from the liver cytosol into blood stream as a consequence of the hepatic tissue damage [30]. The significant reversal in AST, ALT and ALP activities in vanadium complexes treated diabetic rats indicate the tissue protective nature of the complex.
Also, table (4) shows the plasma protein, blood urea and serum creatinine levels in control and experimental groups of rats. The increased levels of urea and creatinine and reduced levels of total protein in STZ-induced diabetic rats were significantly improved (P<0.001) after treatment with vanadium complexes 2, 4 and 6 for four weeks. Normal rats treated with vanadium complexes showed no significant difference in these parameters (Data not shown). Insulin deprivation in diabetic milieu causes a profound increase in protein catabolism.
Moreover, protein catabolism in diabetes is due to a net increase in protein breakdown rather than a decline in protein synthesis [31].
The imbalance between synthesis and catabolism of protein can have remarkable consequences in the metabolism of many tissues such as gut, skeletal muscle and heart [32].The antidiabetic property of vanadium complexes may account for the observed increase in the levels of plasma proteins in diabetic rats treated with the complexes.
Urea is the main end product of protein catabolism in the body. During the diabetic conditions, the pronounced degradation of both hepatic as well as plasma proteins leads to the excessive accumulation of urea in the systemic circulation than its excretion. In diabetes, due to the elevated supra-physiological concentration of glucose, damages occur in tissues like kidney causing impairment in renal function resulting in the accumulation of nitrogenous wastes in circulation.
______________________________________________________________________________
178
Table 4: Effect of vanadium complexes on the liver and kidney functions in STZ-induced diabetic rats
ALT (U/L)
AST (U/L)
ALP (U/L)
Creat. (mg/dL)
Urea (mg/dL)
TP (g/dL) Normal 82.2±3.1 113.4±4.8 128.2±11.3 0.5±0.10 33.1±5.9 8.45±2.2
STZ 175.4±9.8 198.5±10.3 254.7±16.7 1.6±0.34 69.6±8.3 4.71±1.1
STZ+1 171.4±8.9 201.2±14.4 255.7±21.3 1.7±0.23 71.7±6.5 3.96±1.2
STZ+2 92.1±5.7* 121.4±10.4* 162.6±11.5* 0.35±0.04* 38.9±6.3* 7.87±1.5*
STZ+3 171.2±10.1 189.8±14.3 263.5±23.5 1.41±0.32 66.9±7.2 3.31±0.5
STZ+4 89.3±7.8* 114.5±9.7* 144.5±13.5* 0.44±0.06* 40.7±7.6* 8.21±1.3*
STZ+5 159.9±9.9 198.7±9.8 251.7±20.3 1.61±0.31 72.8±3.5 4.30±1.1
[image:8.595.152.456.250.464.2]STZ+6 77.8±6.5* 124.6±6.5* 152.7±17.3* 0.38±0.07* 36.7±7.6* 7.98±2.1* (*) Significant difference when compared with STZ-induced diabetic rats
Figure 1: Effect of vanadium complexes on the blood glucose in STZ-induced diabetic rats
(*) Significant, (**) High significant, (***) Very high significant, difference when compared with STZ-induced diabetic rats
Hepatic glycogen Levels of normal control and experimental groups of rats were demonstrated in table (5). The decreased hepatic glycogen content in STZ-induced diabetic rats were significantly restored (P<0.001) after oral administration of vanadium complexes 2, 4 and 6 for 4 weeks. Whereas no significant difference was observed in diabetic rats treated with the other complexes.
Glycogen is formed by the conversion of excess glucose into glycogen under the influence of insulin. Glycogen is stored as an energy fuel in tissues, predominantly in the liver and skeletal muscle. In diabetes, the reduced glycogen level in tissues is due to the insulin deficiency or impaired responsiveness of tissues to insulin [34]. In the present study, the improved liver glycogen content in diabetic rats treated with vanadium complexes indicates the effective glucose utilization and storage.
Hepatic glucokinase catalyses the conversion of glucose to glucose‐6‐phosphate and plays a central role in the maintenance of glucose homeostasis [35] and it is considered as a regulatory enzyme in the oxidation of glucose [36]. Being an insulin‐dependent enzyme, the hepatic glucokinase activity of diabetic rats is almost entirely inhibited or inactivated due to the absence of insulin [37].
As shown in table (5), the activity of hepatic glucokinase is significantly reduced in STZ-induced diabetes as compared to that of the normal rats. This is mainly induced by the high glucagon/insulin ratio in STZ animals. This reduction in the hepatic glucokinase activity in diabetic rats was significantly ameliorated in rats treated with vanadium complexes 2, 4 and 6.
179
Insulin influences the intracellular utilization of glucose in a number of ways. Insulin increases hepatic glycolysis by increasing the activity and amount of several key enzymes.The insulin level in plasma was significantly decreased in STZ‐induced diabetic rats due to the destruction of β‐cells of pancreas thereby inhibiting insulin release (table 5). Oral administration of vanadium complexes 2, 4 and 6 significantly increased the levels of plasma insulin in STZ‐induced diabetic rats when compared with diabetic control rats.
These complexes stimulate the secretion of insulin from β‐cells of pancreas. In hyperglycemic animals, it is possible that, certain vanadium complexes may act by potentiating of pancreatic secretion or increasing glucose uptake [38].
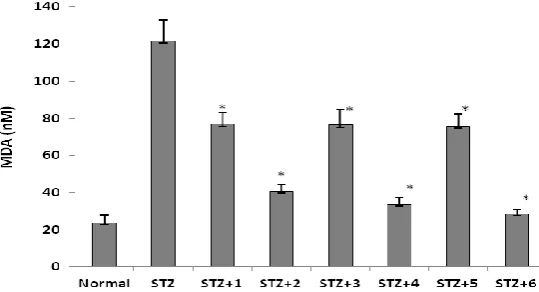
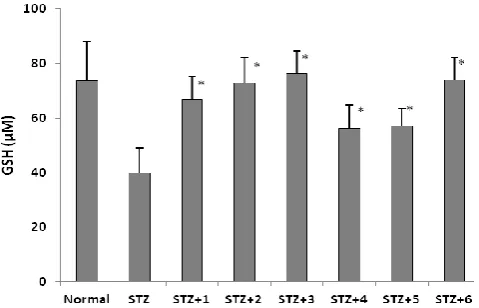
Figure (2) shows the lipid peroxidation in the different groups evaluated by hepatic malodialdehyde (MDA). The results indicate that the hepatic MDA concentration increased five-fold in the STZ group compared to controls. The levels of hepatic MDA were significantly decreased in STZ-induced diabetic rats after treatment with vanadium complexes. The changes in the level of hepatic reduced glutathione (GSH) associated with hyperglycemia and diabetes, as well as the effect of vanadium complexes treatment are shown on figure (3).
[image:9.595.218.392.321.413.2]The hepatic GSH concentration was significantly decreased in STZ-induced diabetic rats when compared to that of the controls. Furthermore, all vanadium-treated rats had a higher glutathione level in comparison to the diabetic group. This finding is in agreement with the result of krośniak et al. [39]. In a previous study, the levels of lipid peroxidation increased whereas glutathione decreased, representing increased utilization due to oxidative stress, which was reversed by the administration of vanadyl sulfate in STZ-diabetic animals [40].
Table 5: Effect of vanadium complexes on the levels of hepatic glycogen, plasma insulin and glucokinase activity in STZ-induced diabetic rats
Glycogen (mg/g)
Insulin
(μU/ml) Glucokinase (U/mg) Normal 13.6±2.1 18.3±1.4 57.6±8.9
STZ 4.1±1.3 8.1±0.3 14.3±1.4
STZ+1 4.3±0.5 6.3±0.4 18.5±3.1
STZ+2 11.6±3.1* 17.6±3.2* 53.6±6.1*
STZ+3 3.6±1.1 6.7±1.6 13.1±2.1
STZ+4 12.6±2.1* 16.9±2.4* 55.3±5.2*
STZ+5 3.9±1.4 7.4±1.8 15.6±1.5
STZ+6 14.6±3.1* 19.3±3.1* 61.7±7.3*
[image:9.595.169.439.438.584.2](*) Significant difference when compared with STZ-induced diabetic rats
Figure 2: Effect of vanadium complexes on the hepatic MDA level in STZ-induced diabetic rats
______________________________________________________________________________
[image:10.595.187.427.76.230.2]180
Figure 3: Effect of vanadium complexes on the hepatic GSH level in STZ-induced diabetic rats
(*) Significant difference when compared with STZ-induced diabetic rats.
CONCLUSION
In conclusion, the present study revealed that the oral administration of vanadium- complexes evoked marked blood glucose lowering effect in diabetic rats. The normalization of altered biochemical parameters upon vanadium complexes treatment indicates the improved glucose homeostasis. Meanwhile, the oxidative stress accompanied with diabetes was modulated after treatment with vanadium complexes. The antidiabetic activity of vanadium complexes is structural-dependent where complexes 2, 4 and 6 exhibited potent antidiabetic activity while the other complexes have no antihyperglycemic activity. Further study is recommended to investigate the structural-activity relationship of vanadium complexes.
Acknowledgement
Thanks are due to Scientific Research Deanship, Qassim University, KSA, for financially supporting of research project number 1201.
REFERENCES
[1] V Sabetsky; J Ekblom; J Pharmacol Res, 2010, 61, 1-4.
[2] American Diabetes Association. Diagnosis and classification of diabetes mellitus. Diabetes Care, 2010, 33, 562-69.
[3] WHO. Diabetes Mellitus, Reports of a WHO Study Group. WHO Technical Report Series, 1985, 727, 876. [4] B Ramachandran; D S Sekar; M Kandaswamy; V Narayanan; S Subramanian,
Exp Diabets Res, 2004, 5, 137-142.
[5] B Ramachandran; M Kandaswamy; V Narayanan; S Subramanian, Diabetes Obes Metab, 2003, 5, 455-461. [6] B Ramachandran; K Ravi; V Narayanan; M Kandaswamy; S Subramanian, J. Clin Chim Acta, 2004, 345,141-150.
[7] B Ramachandran; K Ravi; V Narayanan; M Kandaswamy; S Subramanian, J. Chem Biol Interact, 2004, 149, 9-21.
[8] H K Thompson; C Orvig, J. Chem Soc Dalton Trans, 2000, 2885-2892. [9] H Sakurai; H Sano; T Takino; H Yasui, J. Inorg. Biochem, 2000, 80, 99-105. [10] C E Heyliger; AG Tahiliani; J H Mcneill, J. Science, 1985, 227, 1474. [11] H Degani; M Gochin; S D Karlish; Y Shechter, J. Biochem,1981, 20, 5795.
[12] J H McNeill, Experimental Models of Diabetes. CRC Press, Boca Raton, FL, USA, 1999. [13] S A El-Tabl; F A El-Saied; W Plass, J. Spectorcchim. Acta Part A, 2008, 71, 90.
[14] F A El-Saied; M E Shakdofa; A N Al-Hakimi, J. Korean Chem. Soc, 2011, 55,
[15] S M Emam; F A El-Saed; S A Abou El-Enein; H A El-Shater, J. Spectrochim. Acta PartA, 2009, 72, 291. [16] F A El-Saied; M I Ayad; R M Issa; S A Aly, Polish J. Chem,2001, 75, 773- 783.
[17] F A El-Saied; M I Ayad; R M Issa; S A Aly, Polish J. Chem,2001, 74, 919-926. [18] L Lewis; RG Wilkins, Modern coordination chemistry Interscience, New York, 1960. [19] N Rakieten; M L Rakieten; M V Nadkarni, J. Cancer Chemother Rep.,1963, 29, 91-98. [20] L J Fischer; D E Rickert, J. Crit Rev. Toxicol,1975, 3, 231-263.
[21] J H Roe; R E Dailey, J. Anal. Biochem,1966, 15, 245-250. [22] E Beutler; O Duron; M B Kelly, J. Lab. Clin. Med,1963, 61,882.
181
[25] N N Greenwood; B P Straughan; A E Wilson, J. Chem. Soc. A, 1968, 2209. [26] M H Hamada; O El-Shafai; A A El-Asmy, J. Trans. Met. Chem, 31, 2006, 714
[27] A.A El-Asmy; I M Gaber; N M El-Metwally; S E Ghazy; D A Abdel-Basser, J. Coord. Chem,2008, 61, 3620. [28] M M Rakha; Bekheit T H, J. Chem. Pharm. Bull, 2008, 48, 914.
[29] SI Pillai; S P Subramanian; M A Kandaswamy, Eur. J. Med. Chem, 2013.
[30] M van den Brand, L D Elving; J P Drenth; J H van Krieken, J. Neth Med, 2009, 67, 394-396. [31] N Møller; K S Nair, J. Diabetes, 2008, 57, 3-4.
[32] P H Sugden; S J Fuller, J. Biochem,1991, 273, 21-37.
[33] H Bräunlich; F Marx; C Fleck; G Stein, J. Exp. Toxicol Pathol,1997, 49, 135-139.
[34] M G Bischof; M Krssak; M Krebs; E Bernroider; H Stingl; W Waldhäusl; M Roden, J. Diabetes, 2001, 50, 392-398.
[35] M Laakso; M Malkki; S Deeb, Diabetes, 1995; 44, 330‐334.
[36] R ODoherty; D Lehman; S Telemaque‐Potts; CB Newgard, Diabetes,1999, 48, 2022‐2027. [37] D Gupta; J Raju; J Prakash; N Z Baquer, J. Diabetes Res Clin Pract, 1999, 46, 1‐7.
[38] P Malini; G Kanchana; M Rajadurai, Asian J. Pharmaceut Clin Res,2011, 4(3), 124- 128. [39] M Krośniak; M Gawlik; R Gryboś; J. Bull. Vet Inst. Pulawy, 2009, 53, 535-540.