International Conference on Mechanical Engineering Research (ICMER2013), 1-3 July 2013 Bukit Gambang Resort City, Kuantan, Pahang, Malaysia Organized by Faculty of Mechanical Engineering, Universiti Malaysia Pahang Paper ID: P046
ANALYSIS REVERBERATION TIME IN UTHM LECTRUR ROOM USING TEORITICAL METHOD AND ISO 3382 MEASUREMENT
Azril1, M. Imran1, Noormaziah1
1
Universiti Tun Hussein Onn Malaysia (UTHM) 86400 Parit Raja, Batu Pahat Johor, Malaysia
[email protected] Phone: +6013-5010174
ABSTRACT
This study was conducted to examine the difference between the value of the reverberation time gain by calculation using theoretical method and measurements in real room. The study involved a lecturer room in University Tun Hussain Onn Malaysia (UTHM). The theoretical methods used were Sabine, Eyring and Millington-Sette. Measurement in the actual room used a method that had been stated in ISO 3382, interrupted noise method. The room setting was divided into 3 conditions that were empty room, room with curtains and room using egg containers as sound absorbers. Calculation method was based on the three room conditions. Measurement and calculation results of reverberation time were analyzed with the method of mean absolute error (MAE). The analysis was done based on the formulas used, and based on the variables. The results showed that Sabine formula produces the closest reverberation time value with the actual measurement.
Keywords: Reverberation time, theoretical method, sound measurement
INTRODUCTION
Lectrure room is not just a work place for lecturer, but it is also a place where students discuss their problems and plans with their lectur. It must have good acoustic characteristic i.e. reverberation time, so the discussions carried out are not disturbed. The reverberation time is generated when the sound inside the lecturer room is continuously reflected for a certain period of time after the source of sound has stopped. Generally, it is defined as the time taken for the sound energy to decay by 60dB of its original intensity (Webb and Bines, 1991).
Reverberation time can be obtained by using a measuring method following the ISO 3382 (ISO 3382-1, 2009). This method requires equipment such as omnidirection sound source, microphone and computer to collect and analyze the data. This equipment gives accuracy results but it only can be conducted by an expertise and requires more time to measure. To surmount this problem, there have been many kind of methods proposed to obtain the reverberation time such as Finite Element Method (Okuzuno et al., 2012), Boundary Element Method (Zhou and Crocker, 2010), and Ray –tracing (Bot, 2002), but most of them are complex computational schemes. Besides that, the theoretical methods are also popular to obtain the reverberation time such as Sabine (Sabine, 1992), Eyring (Eyring, 1930) and Millington-Settle (Millington, 1932). Indeed, the computational results are more accurate compared to using theoretical method (Passero and Zannin, 2010), but in the other view, the theoretical method is easy to calculate and the results are acceptable as a predictor.
for predicting the reverberation time in UTHM lecturer room. The theoretical methods are compared with the measurement method (ISO3382) to identify the errors value between them. The minimum errors from one of them will be chosen as relevant method to be applied in UTHM lecturer rooms. As mentioned, the theoretical methods will be used in this study are Sabine, Eyring and Millington-Sette equation. As mentioned, there are several types of theoretical methods but for this study we only consider those equations as they are easy and simple to calculate. The followings are the formulas used in this study: -
Sabine
(1)
Eyring
− 𝑙𝑛( − ) (2)
Milingtton-Sette
− ∑ S𝑙𝑛( − ) (3)
where
is the volume of the room is the area of each material
is the absorption coefficient of each material
is the neperian logarithm
Data of reverberation time obtained by measurement and calculation were analyzed by using stactical method called mean absolute error (MAE). This method gives the value of the difference between the prediction and the actual value. The formula is given below:
𝑀𝐴𝐸
∑(𝑎−𝑒)𝑛 (4) where
is the actual value. is the predicted value.
is the total value of the research data.
MEASUREMENT USING NOISE INTERUPTED METHOD
Materials used as a variable were curtains (238.89 g/m2) and egg containers (9.61m2, 0.05m high). Curtains were placed at the main window. Curtain was chosen because it was easily obtained and porous. Egg containers were used because they were cheap and easy to obtain. Egg containers were placed around the room's walls. The value of the absorption coefficients for the building materials and variables are shown in Table 1.
Measurements in real rooms were done by using noise interrupted method. This method was chosen because it met the international standards of ISO 3382, standard for room’s reverberation time measurement for to the acoustic variables. This measurement was done by producing a broadband sound produced by omni-directional speaker. The sound produced was stopped suddenly to get reverberations sound. Sound cannot be used in repeated sequence (ISO 3382-1, 2009).
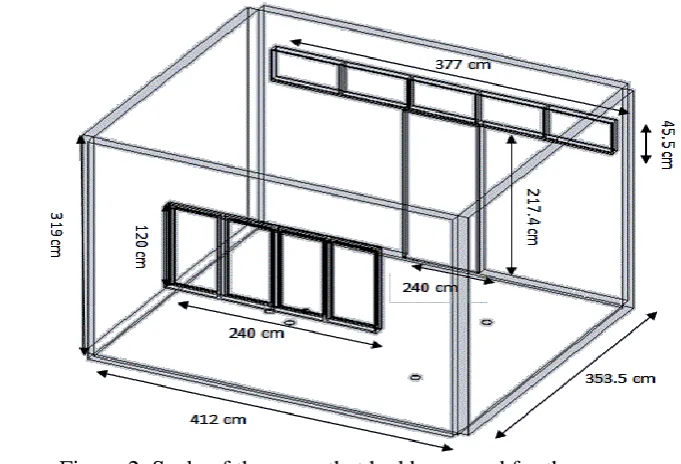
[image:3.595.99.509.97.282.2](a) (b) (c)
Figure 1. Office room used during the actual measurements show (a) Door and peneterate window (b) Window with curtain (c) Room that used egg containes as
sound absober.
[image:3.595.117.458.341.573.2]Table 1.Value of absorbtion coefficient for construction material and variable (curtain and egg containers) (Bies and Hansen, 2003; Antonio, 2010).
Material Frequency
125Hz 250Hz 500Hz 1000Hz 2000Hz 4000Hz Window
Wooden door Plaster brick
Cork Tile Concrite Egg container
0.35 0.14
0.25 0.1
0.18 0.06
0.12 0.08
0.07 0.1
0.04 0.1 0.013
0.02
0.015 0.03
0.02 0.03
0.03 0.03
0.04 0.03
0.05 0.02 0.01
0.04
0.01 0.3
0.01 0.42
0.02 0.48
0.02 0.69
0.02 0.69
Curtain 0.07 0.31 0.49 0.75 0.7 0.6
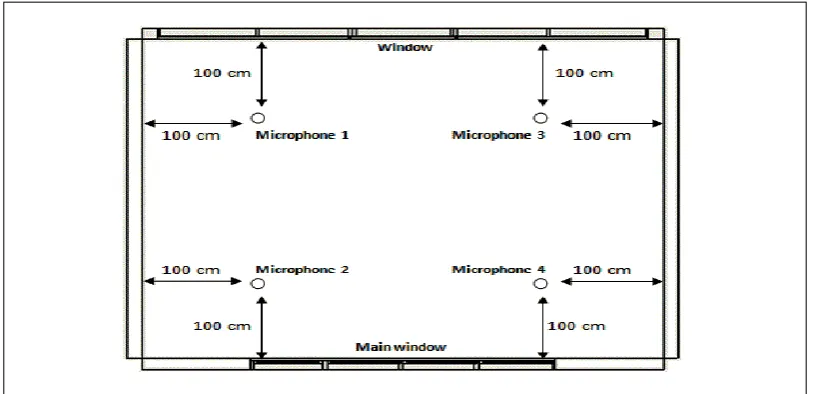
The equipments for the measurement were Bruel Kjear omni-directional speaker and Bruel Kjear amplifier. Computer software named DB Bati 32 was used to collect and analyzed the data during the experiment. 2 units of microphones were used to receive the reverberations sound. In the room, there were four locations for the measurement of reverberation time. Figure 3 shows the microphones location.
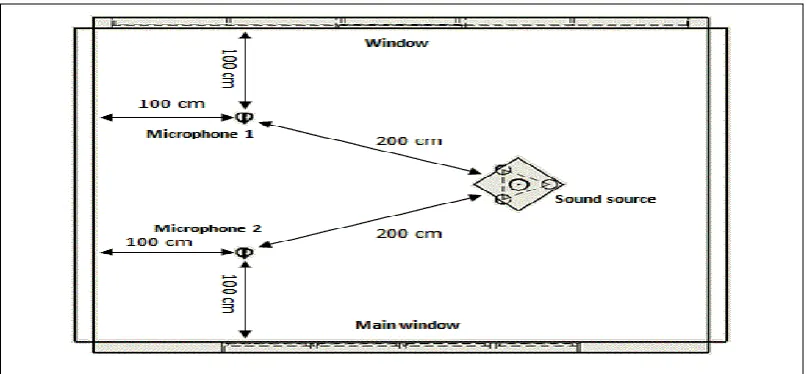
Because of the small size of the room, the four microphones could not be placed in areas with simultaneous measurements. Based on standardization of ISO 3382, the sound source has to be located 200 m from the microphone sound receiver, while the microphone should have a 100 m distance from the wall surface. Therefore, measurements were made in two sets, set A as shown in Figure 4 and for set B, speaker position had be set opposite from its normal position. Measurement was made in the frequency range of 125 Hz to 4000 Hz as specified by ISO 3382 when using interrupted noise method.
The values of reverberation time were taken 12 times for each measurement location to obtain an accurate reading. Thus, the total numbers of readings for a condition of room with four measurement locations was 48 readings. All readings were averaged over to obtain the value of a single RT value.
[image:4.595.91.501.510.707.2]Figure 4. Location of measurement equipment for set A
REVERBERATION TIME COMPARISON BETWEEN MEASUREMENT AND CALCULATION METHOD
Reverberation time results were calculatied using the Sabine, Eyring and Millington-Sette formula and classified according to the type of formulas, further compared with the measured reverberation time in a real room. Comparisons were made using the MAE method. The highest recorded value of reverberation time during the measurement was 3.6 s, recorded in the room with curtains at a frequency of 250 Hz. The lowest value was recorded in the room that used egg containers as sound absorbers, valued 0.47 s at a frequency of 2000 Hz and 4000 Hz.
When using the Sabine formula, the calculation of reverberation time recorded the highest rate in the room with curtains valued 3.64 s at a frequency of 125 Hz. The lowest value was recorded in the room that used egg container as sound absorbers with the value of 0.24 s in the frequency of 2000 Hz. The largest rate of the comparison between calculation and measurement was 0.87 s in the room with curtains at frequency of 250 Hz. The lowest rate difference was 0.09 s in the empty room at a frequency of 2000 Hz.
The highest value recorded during the reverberation time calculation using Eyring formulas was 3.6 s in the room with curtains at a frequency of 125 Hz. The lowest value was recorded in the room using egg container as sound absorber is 0.19 seconds at a frequency of 2000 Hz. The highest difference between calculations and measurements recorded in the room with curtains was 0.9 s at a frequency 250 Hz. The lowest different valued was recorded in the empty room that was 0.1 s at frequency 1000 Hz.
[image:5.595.103.507.75.262.2]Table 2.Comparison of calculation and measurement based of room condition by using Sabine formula (C= calculation, M= measurement).
Room condition
Frequency
125Hz 250Hz 500Hz 1000Hz 2000Hz 4000Hz Empty room C M 2.61 3.29 2.9 3.13 3.13 3.28 2.75 2.8 2.53 2.62 2.42 2.67 Curtain C
[image:6.595.80.519.307.421.2]M 3.64 3.32 2.73 3.6 2.28 1.55 1.65 1.17 1.57 1.17 1.59 1.18 Egg Container C M 1.86 2.16 0.51 0.8 0.39 0.72 0.34 0.53 0.24 0.47 0.25 0.47
Table 3.Comparison of calculation and measurement based of room condition by using Eyring formula (C= calculation, M= measurement).
Room condition
Frequency
125Hz 250Hz 500Hz 1000Hz 2000Hz 4000Hz Empty room C M 2.92 3.29 2.86 3.13 3.08 3.28 2.7 2.8 2.49 2.62 2.39 2.67 Curtain C
M 3.6 3.32 2.7 3.6 2.23 1.55 1.59 1.17 1.52 1.17 1.54 1.18 Egg Container C M 1.82 2.16 0.46 0.8 0.34 0.72 0.29 0.53 0.19 0.47 0.2 0.47
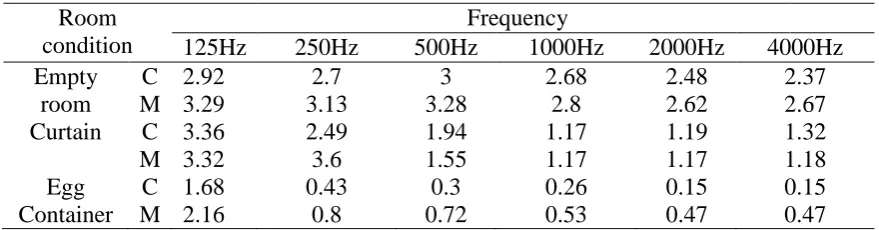
Table 4.Comparison of calculation and measurement based of room condition by using Milingtton-Sette formula (C= calculation, M= measurement).
Room condition
Frequency
125Hz 250Hz 500Hz 1000Hz 2000Hz 4000Hz Empty room C M 2.92 3.29 2.7 3.13 3 3.28 2.68 2.8 2.48 2.62 2.37 2.67 Curtain C
M 3.36 3.32 2.49 3.6 1.94 1.55 1.17 1.17 1.19 1.17 1.32 1.18 Egg Container C M 1.68 2.16 0.43 0.8 0.3 0.72 0.26 0.53 0.15 0.47 0.15 0.47
COMPARISON MAE VALUE OF REVERBERATION TIME
[image:6.595.78.518.480.595.2]Figure 5.MAE graph for empty room (○ = Sabine’s formula, ■ = Eyring’s formula, □ = Melingtton-Sette’s formula ).
Figure 6.MAE graph for room with curtain (○ = Sabine’s formula, ■ = Eyring’s formula, □ = Melingtton-Sette’s formula ).
[image:7.595.143.449.547.712.2]Figure 5 shows the MAE rate of reverberation time in the empty room. The highest value produced by the Millington-Sette formula was valued 1 s at 250 Hz. The lowest value was produced by the Sabine formula, valued 0.069 s at a frequency of 1000 Hz. Millington-Sette formula has produced the highest value for each frequency followed by Eyring and Sabine produced the lowest rate. At 125 Hz, Sabine formula produced 0.684 s which was higher than the Eyring formula that produced 0.373 s. At low frequencies MAE value each formula is different in a big rate. The difference rate of MAE was getting smaller as the frequency increased. Therefore the smallest MAE rate differences were at the frequency 4000 Hz.
The high difference between the formula rates at low frequencies was due to the unstable rate of noise decreasing. This has caused a large different between the calculation and measurement. When the frequency was increased, the more stable the graph reduction of noise generated (Everest and Pohlmann, 2009). This incident also occurred during the experiment.
Figure 6 shows the rate of reverberation time MAE when the curtains were used. The graph shows a small difference value of MAE between formulas at low frequencies, but there was a big difference at high frequencies. The highest value produced by the Millington-Sette formula at a frequency of 250 Hz was 1.109 s. While the lowest MAE value was also produced by the Millington-Sette formula which was 0.116 s at a frequency 125 Hz. Sabine’s formula has produced the highest MAE, followed by Eyring and the smallest MAE values were produced by Milington-Sette formula. At frequency 250 Hz, MAE values of Milington-Sette was the highest, followed by Eyring and smallest MAE values were produced by the Sabine formula.
Based on Figure 6, at a frequency of 250 Hz, the value of reverberation time MAE increased in higher rate. The cause of this matter was due to the curtains position that was very close to the main window. Sounds penetrating through curtains that reflected the energy from the window caused the change in readings taken. The distance between the curtains and reflective surface can react on the absorption coefficient at high rates (Everest and Pohlmann, 2009). In this experiment it had affected and changed the reading especially for frequency of 250 Hz.
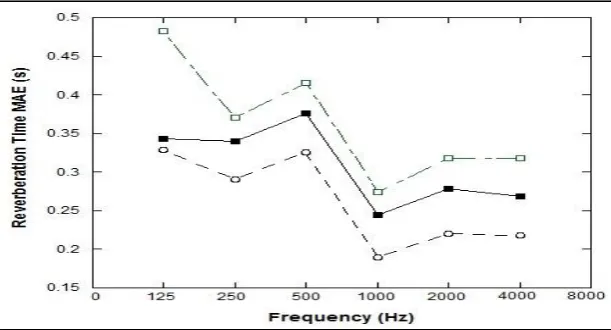
Figure 7 shows the MAE rate of reverberation time when the eggs containers were used as sound absorption. The highest MAE of reverberation time rate was 0.48 s. It was produced by the Millington-Sette formula at a frequency of 125 Hz. The lowest value was produced by the Sabine formula that was 0.19 s at frequency of 1000 Hz. The Millington-Sette formula has produced reverberation time MAE highest value followed by Eyring formula and the last was Sabine formula. From the graph, the value of MAE reverberation time decreased from low frequency to high frequency.
The error decreases from low frequency to high frequency due to the selection of sound absorption material. When measuring, egg containers were used as sound absorption materials. The whole wall of the room affixed with egg container. The opening cell cavity and the air space behind the egg container can make different in sound absorption rate. As a result of sound absorption material affixed on the whole wall, it causing error to increase (Everest and Pohlmann, 2009).
In this experiment Sabine formula was the most accurate compared to Eyring and Millington-Sette formula. The factor that gave a huge impact for the result was the room used in this experiment is catogorised as LIVE room. Sabine formula is the best formula compared to other formula because Sabine formula was suitable in LIVE room that requires less of sound absorbtion. Eyring formula was suitable to calculate reverberation time in places that have high sound absortion (Neubauer and Kostek). Eyring and Millington-Sette formula were inappropriate formula to be used to calculate reverberation time in UTHM lecturer room.
CONCLUSION
In this experiment, Sabine formula recorded the lowest MAE value of reverberation time. This proved that reverberation time value of the Sabin formula was close to the actual room measurement and suitable for LIVE room. The best value obtained was 0.069 s in the empty room. While Milingtton-Sette’s formula highest MAE value was1.109 s.
In addition to room conditions, there were variety of factors that make the reverberation time rates obtained were different between theoretical methods and calculation methods. The factors that been identified are:-
i. Sound frequency used in measurement. ii. Location of absoption material in the room. iii. Kind of material that been used.
ACKNOWLEDGEMENT
This study is supported by the ORICC. Graceful to Universiti Tun Hussein Onn Malaysia (UTHM) for supporting the author’s studying here (2012 – 2013)
REFERENCES
Antonio, Q. R. 2010. Measurement of the sound-absorption coefficient on egg cartons using the Tone Burst Method. AMTA'10 Proceedings of the 11th WSEAS international conference on Acoustics & music: theory & applications, 24-29. Bies, D. A. and Hansen, C. H. 2003. Engineering Noise Control, Theory and Pratice,
3rd ed, Spon Press, Tylor and Francis Group, pp 300-302.
Bot, A.E. 2002. A function equation for specural reflection of rays. J.Acoust. Soc. Am.
112 (4), 1276-1287.
Eyring, C.F. 1930. Reverberation time in “dead” rooms. J. Acoust. Soc. Am. 1, 217-241
Everest, F. A. and Pohlmann, K. C. 2009. Master Handbook of Acoustics, 5th ed, Mc Graw Hill, pp 164-165, 193-197.
ISO 3382-1:2009. Measurement of room acoustic parameters
Millington, G. 1932. A modified formula for reverberation. J. Acoust. Soc. Am. 4, 69-82
Okuzono, T., Otsuru, T., Tomiku, R. and Okamoto, N. 2012. “Application of Modified Integration rule to time-domain finite-element acoustic simulation of room.” J. Acoust. Soc. Am, 132(2), pp 804-813.
Passero, C.R.M. and Zannin, P.H.T. 2010. “Statistical comparison of reverberation times measured by the integrated impulse response and interrupted noise methods, computationally simulated with ODEON software, and calculated by Sabine, Eyring and Arau-Puchades’s formula.” App. Acoust. 71(12). 1204-1210.
Rossing, T. D., Moore F. R. and Wheeler, P. A. 2002. The Science of Sound, 3rd ed, Addison Wesley, pp 581-582.
Sabine, W.C. 1992. “Collected Paper on Acoustic” Harvard University, Cambridge, MA.
Webb, J. D., and Bines, R. D. 1991. Noise Control in Industry, 3rd ed, Sound Research Laboratories Ltd,E and F. N. Spon, pp 53.