TITLE
A STUDY OF ENERGY EFFICIENCY BUILDING LIGHTING SYSTEM DESIGN
MOHD HAFIEZ BIN AHMAD
A project report submitted in partial fulfillment of the requirement for the award of the
Degree of Master of Electrical Engineering
ABSTRACT
ABSTRAK
CONTENTS
TITLE i
DECLARATION ii
ACKNOWLEDGEMENTS iii
ABSTRACT iv
CONTENTS vi
LIST OF TABLES viii
LIST OF FIGURES ix
LIST OF APPENDICES xi
CHAPTER 1 INTRODUCTION 1
1.1 Research background 1
1.1.1 The important of understanding the high energy efficiency on campus 2 1.1.2 High energy efficiency as a holistic tool to improve energy
consumption on campus 2
1.2 Problem statement 3
1.3 Objective 3
1.4 Project scope 3
1.5 Thesis outline 4
CHAPTER 2 LITERATURE REVIEW 5
2.1 Energy efficiency 5
2.1.1 Glare 6
2.1.1 Uniformity 8
CHAPTER 3 METHODOLOGY 16
3.1 Determine the lighting requirement 19
3.2 Select adequate lamp fit 19
3.3 Luminaries 22
3.4 Simulation DIAlux 26
3.5 Operation cost 27
CHAPTER 4 DATA ANALYSIS AND RESULTS 31
4.1 Lighting System design luminaries 31
4.1.1. Case 1: Using T8 Lighting System 31
4.1.2. Case 2: Using T5 Lighting System 33
4.1.3. Case 3: Using LED Lighting System 34
4.2 Simulation DIAlux 36
4.2.1. Case 1: Using T8 Lighting System 36
4.2.2. Case 2: Using T5 Lighting System 39
4.2.3. Case 3: Using LED Lighting System 42
4.2.4. Simulation result 44
4.3 Analysis, the results against the technical requirements, lighting
features, energy saving and the operating cost 45
4.3.1. Replacing Lighting System 46
4.3.2. Result Pay Back Period (RPBP) 47
CHAPTER 5 DISCUSSION AND CONCLUSIONS 48
5.1 Discussion 48
5.2 Conclusion 49
REFERENCES li
APPENDIX liii
Appendix A: Data Sheet T8 liii
Appendix B: Data sheet T5 liv
LIST OF TABLES
Table 2.1 : Glare rating according to UGR 8
Table 2.2 : Colour Rendering Index(CRI) 9
Table 2.3 : Lamp efficiency and service life 10
Table 2.4 : Comparison of luminous efficacy and heat dissipation of LEDs and
fluorescent lamps 11
Table 2.5 : Suitability of ballast types for various fluorescent lamp groups 15
Table 3.1: Recommended Lux (lx) values 19
Table 3.2 : Quantity Estimation Diagram 23
Table 3.3 : Utilization Factor (UF) 24
Table 3.4 : Hour of using laboratory 28
Table 4.1 : Room Index using T8 Lighting System 32
Table 4.2 : Number of Luminaire T8 Lighting System 32
Table 4.3 : Number of Luminaire T5 Lighting System 34
Table 4.4 : Number of Luminaire LED Lighting System 35
Table 4.5 : Summarize Simulation DIALux 44
Table 4.6 : Calculation total annual cost for each Lighting System 45
LIST OF FIGURES
Figure 2.1 : Disability glare from a light fitting 6
Figure 2.2 : Disability glare form windows 6
Figure 2.3 : Veiling reflection: the reflection of light is masking information
on the screen. 7
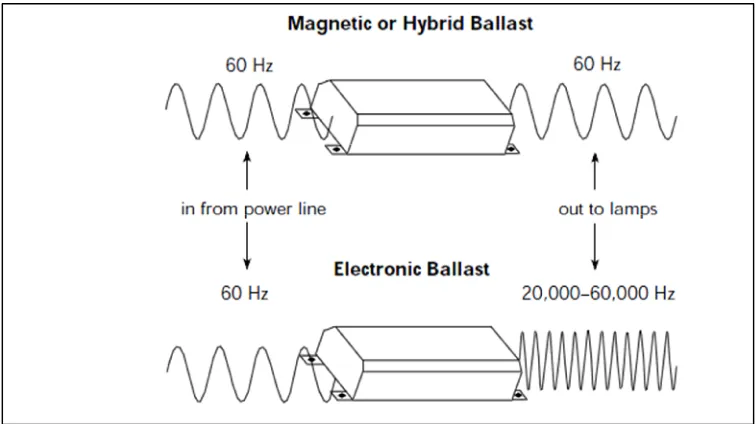
Figure 2.4 : Operating Frequencies ( in Hertz of Ballasts) 12 Figure 2.5 : Block diagram indicating main functions of electronic ballast 13
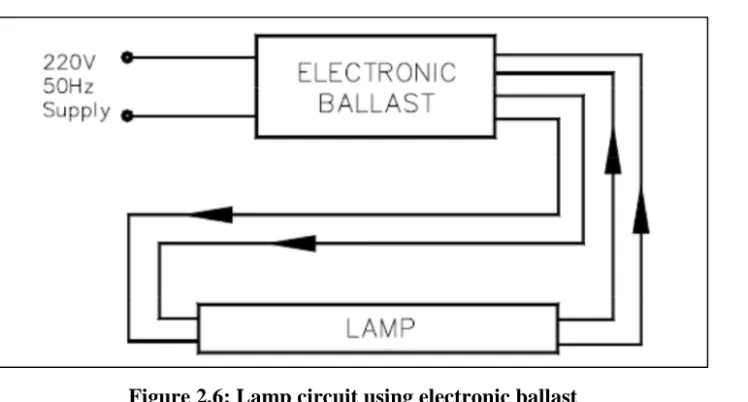
Figure 2.6: Lamp circuit using electronic ballast 13
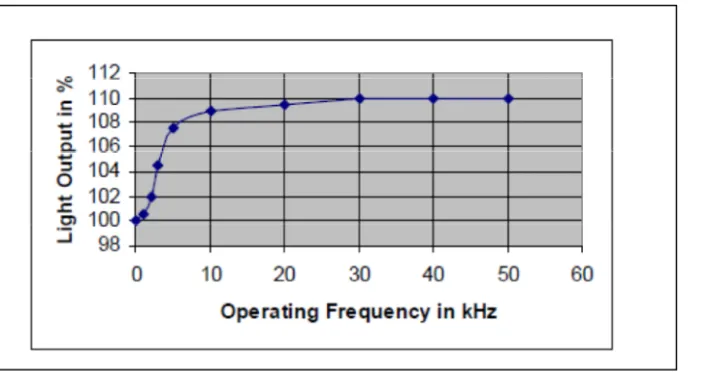
Figure 2.7 : Luminous flux of fluorescent lamp as a function of supply
frequency at constant Power 14
Figure 3.1: Energy Audit Process (Source: WECAM, 2009) 17
Figure 3.2 : Framework Lighting System 18
Figure 3.3: T8 Fluorescent lamp Lighting System 20
Figure 3.4 : T5 Fluorescent lamp Lighting System 20
Figure 3.5 : LED Lighting System 21
Figure 3.6 : DIAlux Software 26
Figure 4.1 : Hours of using laboratory 27
Figure 4.2 : Graph Room Index vs Luminaries N 33
Figure 4.3 : Output simulation for T8 Lighting System 36
Figure 4.4 : 3D rendering T8 Lighting System 37
Figure 4.5 : 3D light distribution display 37
Figure 4.6 : False colour in CAD luminance 38
Figure 4.7 : Output simulation for T5 Lighting System 39
Figure 4.8 : 3D rendering T5 Lighting System 40
Figure 4.9 : 3D light distribution display 40
Figure 4.12: 3D rendering LED Lighting System 43
Figure 4.13: 3D light distribution display 43
LIST OF APPENDICES
Appendix A : Data sheet T8 liii
Appendix B : Data sheet T5 liv
CHAPTER 1
INTRODUCTION
A considerable portion of the energy consumed in the electrical system in the world today is converted to artificial lighting. Light is essential to harmony between the activities of people in the contemporary world. With the increase in the energy consumption by different segments in relation to the difficulty of generation, it is possible to see the importance of efficient ways of lighting.
1.1 Research background
In educational buildings a significant component of the energy used is spent in illuminating the interior of the building. As the energy costs rise, increasing effort has gone into minimizing the energy consumption of lighting installations. This effort could follow three basic directions: new more efficient equipment (lamps, control gear, etc.), utilization of improved lighting design practices (localized task lighting systems), improvements in lighting control systems to avoid energy waste for unoccupied and daylight hours. Lighting plays an important role in the classroom. Having the dynamics of daylight in a classroom improves concentration and keeps young minds alert. This aids a healthy attitude to learning.
biological responses to light to enhance learning environments. It was described as a preliminary point to conserve energy consumption.
1.1.1 The important of understanding the high energy efficiency on campus
The use of energy in buildings has increased in recent years because of the growing demand in energy used for heating, ventilating and air conditioning (HVAC) and lighting in buildings. Owing to the consistently growing demand, much effort has now been put towards reducing the demand for energy through energy efficiency in design. Energy efficiency is energy intensity, which, in simple terms, refers to the use of less energy to provide the same level of energy service or to do more work with the same unit of energy (EIA; 1 IEA; 2 Fickett et. al, 1990). This objective can be achieved primarily by using a more efficient technology or process rather than by changes in individual behaviour (Diesendorf, 2007).
1.1.2 High energy efficiency as a holistic tool to improve energy consumption on
campus
The baseline energy and emissions scenarios for the higher education sector are presently unclear, which needs further investigation to create a reliable foundation for target setting. Without these baseline scenarios, it is also very hard to assess the environmental effectiveness of the existing policies and initiatives (Altan, 2010).
energy efficiency to their employees and not constantly advocating the importance of energy efficiency in the organization (Paulo and Gomes, 2009).
1.2 Problem statement
i. Installation Design for good energy usage begins by ensuring that lighting is not spread unnecessarily (Wan Norshafizan ..etc, 2010).
ii. Much lighting in commercial building has in the past been provided by regular arrays of ceiling mounted luminaries which giving uniform illuminance over the specific area.
iii. Energy efficiency is important for some main reasons such as reducing the operating costs and manages the electricity efficiency. High quality lighting design includes the coordinated selection of lighting, fixtures, fixtures placement.
1.3 Objective
The major objective of this research paper identify the energy usage discusses the performance of different types of lighting installations used in MTCC. In order to complete this research few objectives are set, which are:
To identify the ideal number of luminaire needed in certain room.
i. To determine the minimum required lamps in a specific place without reducing the quality of lighting.
ii. To identify the performance of different types of lighting installations used in the Masjid Tanah Community College and saving in energy consumption in the education building lighting application.
1.4 Project scope
1.5 Thesis outline
CHAPTER 2
LITERATURE REVIEW
2.1 Energy efficiency
Energy efficiency in buildings can be achieved in many ways, but fundamentally, one should not ignore the basics of the passive building designs. Passive building design is one of the main factors determining the building's energy performance, besides building services design and appliances and occupant behaviors (Al-Mofleh, Taib, Mujeebu, & Salah, 2009), the latter factors are difficult to control and maintain.
The efficiency of electricity use in each residential college was evaluated by adapting a method from (Saidur, Hasanuzzaman, & Rahim, 2010) who estimated energy intensity, EI in kWhlm2 by using following equation:
EI= AEC /TFA (2.1)
Where, AEC is annual energy consumption (kWh) and TF A is total floor area (m2). Principally, (Kamaruzzaman & Edwards, 2006) stated that the energy use per unit floor area can be described as 'Normalized Performance Indicators' (NPI), which is also known as the energy use index or Building Energy Performance (BEP) (Griffith, Long, Torcellini, & Judkoff, 2008).
office buildings in Malaysia is in the range of 200 to 250 kWh/m2/year (Jamaludin, Inangda and Mohdariffin, 2011).
2.1.1 Glare
If the light too bright, glare will result and may affect visibility. Disability glare usually happens when broad-band light illuminates on workstation, like light from window.
[image:15.594.206.455.288.447.2]Reposition the workstation to prevent such light sources falling within the field of vision. For example, align your workstation at right angle to windows and similar light sources.
Figure 2.1 : Disability glare from a light fitting
[image:15.594.207.454.494.646.2]Discomfort glare does not cause direct visual interference, but it can be annoying or uncomfortable. It can be caused by direct or reflected light. This can be avoided by:
i. Reposition the light source and, or workstation appropriately. ii. Avoid the use of well-polished surfaces and
[image:16.594.209.453.211.384.2]iii. Reduce the contrast between your work area and its surrounding.
Figure 2.3 : Veiling reflection: the reflection of light is masking information on the screen.
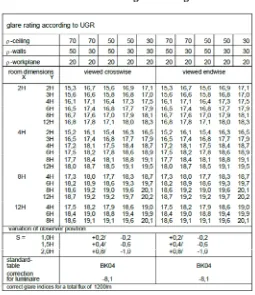
2.1.1.1 UGR Method
The "Unified Glare Rating" method (UGR) is a method developed by the International Lighting Commission CIE (Commission International de l'Eclairage) to standardized glare assessment worldwide.
The UGR method relates to glare from ceiling fixtures that are placed in a regular pattern. European standard EN 12461, Lighting of Indoor Work Places, contains a table in which the maximum allowed UGR value is prescribed per type of room and per type of activity. The UGR method produces a scale figure: below 13 no glare 13– 16 suited for accurate eye tasks 16–19 suited for average eye tasks 19–22 suited for moderate eye tasks 22 –28 suited for simple eye tasks above 28 not suited for work lighting .(technical guides emergency lighting guide, n.d.)
Table 2.1 : Glare rating according to UGR
2.1.1 Uniformity
Uniform light and brightness levels across a space can be desirable but may also be boring; in such cases, sparkle elements, color and/or other methods can be employed to create visual interest without causing fatigue.
luminaires in relation to ceiling fans. If ceiling fans are required in a space, position the luminaires so that they are suspended below the level of the fans.
Requirements for appropriate uniformity by followed IESNA uniformity criteria for specific areas unless superseded by other UFC criteria. Considerations for appropriate uniformity in office areas, uniformity should not exceed 5:1 in immediate work surrounds, and not including accent lighting. Exterior uniformity should not exceed 10:1 along areas of use including roadways, walkways, and parking areas.
2.1.2 Colour Rendering Index (CRI)
[image:18.594.159.503.452.611.2]Color rendering relates to the way objects appear under a given light source. The measure is called the "color rendering index", or CRI. A low CRI indicates than objects may appear unnatural under the source, while a light with a high CRI rating will allow an object's colors to appear more natural. For lights with a "warm" color temperature the reference point is an incandescent light. For lights with a cool color temperature the reference is sunlight. The table below lists typical color rendering index ratings for a variety of lights, including compact fluorescent light (CFL) bulbs.
Table 2.2 : Colour Rendering Index
CRI
22 high pressure sodium lighting street lighting
62 common 4 foot fluorescent tube office
80-85 compact fluorescent lighting (warm white) residential
85 premium 4 foot fluorescent tube retail
80-90 solid state LED lighting residential
95 incandescent light bulb residential
2.2 Lighting System
Lighting affects almost every aspect of our lives good lighting is invisible. You only notice the lighting of a room if it's too bright or too dim, not if it's just right. Lighting has a direct impact on the quality of our lives -good lighting enhances the mood and desirability of spaces and contributes greatly to a sense of well-being.
From the student perspective, the visual environment should be conducive to studied. Studies show that a well-designed working environment can aid recruitment and the retention of student as well as improving their morale. Another role that lighting can play is to make the environment of the class easy for lecturing and experimental studies. It needs to be visually prominent and provide lighting with maximum efficiency for all users. The immediate environment should be harmonious with variety of luminaires to give the eyes a chance to rest.
The most common aspects of lighting that cause visual discomfort are insufficient light, too much variation in illuminance between and across working surfaces, glare, veiling reflections, shadows and flicker. All these aspects are considered in the proposed design.
[image:19.594.191.469.616.721.2]Natural illumination in the office buildings requires correctly designed passive architecture to provide sufficient day lighting at some distance into the building but can also cause glare, overheating, high heating and cooling energy costs (Soori & Alzubaidi, 2011). Thus, artificial illumination is required to supplement daylight on a temporary or permanent basis. The basic parameters used in lighting design are luminous intensity, luminance, luminous flux and illuminance. Table 2.1 shows different types of lamps used in lighting applications with their luminous efficiency and lamp service life. (Soori & Alzubaidi, 2011). In this research we only concentrate 3 different type of lighting which is T8, T5 and LED.
Table 2.3 : Lamp efficiency and service life
Type of Lamp Lumens
per watt
Average lamp life in
Hours
T5 8-25 1000-2000
The energy used by lighting system depends on both the power rating of lamps used and the time. Energy efficiency can be achieved by using the most effective and efficient lighting equipment and control that can keep the energy requirement minimum whilst achieving the lighting design objectives
2.2.1 Illuminance
Illuminance levels are specified for specific visual tasks area. Illuminance is the luminous flux density at a surface measured in lumens per square meter (lm/m2) or Lux (lx). Light quality is an important factor in the design as it affects how well people can see to do visual tasks and how visually comfortable they feel. Also, it is important to energy efficiency because spaces with higher quality lighting need less illumination and less light fittings
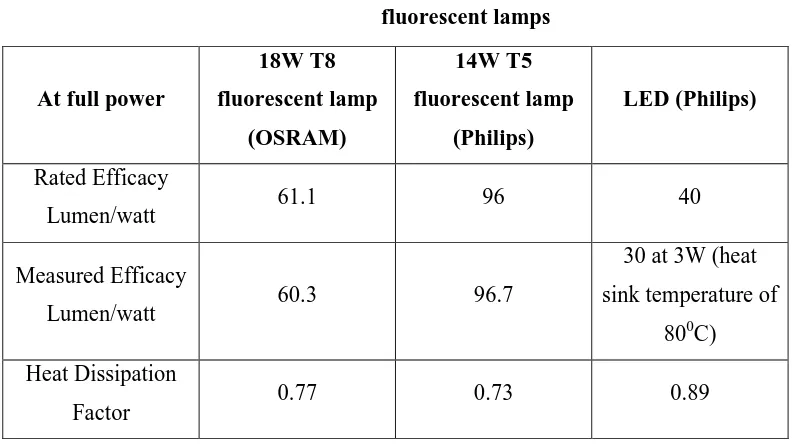
2.2.2 Heat dissipation
[image:20.594.127.523.501.724.2]At rated power, T5 and T8 fluorescent lamps generate about 73%–77% of their total power as heat, while three types of high-brightness LEDs dissipate about 87%–90% of input power as heat. Heat dissipation is an important factor particularly for air-conditioned buildings when overall energy efficiency is considered. (Qin, Lin, & Hui, 2009)
Table 2.4 : Comparison of luminous efficacy and heat dissipation of LEDs and
fluorescent lamps
At full power
18W T8 fluorescent lamp (OSRAM) 14W T5 fluorescent lamp (Philips) LED (Philips) Rated Efficacy
Lumen/watt 61.1 96 40
Measured Efficacy
Lumen/watt 60.3 96.7
30 at 3W (heat sink temperature of
800C) Heat Dissipation
2.2.3 Ballast
All electric discharge lamps, each fluorescent lamp requires a ballast to ignite the discharge and to properly control the discharge current. For optimal operation and long lamp life, it is important that the ballast provides adequate open circuit voltage, quick glow-to-arc transition, and low current crest in normal operation (John F. Waymouth, 1971). The choice of the ballast can be either electromagnetic or electronic. Both electromagnetic and electronic ballasts have their own advantages and disadvantages. The conventional electromagnetic ballast (which is sometimes simply called magnetic ballast) is operated at 50- or 60-Hz mains power frequency. It consists of a magnetic choke, a starter, and a power factor correction capacitor. The structure of the ballast system is simple, robust, and reliable. It can be used even under hostile working environments and has a very long service life. That is why electromagnetic ballasts have been around for over 60 years. However, the “conventional” magnetic
[image:21.594.141.519.385.597.2]ballast has its own shortcomings, i.e., poor power regulation ability and high power loss caused by the iron and copper losses in the magnetic choke.
Figure 2. 5 : Block diagram indicating main functions of electronic ballast
The ballast takes advantage of a characteristic of fluorescent lamp whereby greater efficacy is obtained at high operating frequency above 10 kHz. The overall lighting system efficacy can be increased by 20 to 30 percent due to three main factors:
i. Improved lamp efficacy at high frequency operation. ii. Reduced circuit power losses.
iii. Lamp operates closer to optimum performance in most enclosed luminaires.
Figure 2.6: Lamp circuit using electronic ballast
[image:22.594.144.518.370.571.2]The net effect is that same useful light output is maintained at lower power input in a typical luminaire.
Figure 2.7 : Luminous flux of fluorescent lamp as a function of supply frequency
at constant Power
Ballast losses are reduced compared to electromagnetic ballast, as the solid state circuit contains no conventional copper windings. In the case of a twin 1200mm 36W lighting circuit the losses can be reduced from 24W to a mere 6W when using electronic ballast. The overall achievement in a suitable luminaire, therefore, is an energy reduction in the region of 20% to 30%. These energy saving features enable lighting levels to be maintained with a dramatic cut in electricity costs. With less heat generated, the cooling load on air conditioning equipment will also be reduced. Other benefits electronic ballast offered include:
i. Rapid or instant starting of lamp without flickering.
ii. Single ballast can be designed to drive one, two, three or even four lamps. iii. Increased lamp life due to lower lamp operating current.
iv. Quiet operation without audible noise. v. Dimmable version is also available. vi. No visible flicker during operation. vii. No stroboscopic effect and HF operation.
x. Cooler ambient temperature inside luminaires for optimum operation of lamp, control gear, capacitor and batteries for emergency lighting. xi. Low operating temperature and reduce carbonization and blackening to
luminaire and decoration in the vicinity.
xii. Less effect on variation of luminous flux due to mains supplies voltage fluctuations.
xiii. Much lighter in weight.
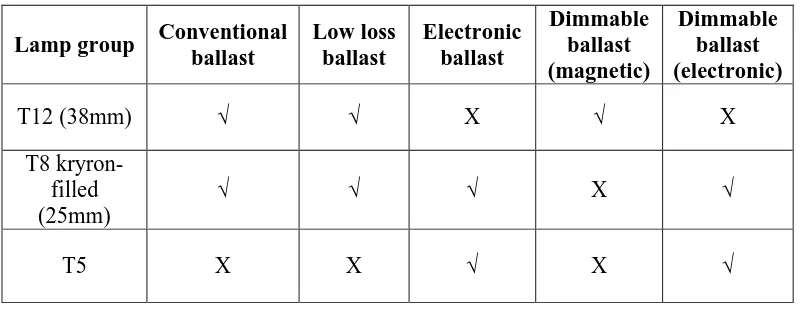
[image:24.594.131.531.325.480.2]Unlike other T8 lamps, the new T5 lamps are especially designed for operation with electronic ballasts for greater efficiency. Table 1 below summarizes the suitability of ballast types for various fluorescent lamp groups.
Table 2.5 : Suitability of ballast types for various fluorescent lamp groups
Lamp group Conventional ballast
Low loss ballast
Electronic ballast
Dimmable ballast (magnetic)
Dimmable ballast (electronic)
T12 (38mm) √ √ X √ X
T8 kryron-filled (25mm)
√ √ √ X √
CHAPTER 3
METHODOLOGY
1.
In order to accomplish this research, there are five (5) phase to be complete. The research has been done using Energy Audit Process (WECAM, 2009).
Figure 3.1: Energy Audit Process (Source: WECAM, 2009) Determine the lighting requirement.
Select adequate lamp fit
Estimate the required number of the light fixtures
Simulation DIAlux
Figure 3.2 : Framework Lighting System Determine the
lighting Requirement
Select Adequate Lamp Fit for T5 Lighting System
Select Adequate Lamp Fit T8 for Lighting System
Select Adequate Lamp Fit for LED
Lighting System
Estimate the required number of light fixtures for
T5 Lighting System
Estimate the required number of light fixtures for
T8 Lighting System
Estimate the required number of light fixtures for
LED Lighting System
Simulation DIAlux for T5 Lighting
System
Simulation DIAlux for T8 Lighting
System
Select Adequate Lamp Fit for LED
Lighting System
Operation cost:
a) Life cycle cost b) Result
payback for T5 Lighting
System
Operation cost:
Life cycle cost Result payback for T8 Lighting
System
Operation cost:
Life cycle cost Result payback for LED Lighting
System
3.1 Determine the lighting requirement
[image:28.594.186.476.207.422.2]From the flow chart at figure 3.1 the first thing to determine is the lighting illuminance requirement by knowing the lux level. For each area, there is a recommended lux level as in Table 3.1.
Table 3.1: Recommended Lux (lx) values
Area/location Lux (lx)
Open plan office mainly screen based work 300 Open plan office mainly paper based work 500
Deep plan core area (more than 6m from
window) 500
Cellular office-mainly screen based work 300 Cellular office-mainly paper based work 500
Graphics workstations 300
Dealing rooms 300- 500
Executive offices 300- 500
In this research, researcher determine that the room is an open plan office mainly paper based work. Therefore the room needs at least 500 lux based on Raynham (2009) table.
3.2 Select adequate lamp fit
There are 3 different cases will be done in research, which is by using 3 different method of lighting system:
3.2.1 Case 1: Using T8 Lighting System
Figure 3.3: T8 Fluorescent lamp Lighting System
Below are the details about the lamp:
Luminaire : TMS022 2xTL-D36W HFS +GMS022 R
Total Lamp Flux : 5250 lm Light Output Ratio : 0.71 System Flux : 4757 lm System Power : 72 W
LxBxH : 1.23x0.10x0.06 m
Ballast : HF Standard
3.2.2 Case 2: Using T5 Lighting System
In case 2, new lighting systems T5 were introduced. It is because to get comparison luminance between T8 and T5 in same group which is a Compact Fluorescent Lamp (CFL).
[image:29.594.262.396.519.647.2]Below are the details about the lamp:
Luminaire : TMX204 2xTL5-28W HFP +GMX555 MB
Total Lamp Flux : 5250 lm Light Output Ratio : 0.70 System Flux : 3675 lm System Power : 62 W
LxBxH : 1.17x0.06x0.09 m
Ballast : HF Performer
[image:30.594.266.393.287.414.2]3.2.3 Case 3: Using LED Lighting System
Figure 3.5: LED Lighting System
Below are the details about the lamp:
Luminaire : BMS022 2xLT-GA25W/865
Total Lamp Flux : 3400 lm Light Output Ratio : 1.00 System Flux : 3800 lm System Power : 50 W
LxBxH : 1.52x0.10x0.07 m
3.3 Luminaries
For calculating lighting system basic design is the lumen method. General lighting requirement must be determined for that surface such as number of foot candles (lumen per square foot), room area, light loss due to room proportions, colour of walls, coefficient of utilization and maintenance factor. The researcher shall utilize the ‘lumen’ manual calculations to compare these to luminaires (T5, T8 and LED) to
illustrate the differences before utilizing the real time measurements and the computer program. The calculation can be seen in figure 4.9.1.
Where:
A = Floor area to illuminate (m2) N = Number of luminaire required (unit)
[image:31.594.112.563.262.502.2]E = Required flux F = Initial lamp lumen n = Lamp per luminary MF = Maintenance factor UF = Utilization Factor
Figure 4.9.1 Lumen calculation (Interior Lighting Guide, 1997)
3.3.1 Room Index (RI)
The room index (RI) is the ratio between the surface of the working plane and the half surface of adjacent the walls. This indicates whether is narrow and high, low and wide. These influences the amount of light that is reflected to the working plane form the walls.
The room index need to determine first before proceed with coefficient of utilization. Below is the equation to determine the RI (Wan Norshafizan et al., 2010)
Where
L = Room length (meter)
W = Room Width (meter)
H = Room High (meter)
RI = Room Index
3.3.2 Utilization Factor (UF)
[image:32.594.224.443.408.558.2]The utilization factor indicates how well a lighting installation uses the luminous flux of the lamps. This is indicated as the ratio between the luminous flux that reaches the working plane and the light source of the bare lamps, expressed as a percentage.
Table 3.2: Quantity Estimation Diagram
Table 3.2 can be referring from the each data sheet type of lighting system at the appendices. By taking the value of reflectance 0.70, 0.50 and 0.20 and the value of room index (k) we can find the value of Utilization factor.
Table 3.3 : Utilization Factor
Room
index
k
reflectances for ceiling , walls and working plane (CIE)
0.80 0.80 0.70 0.70 0.70 0.70 0.50 0.50 0.30 0.30 0.00
0.50 0.50 0.50 0.50 0.50 0.30 0.30 0.10 0.30 0.10 0.00
0.30 0.10 0.30 0.20 0.10 0.10 0.10 0.10 0.10 0.10 0.00
0.60 0.34 0.33 0.34 0.33 0.32 0.27 0.27 0.23 0.26 0.23 0.22
0.80 0.42 0.40 0.41 0.40 0.39 0.34 0.33 0.30 0.33 0.30 0.28
1.00 0.48 0.45 0.47 0.46 0.44 0.39 0.39 0.34 0.38 0.35 0.34
1.25 0.55 0.50 0.53 0.51 0.49 0.45 0.44 0.41 0.43 0.40 0.39
1.50 0.59 0.54 0.58 0.55 0.53 0.49 0.48 0.45 0.47 0.44 0.43
2.00 0.66 0.59 0.64 0.61 0.59 0.55 0.54 0.51 0.53 0.50 0.49
2.50 0.71 0.65 0.69 0.65 0.62 0.58 0.57 0.55 0.56 0.54 0.53
3.00 0.74 0.62 0.72 0.67 0.64 0.61 0.60 0.58 0.59 0.57 0.55
4.00 0.78 0.67 0.75 0.71 0.66 0.64 0.63 0.61 0.62 0.60 0.59
5.00 0.80 0.69 0.78 0.73 0.68 0.66 0.65 0.63 0.64 0.62 0.61
Utilization factor (UF) table also can be finding at every each data sheet lighting system at the appendices. Example value of reflectance 0.70, 0.50 and 0.20 and the RI is 1.25 for T8 lighting system so the value of UF is 0.51.
Table 3.3 : Utilization Factor
Room index
k
reflectances for ceiling , walls and working plane (CIE)
0.80 0.80 0.70 0.70 0.70 0.70 0.50 0.50 0.30 0.30 0.00 0.50 0.50 0.50 0.50 0.50 0.30 0.30 0.10 0.30 0.10 0.00 0.30 0.10 0.30 0.20 0.10 0.10 0.10 0.10 0.10 0.10 0.00 0.60 0.34 0.33 0.34 0.33 0.32 0.27 0.27 0.23 0.26 0.23 0.22 0.80 0.42 0.40 0.41 0.40 0.39 0.34 0.33 0.30 0.33 0.30 0.28 1.00 0.48 0.45 0.47 0.46 0.44 0.39 0.39 0.34 0.38 0.35 0.34 1.25 0.55 0.50 0.53 0.51 0.49 0.45 0.44 0.41 0.43 0.40 0.39
REFERENCES
Al-Mofleh, A., Taib, S., Mujeebu, M. A., & Salah, W. (2009). Analysis of sectoral energy conservation in Malaysia. Energy, 34(6), 733–739.
doi:10.1016/j.energy.2008.10.005
Alzubaidi, S., & Soori, P. (2012). Energy Efficient Lighting System Design for Hospitals Diagnostic and Treatment Room—A Case Study. Journal of Light & Visual Environment, 36(1), 23–31. Retrieved from
http://japanlinkcenter.org/DN/JST.JSTAGE/jlve/36.23?from=Google
Chou, B. S. K. (2004). Performance-based Standards for Energy Efficient Buildings Introduction-Situation and Observations.
Design, L., Clause, M., & Guidelines, T. (2009). Energy Efficient Lighting Design. Development of Policies, Regulations and Guidelines for Bangalore Municipality and Development Authority. Retrieved from http://www.reeep.org/
Griffith, B., Long, N., Torcellini, P., & Judkoff, R. (2008). Methodology for Modeling Building Energy Performance across the Commercial Sector Methodology for Modeling Building Energy Performance across the Commercial Sector. Retrieved from
http://www.energystar.gov/index.cfm?c=eligibility.bus_portfoliomanager_eligibil ity
Jamaludin, A. A., Inangda, N., & Mohdariffin, A. R. (2011). ENERGY
PERFORMANCE OF THREE RESIDENTIAL COLLEGE BUILDINGS IN UNIVERSITY OF MALAYA, 59–74.
John F. Waymouth. (1971). Electric discharge lamps (p. 353). Massachusetts: Cambridge, Mass., M.I.T. Press [1971].
Joseph, I., & Mwasha, A. (2010). A review of building energy regulation and policy for energy conservation in developing countries. ScienceDirect, 38(12), 7744. Kamaruzzaman, S. N., & Edwards, R. E. (2006). Evaluating performance
Qin, Y., Lin, D., & Hui, S. (2009). A simple method for comparative study on the thermal performance of LEDs and fluorescent lamps. Power Electronics, IEEE Transactions on, 24(7), 1811–1818. Retrieved from
http://ieeexplore.ieee.org/xpls/abs_all.jsp?arnumber=5175610
Saidur, R., Hasanuzzaman, M., & Rahim, N. (2010). Energy Consumption, Energy Savings and Emission Analysis for Industrial Motors. Wood and wood products. Retrieved from http://www.iieom.org/paper/Final Paper for PDF/224 R.
Saidur.pdf
Soori, P., & Alzubaidi, S. (2011). Study on improving the energy efficiency of office building’s lighting system design.GCC Conference and Exhibition (GCC), …, 585–588. Retrieved from
http://ieeexplore.ieee.org/xpls/abs_all.jsp?arnumber=5752604
Tariff Rates. (2012). Retrieved from http://www.tnb.com.my/residential/pricing-and-tariff/tariff-rates.html
technical guides emergency lighting guide. (n.d.). Retrieved from www.havells-sylvania.com
Votano, J., Parham, M., & Hall, L. (2004). LIFE-CYCLE COST AND PAYBACK PERIOD ANALYSIS.Chemistry & …. Retrieved from
http://onlinelibrary.wiley.com/doi/10.1002/cbdv.200490137/abstract Wan Norshafizan, W. muhamad, Mohamad Yusof Mat, Z., Norfishah, W., Noor