Buffer Zone Implementation at Residential Area
Mohd Hilmi Izwan Abd Rahim
1, Narimah Kasim
2, Haryati Shafii
3Department of Construction Management1 Universiti Tun Hussien Onn Malaysia 86400 Parit Raja, Batu Pahat Johor, Malaysia
Department of Construction Management2 Universiti Tun Hussien Onn Malaysia 86400 Parit Raja, Batu Pahat Johor, Malaysia
Department of Construction Management3 Universiti Tun Hussien Onn Malaysia 86400 Parit Raja, Batu Pahat Johor, Malaysia
Abstract— In developing countries, urbanisation has been synonymous with industrialisation where the growth of industries offer job opportunities and incentives for economic development, urban settlements and rapid housing expansions. In Malaysia the lack of awareness compliance of buffer zone implementation for urban development of the housing may have to nestle within industrial establishment. Industrial activities often cause environmental problems such as excessive noise levels and poor air quality, which is turn affect the natural environment, health and comforts of life in the residential-industrial neighbourhood. This paper reports the findings regarding the buffer zone implementation in residential-industrial neighbourhood. This paper reviews the comparison data of noise level measurement in the residential area with and without buffer zone. The experimental method is carried out to measure the noise level in the residential area which is having buffer zone and without buffer zone. The data will analysis by using the Microsoft Excel to get the average of noise produced. It responds to the lack of environmental policies for housing development in residential-industrial areas in Malaysia. The ongoing development of this research will eventually lead to increase the awareness among the construction industry players for promoting the use of buffer zone implementation guidelines in these residential areas.
Keywords—Buffer Zone; Noise Level; Residential neighbourhood; Awareness.
I.
Introduction
Noise pollution is the environmental pollution which contributes by the human activity and development in tandem with an increase in the current population. Noise pollution which is happening nowadays is very annoying and cause harm, especially to men [1]. Noise pollution could be defined as any sound that interferes and causes harm in which they are unwelcome and unwanted by the listener. Environmental Quality Act [2] states that noise means any changes either directly or indirectly related to the physical properties, chemical, biological or radioactive level in any part of the environment by discharging, emitting or depositing wastes at the expense of functionality and usability to health, safety or welfare or life, people, animals, and plants.
The resulting noise pollution impairs the comfort as a whole because people have the ability to receive a minimum frequency of sound only [2]. However, there are a few people who are able to receive a maximum sound frequency level such as a musician which exposed to a loud noise produced by musical instruments. Noise pollution can contribute an adverse effect on human physiology and psychology [2]. Noise pollution is a hidden pollutant which would impact in damage and cause harm in long-term period and permanent nature. This paper is aim to view the comparison noise level between residential areas with buffer zones and residential house do not have a buffer zone.
II.
Noise
The word "Noise" is derived from the Latin Word "Nausea," meaning seasickness. These days, however, many people considerer an intense sound to be noise, but defined strictly noise does not just constitute only intense sound, rather, it is also a complex sound with little or no periodicity i.e. it is produced by non-harmonic motion and is without any agreeable musical quality [3]. The sound called noise, can be thus additionally intermittent, multi-frequency and impulsive in nature. Defined psychologically, however, noise is just any sound undesired by the recipient and may adversely affect the health and well being of individuals or populations [3].
The type of sound generally encountered by a person in normal working and living environments is either steady state or steady state mixed impulsive sound. Some of the noisy environments, tonal components are also present. These sounds of all intensities, spectral characteristics, intermittence and exposure time, whether impulsive or regular, constitutions. All these sounds arouse a feeling of displeasure in human beings.
A. Sound Become Noise
in department stores, for example, is enjoyed by some shoppers but drivers others to distraction.
The way we react to sound, to noise, is influenced by a number of factors. Acousticians estimate that about one in ten people are particularly noise sensitive. Typically these people will become 10 per cent more annoyed by noise than the general population, according to the German psychologist [4]. Noise is measured by its loudness (decibels) and its frequency (hertz). It is when we put the loudness and frequency that we can get an idea of how disturbing a particular noise may be [3]. Just to confuse matters, frequency does not mean how often a noise happens and it about how high or low the pitch of the noise is.
B. Neighbourhood Noise
Everyone likes to have good neighbours but for a growing number of people there is a lack of harmony across the garden fence because conflict with their neighbours regarding noise. In modern times, neighbour noise has been over from traffic and aircraft noise with complaints rising fivefold in the last decade [5] [6].
[image:2.595.33.294.445.504.2]An increase in population in the 1960s and 1970s fuelled the need to build more homes. To cope with demand, high-rise flats were built. Then throughtout the 1980s and 1990s the demand for smaller units for single people or couples without children resulted in many older, larger family-size houses being converted into flats. Building regulations at the time did not require the testing of sound insultion in properties, so standards were often not adequate to protect people from everyday sounds their neighbours made. Table 1 shows noise limitation in various area by the Department of Environment (DOE) as below.
TABLE I. NOISE LIMITATION BY DOE [7]
Area Zoning
Allowable noise level limits dB (A)
Daylight 7.00 a.m – 10.00 p.m
At Night 10.00 p.m – 7.00 p.m
Residential Area 55 50 Commercial Area 60 55 Industrial Area 65 60
III.
Buffer Zone
A buffer zone is an area that was created in the noise pollution affected area. It is an area of green network that covers parking lots, vehicle access, pedestrian walkways and areas for tree planting, landscaping and grassland. There are various forms of buffer zone such as recreational parks and barrier walls. Usually, the buffer zones will be developed in areas which function to separate the affected regions to prevent noise emissions to the particular neighborhoods. The buffer space requirement is in accordance with the standard proposed by DOE in which not less than 70 percent of the buffer zone should be provided [8]. The buffer zone is a method used to control pollution in residential areas. The fast development in line with economic growth contributes to the increase in pollution, especially in rapidly developing areas [2].
A. Type of Buffer Zone
There are three types of noise barriers, which reflect, absorbing and reactive chosen for reasons of noise, but this choice also determines the conditions and situations. Behind capacity of absorbing and always less reactive, while reflecting the sound barrier and visual barriers able to reduce the noise [9]. Buffer zone allows a full or partial view through the barrier and not in direct light with the use of an opaque structure.
Sound absorbing barrier consists of porous elements that absorb sound. Less absorption materials such as mineral wool protected established and included in the skin, where the side facing the noise is hollow. Reactive barriers are those that incorporate a cavity or resonator is designed to weaken certain frequencies of sound. There are several types of buffer zones [9]:
A natural buffer zone Concrete wall Timber Steel
B. Buffer Zone Guidelines
The design and guidelines for buffer zone development was provided by the Town and Country Planning Department with the proposal of DOE. It is stated that the designated buffer zone is not including the road reserve area. A buffer zone is necessary not less than 70 percent of the designed area. A buffer zone should be provided with a strip of 30 meters crops for special and heavy industry, 20 meter buffer zone design for small and medium industries; and 10 meters in the light industry. Development areas can be considered in the physical buffer zone is not more than 30 percent of the buffer zone areas being like roads, drains and ditches, rivers and lakes, parking, open space, service industries, warehousing and non-food agricultural crops [7]. Buffer zone at least have to provide 1.5 meter wide and landscape reserve 5 feet facing to the buildings. Table II shows the guidelines for the buffer zone distance base on the type of Industries.
TABLE II. TABLE OF SUMMARY SITTING AND ZONING INDUSTRIES [10]
Type of Industries
Description and Standard Requirements Distance
of Buffer Zone
Light Industries shall not generate excessive noise.
Industries shall not discharge industrial effluent apart from sewage.
Industries shall not use any raw materials which are toxic and hazardous and therefore will not produce any scheduled wastes.
Industries shall have height restrictions determined by the Local Authority.
50 m
Medium These industries could generate significant noise from machineries, generators etc. But which could be controlled to meet the level not exceeding 65dB (A) Leq at the factory boundary, and not exceeding 55 and 45 dB (A) Leq at the residence/buffer zone boundary during day and night time respectively.
Industries could emit some gaseous emission but which can be controlled to
comply with the Environmental Quality (Clean Air) Regulation 1978.
The industries could produce some industrial effluent that can be treated on site before being discharged to meet the Environmental Quality (Sewage and Industrial Effluent) Regulation 1979, standard A or B depending on the site.
The industries shall be located in designated industrial estates or zones.
With good compatibility within the industrial estates and zones to ensure good industrial mixing.
Heavy Heavy industries must be sited in designated industrial estates or designated industrial zones with sufficient buffer zones from residential areas, livestock farm, agricultural farms, recreation areas and tourist designated areas. A minimum distance from the fence of the industry to the nearest residential area is 500 meters, to be finalized by the EIA Report.
These industries could generate excessive noise from its operations but for which design solutions are incorporated in the form of appropriate high technologies to reduce the noise level generated to a level to meet the WHO recommended level of not greater that 65 dB (A)
At the factory boundary and not exceeding 55 and 45 dB (A) at the residence/ buffer zone boundary during day and night time respectively
[image:3.595.300.544.364.605.2]500 m
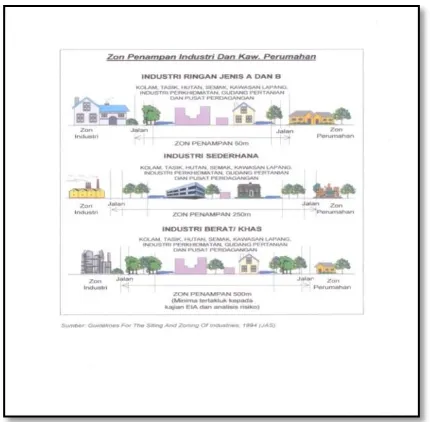
Figure 1 shows the sitting and the zoning for industries by DOE. The figure shows three difference zoning area which is light industries, medium industries and heavy industries. There are three differences between the length of buffer zone areas.
Fig. 1. THE SITTING AND ZONING INDUSTRIES (SOURCE: [10])
IV.
Methodology
Research methodology refers to the principles and procedures of logical thought processes which apply to a scientific investigation [11]. Method concerns the techniques which are available and those which are actually employed in a research project [12]. It has been set up in order to achieve
the aim of this paper. Literature review has been conducted to gain information on noise pollution, use of buffer zone, and buffer zone guidelines implementation. The literature review could form in various sources such as books, journal and conference articals, reports, and material sources from the internet.This research involved the experimental method which was carried out in residential areas which having a buffer zone and without buffer zone.
A. Experimental Method
Noise measurement technique is a technique used to determine the level of noise pollution in the housing area. The noise measurement process could be done by physical methods such as using tools to measure the level of noise that penetrates into the housing area. Sound Level Meter (SLM) is the tool’s that can be used to measure the noise level in the housing area. This is the instrument used to measure sound levels [13]. It is so designed that it responds to sounds in approximately the same way as the human ear will respond to any sound, giving thus an objective, reproducible measurement of sound levels. This tool measures the noise level in the studied area with using the units of decibels (dB). The basic component in SLM is a microphone, amplifier, filter frequency and display device [14]. The function of the main components in SLM is described in Table III and Figure 2 show the Sound Level Meter.
TABLE III. MAIN COMPONENTS IN THE SLM [13]
Equipments Functions
Microphone Its function is to convert the sound pressure level on the difference in electrical current flow. Amplifier Increase the electric current direction to a
reasonable level.
Frequency Filter Analysing the electrical signals.
[image:3.595.55.270.428.639.2]Meter Displays the value of reading sound signals in digital form shaped measuring decibels (dB).
Fig. 2. SOUND LEVEL METER
B. Selection of Measurement Location
buffer zone. The selection of the participants was made either random or non-random [11]. The participants might be selected by random selection or random sampling. Figure 3 shows the area of Pasir Gudang.
Legend PGMC Area
River Roads
[image:4.595.306.563.52.129.2]Highway
Fig. 3. AREAS OF PASIR GUDANG MUNICIPAL COUNCIL (SOURCE: [16])
V.
Analysis and Discussion
This section summarized the result findings from data collection. The data were collected using an experimental technique using the SLM device that was carried out in a residential area with having and without a buffer zone in Pasir Gudang, Johor. The residential areas were located in a high-risk areas contaminated by noise resulting from the environment such as industrial areas and traffic congestion. Figure 4 shows the location of the SLM device for the experiment. The device should be placed according the DOE guidelines in order to get a precise reading of the noise levels.
1.5m
Residential Area SLM Industrial Area
Fig. 4. PLACING OF SOUND LEVEL METER (SLM) (SOURCE: [7])
Measurements are taken at peak hour in the morning, afternoon and evening. Noise measurement are taken in week days. The data obtained will be analysed and compared with environmental compliance guideline set by DOE within 20 minutes in one hour [7]. The results from the SLM readings were analysed using Microsoft Excel to get the average (min) readings. Then, the noise level is compared with the data observed in areas with buffer zones [17].
A. "Perjiranan 10" Area
From the results of noise measurement conducted, the average value of the initial parcel sound reading for "Perjiranan 10" is shown in Table IV. The results show the average value of the noise measurement obtained in three different peak hours.
TABLE IV. READING AVERAGE OBSERVATION NOISE 'PERJIRANAN 10"
Time Day Average Readings
dB (A)
Limitation DOE (Residential Area) dB (A)
Morning Monday 76.2 60
Wenesday Friday
77.1 75.4
Afternoon Monday
Wenesday Friday
73.96 78.2 77.51
60
Evening Monday
Wenesday Friday
82.4 84.09
86.9
60
Table IV present about the experimented data from "Perjiranan 10 " area. The location of "Perjiranan 10" which is located near the industrial area were polluted with the noise pollution. Based on the limitation by Department of Environment, the limitation of noise at residential area is 60dB. From the experiment, the noise is produced in residential-industrial at "Perjiranan 10" are exceed than noise limitation given by Department of Environment. The other causes of noise pollution at "Perjiranan 10" is near to the industrial area. The location of the "Perjiranan 10" are not suitable for the residential areas. The distance is less than 30 meters has increased the problem of noise pollution.
The development industrial area which is close to the "Perjiranan 10" was not properly planned. According to the local authority, the development of that industrial area was among the earliest development in that area. The high demand for residential house and increase in the employment rates has lead to the development of residential areas nearby the industrial area. The lack of usable land for urban development result in some of the housing estates nestle within the industrial establishment [18]. However, the distance of the residential area to the industrial area which is about 28.4m does not meet the standards set by DOE. In the DOE guideline, the development of residential area must follow the guidelines: 500m for heavy industry, 150m for medium industry and 50m for light industry.Then at "Perjiranan 10", there is no buffer zone provided to avoid the noise pollution or other pollution from the industrial area. That is one of the causes of the noise pollution at "Perjiranan 10" are exceeded.
B. "Perjiranan 8" Area
The next noise measurement was taken from the TNB residential area which is the "Perjiranan 8". An industrial development area near the "Perjiranan 8" of steel was used as a planned industrial area. Local authorities had planned industrial areas by providing a buffer zone as a medium barrier disruption to industry activities housing environment. Within a distance of 180m, the buffer zones which consist of high plants, lush plants and roads are a separate residential area from the industrial area.
[image:4.595.36.283.118.221.2] [image:4.595.37.296.382.469.2]Table V shows the reading average observation Noise for "Perjiranan 8".
TABLE V READING AVERAGE OBSERVATION NOISE FOR 'PERJIRANAN 8".
Time Day Average
Reading dB (A)
Limitation DOE dB (A)
Morning Monday
Wenesday Friday
55.6 56.01 55.02
60
Afternoon Monday
Wenesday Friday
55.8 56.8 56.49
60
Evening Monday
Wenesday Friday
56.68 55.86 55.82
60
The average noise measurement for "Perjiranan 8" shows that the average noise value was complying with the standard sets by DOE. The measurement made the surrounding area at "Perjiranan 8" shows that the buffer zone area was developed by local authority.
VI.
Buffer Zone Implementation
at Residential Area
Implementation of the buffer zone is one step that can be used to reduce noise pollution. Based on the literature, the buffer zone is the isolation area which is created in order to prevent noise dissemination into unwanted areas [19]. Based on the experiment at "Perjiranan" 8 and "Pejiranan 10" there are two type of residential areas which is use buffer zone and without buffer zone.The design and guidelines for buffer zone development was provided by the Town and Country Planning Department with the proposal of DOE. It is stated that the designated buffer zone is not including the road reserve area. A buffer zone is necessary not less than 70 percent of the designed area. A buffer zone should be provided with a strip of 30m crops for special and heavy industry, 20m buffer zone design for small and medium industries; and 10m in the light industry. Based on the data collection from experimental at "Perjiranan 10" showed the noise produce at residential area is exceed between the noise produce at "Perjiranan 8" is lower than noise emision from DOE. "Perjiranan 8" is area which is located near the industrial areas but the residential area was provided by the bufer zone. The experimental. data prove that buffer zone can reduce the noise pollution.
Development areas can be considered in the physical buffer zone is not more than 30 percent of the buffer zone areas being like roads, drains and ditches, rivers and lakes, parks, open space, service industries, warehousing and non-food agricultural crops [20]. According to John [21], a buffer zone reduces noise pollution in particular. These are the positive impact of the noise pollution problems in residential areas. Among the methods used to control external noise are to ensure that the distance is appropriate, avoid directional sound zone, containment, planning to use part of the building that are not sensitive to noise as a deterrent, placing the aperture away from the noise source and the noise insulation of the exterior building [9].
VII.
Conclusion
The development of industries in various sectors such as factories, transportation, education, social and economic indirectly contributed to the increase in noise pollution. Various initiatives taken by the Government, particularly in addressing the problem of noise pollution. Among the initiatives taken by the government is monitoring period to cause pollution problem, awareness campaigns, and campaigns through the mass media. Preparation of buffer design guidelines is among the efforts by the government to ensure that the development of residential, industrial, education, tourism and others are complying the guidelines. The main issue in this study is the failure of certain parties to comply with the guidelines that have been established. The buffer zone is a step that can be used to control noise pollution in areas at risk of noise pollution in particular neighborhoods near busy traffic areas, heavy industrial areas such as factories and construction development. From the findings, the differences between the two types of area which is having a buffer zone and do not have a buffer zone are produce different level of noise. It was proven that the buffer zone implementation can reduce the noise pollution especially in residential-industrial areas.
Acknowledgment
The authors would like to thank the Office of Research, Innovation, Commercialization and Consultancy (ORICC), UTHM, for supporting this research under Postgraduate Incentive Research grant (GIPS) Vot No. 1161.
References
[1] K. Zakaria, "Perhutanan Bandar dan Kawalan BunyiBising, Kesan Haba dan Habuk," UTM Skudai, Malaysia,1988.
[2] Department of Environment, The Planning Guidelines for Noise Labelling and Emission Limits of Outdoor Source, Department of Environment, Ministry of Natural Resources and Environment, 2004.
[3] John Stewart, Why Noise Matters A Worldwide Prespective On The Problems, Policies And Solution, TJ International Ltd., 2011.
[4] Guski,R. Personel and Social Variables as Co-Determinants of Noise Annoyance. Noise and Health Journal, Vol 1, no 3, pp45-56. 1999.
[5] NSCA (National Society for Clean Air). Controlling Neighbour Noise. National Society for Clean Air, Brighton. 1990.
[6] Office for National Statistic. Social Trends Survey. www.statistics.gov.uk/socialtrends37. 2007
[7] Department of Environment Ministry of Natural Resources and Environment, The Planning Guidelines for Environmental Noise Limits and Control, DOEM, 2004.
[8] Jalal, A. And , Fikri, M., Awareness of Noise Hazard From Construction Site, UTM Skudai, 2008.
[10]Jabatan Perancang Bandar dan Desa Negeri Selangor, Garis Panduan dan Piawaian Perancangan Negeri Selangor, 2nd edi, Jabatan Perancang Bandar dan Desa, 2012.
[11]J. W. Creswell. Qualitative Inquiry and Research Design: Choosing Among Five Approaches. Sage Publications Ltd, London, 2007.
[12]F. Richard And L. Anita, "Research Methods Of Construction," Blackwell Science Ltd, USA, 1997.
[13]Singal,S.P., Noise Pollution and Control Strategy (1st ed). Alpha Science Internatonal Ltd. 2005.
[14]Smirth, H., Peter, J., Meivin, B., Resor, C., and Garcia, H. Noise Elements- The city of Morrow Bay General Plan. Brown-Buntin Associates. Inc., 1993.
[15]Merriam, S. B., Qualitative research and case study applications in education. San Francisco, 2001.
[16]Pasir Gudang Municipal Council, Laporan Tahunan
Majlis Perbandaran Pasir Gudang, 2012 edi, 2012.
[17]Chua, Y. P., Kaedah Penyelidikan,1st ed, Malaysia:McGraw-Hill (Malaysia) Sdn. Bhd., 2006.
[18]Zakaria, R., Yang, J., Smart and Sustainable Inhabitation in Residential-Industrial Neighbourhood. IEEE Conference Paper. 0-7803-8519-5/04. pp209-213. 2004.
[19] Environment Protection Agency (EPA), Noise Pollution - A Health Hazard for Seniors, EPA, 2012
[20] Jalal, A. And , Fikri, M., Awareness of Noise Hazard From Construction Site, UTM Skudai, 2008.
![TABLE I. NOISE LIMITATION BY DOE [7]](https://thumb-us.123doks.com/thumbv2/123dok_us/8771339.899073/2.595.33.294.445.504/table-noise-limitation-by-doe.webp)
![Fig. 3. AREAS OF PASIR GUDANG MUNICIPAL COUNCIL (SOURCE: [16])](https://thumb-us.123doks.com/thumbv2/123dok_us/8771339.899073/4.595.37.296.382.469/fig-areas-pasir-gudang-municipal-council-source.webp)
